A. Ruckelshausen et al.: Digitale Transformation – Wege in eine zukunftsfähige Landwirtschaft, Lecture Notes in Informatics (LNI), Gesellschaft für Informatik, Bonn 2017 77
Classification of agricultural land use and derivation of biophysical parameter using SAR and optical data
Patrick Knöfel1, Thorsten Dahms1, Erik Borg2 and Christopher Conrad1
Abstract: Agricultural monitoring is essential for global issues, which can be reflected by the terms of food security and ensuring ecosystem services. Due to the high spatial and temporal resolution of the remote sensing sensors enormous potential for precision farming has been worked out in cooperation between science and the private sector. However, the quality of field specific yield estimations, for instance, is highly influenced by the accuracy of the underlying information like land use, plant development, and stress indicators. Thus, particular knowledge about the accu- racy of all the relevant indicators is crucial for agricultural monitoring. The chair of remote sens- ing at the University of Wuerzburg has gained a lot of expertise in this context by working on their three latest ongoing projects with agricultural focus. Within the framework of these projects, a classification and assessment tool with graphical user interface (MELanGe) was developed, which can be used for land use mapping and biophysical parameter derivation.
Keywords: Crop classification; data mining; biophysical parameter; data fusion; R-programming
1 Introduction
In recent years, excellent results were achieved in the field of agricultural monitoring using remote sensing information. Numerous projects, publications and contributions to international conferences demonstrate a projection-oriented development. Agricultural monitoring is essential for global issues, which can be reflected by the terms of food security and ensuring ecosystem services. European and international initiatives aim to develop data and information services that allow long-term monitoring of agricultural production or early detection of seasonal negative developments such as droughts. How- ever, current services in the agricultural sector like Copernicus, GEOSS, or GeoGLAM aiming more on regional and global than on local services. High-resolution ( 30 m) systems are still significantly under-represented in it. The derivation of high resolution multi-frequent maps of biophysical parameters (leaf area index, fraction of absorbed photosynthetically active radiation, biomass, etc.) for agricultural monitoring is of inter- est in this context. The University of Wuerzburg has participated in this development by working on three ongoing projects named PhenoS, Techs4Times, and GLAM.DE cover- ing different thematic topics. Scientific core objective of GLAM.DE is to develop inno- vative method of agricultural monitoring based on the high-resolution optical and SAR (Synthetic Aperture Radar) data. In particular, the synergetic effect of the two different data sources for the derivation of biomass and soil organic matter is investigated.
1 Universität Würzburg, Oswald Külpe Weg 86, 97074 Würzburg, patrick.knoefel@uni-wuerzburg.de
2 Deutsches Zentrum für Luft- und Raumfahrt (DLR), 17235 Neustrelitz, erik.borg@dlr.de
78 Patrick Knöfel et al.
Techs4Times is focusing on the generation of time series of biophysical parameters by using synthetic remote sensing information with high spatial and temporal resolution.
PhenoS aims at the development of algorithms and models for operational detection of phenological optimal time windows for cost and computational efficient, improved land use classifications. In this context an object based classification and assessment tool called MELanGe (“Multi-functional tool for the Evaluation of Land use classification and Geometric accuracy”) was developed. One particular focus is set on the separation of cereal crops with high spectral and phenological similarities. Previous studies demon- strated that the selection of appropriate temporal windows in which satellite data should be present can assure classification accuracies [LKC15, Cc14]. So far these studies were mainly applied to the classification of major crops. The paper focuses on cross-project investigations by using SAR data with the classification algorithm developed for optical data and on accurate separation of spectrally similar (major and minor) crops like wheat, barley, and rye.
2 Study area
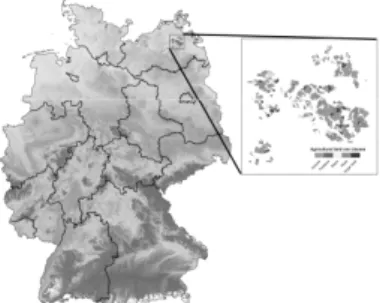
The study area is located near the town Demmin in Mecklenburg-West Pomerania (Mecklenburg-Vorpommern) in Northeast-Germany (Fig. 1). The landscape was formed by glaciers and melting waters during the Weichsel glacial period, approximately 10.000 years ago. The climate is moderate, with an average annual temperature of 8–8.5 °C and an average annual rainfall of 550 mm – 600 mm [Bo09]. The investigated fields are located within the Cal/Val site of the German Aerospace Center (DLR) “DEMMIN”
(Durable Environmental Multidisciplinary Monitoring Information Network) which is part of the German TERrestrial ENvironmental Observatory (TERENO).
Figure 1: Location of the study area DEMMIN.
3 Data
Only a few currently available remote sensing systems provide a sufficient combination of temporal, spatial and spectral resolution for agricultural applications. The main objec-
Land use mapping and vegetation parameter derivation using SAR and optical data 79 tive of the studies is to evaluate the potential of Sentinel-1 (S-1) and Sentinel-2 (S-2) data, solely as well as the synergetic effect. Additional data sources are digitized field objects, land use information, and in-situ measurements of biophysical parameters.
4 Object based land use classification and accuracy assessment
For data mining a multi-temporal Random Forest (RF) classification [Br01] is used. The required zonal information to train the RF classifier originates from the MELanGe tool.
The about 550 input objects were derived by using digitized agricultural fields. For each object and S-2 image 19 vegetation or spectral indices were calculated. This information serves as prediction features for the RF algorithm. In addition, object means for each S-1 scene and parameter (backscatter, coherence, etc.) are added to the feature table. Finally, MELanGe performs a permutation of RF classifications for all possible combinations of the available S-1 and S-2 time steps and features. The interactive part of MELanGe helps to identify relevant time steps for the investigated purpose. It also allows the user to visualize the classification accuracy results as well as the time step combinations with highest classification accuracies. The accuracy assessment of the classification is done by analysing the confusion matrix [CG09] and its derivatives accuracy parameters OA and the class-wise accuracy (F1-measure, [Ri79]. The visualization of the accuracies is based on boxplots, a ranking of the accuracies with respective time step combinations, and the confusion matrix of the optimal time step selection (highest OA or F1). Because of economic constraints it is mostly not feasible to collect ground truth data for an entire dataset. Choosing a certain sampling design is always a trade-off between various design criteria, like probability, sampling design, ease and practicality of implementation, repre- sentative spatial distribution across the area, small standard errors in the accuracy, etc.
[Ol14]. From the various sampling designs typically applied to accuracy assessment [St09] we choose the stratified sampling as the design for the studies. Prior to the defini- tion of the individual strata allocation of an appropriate sampling size is performed. For the derivation of biophysical parameters such as the fraction of absorbed photosynthetic active radiation (FPAR), leaf area index (LAI), chlorophyll content, and biomass cur- rently the development of robust methods is of interest. The importance of different spectral variables was evaluated for different biophysical parameters [Da16].
5 Results and discussion
The initially for the use of Rapid Eye imagery developed MELanGe tool was successful adapted for using S-1 and S-2 data. The assessment of classification accuracy is showing that an increase of the thematic resolution of summary from cereals to sub-cereal classes led to reduced F1s at the higher thematic resolution level, e.g. if comparing the accura- cies of the summery class ‘winter cereals’ (F1: 0.953) with the F1s of ‘winter barley’
(0.763) or ‘winter wheat’ (0.870). The quality assessments using MELanGe showed that the corresponding time step combinations for the highest accuracy differ from class to
80 Patrick Knöfel et al.
class. In addition, the synergetic effect of SAR and optical data for classification is demonstrated successfully in the way that using SAR supplementary to optical data improves the classification accuracy about 4%. Finally, the RF feature importance was analyzed for specific time step combination. The features with highest importance are the RedEdge bands of S-2 and the simple ratio BGI for the optical data sets. The NDVI has less influence on the classification accuracy. In addition, the importance of the RedEdge bands is also found for modelling biophysical parameters.
6 Conclusion
Joined use of SAR and optical remote sensing data can improve the accuracy of land use classification maps and the derivation of biophysical parameter. The importance of the RedEdge bands for land use classification and modelling of biophysical parameters, e.g.
for cereal crops like winter wheat is high (compared to other features). Furthermore, performing a stratified sampling prior to RF classification can lead to more robust classi- fication accuracies for minor cereal classes, like barley.
Literature
[Bo09] Borg, E. et al.: DEMMIN – Teststandort zur Kalibrierung und Validierung von Fernerkundungsmissionen – Geodätisches Fachforum und Festakt, Eigenverlag, 2009.
[Br01] Breiman, L.: Random Forests. Mach. Learn. 45, 1 (October 2001), 5-32, 2001.
[CG09] Congalton, R.G. & Green, K.: Assessing the Accuracy of Remotely Sensed Data Principles and Practices. Second Edition. CRC Press, Boca Raton, USA, 2009.
[Cc14] Conrad, C. et al.: Derivation of temporal windows for accurate crop discrimination in heterogeneous croplands of Uzbekistan using multitemporal RapidEye images.
Computers and Electronics in Agriculture, 103, pp. 63–74, 2014.
[Da16] Dahms, T. et. al.: Important Variables of a RapidEye Time Series for Modelling Biophysical Parameters of Winter Wheat. Journal for Photogrammetry, Remote Sensing and Geoinformation Science, accepted, 2016.
[LKC14] Löw, F., Knöfel, P. & Conrad, C.: Analysis of uncertainty in multi-temporal object- based classification. ISPRS Journal of Photogrammetry and Remote Sensing, 105, pp.
91–106, 2015.
[St09] Stehman, S. V.: Sampling designs for accuracy assessment of land cover. International Journal of Remote Sensing, 30(20), pp. 5243–5272, 2009.
[Ol14] Olofsson, P. et al.: Good practices for estimating area and assessing accuracy of land change. Remote Sensing of Environment, 148, pp. 42–57, 2014.
[Ri79] Van Rijsbergen, C.J.: Information Retrieval, Butterworth-Heinemann, London, 1979.