Decarbonization policies for the building sector in Berlin, Mecklenburg-Vorpommern and Baden-Württemberg
Mapping of selected policies and analysis of their replication potential to other regions in Germany
Kopernikus Projects Enavi
Working Package 4 | Task 7 “Technical-systemic analysis with a focus on energy efficiency in buildings”
Conducted by Alexander Klinge Task lead by
Dr. Aleksandra Novikova
Forschungsinitiative Kopernikus
The Federal Ministry of Education and Research (BMBF) has allocated a total of EUR 400 mil- lion to fund the Kopernikus program until 2025. The objective of the program is to develop innovative technological and economic solutions that can facilitate the transition to a more sustainable energy system. Over a period of 10 years, more than 230 partners from science, business and civil society will conduct research in four subject areas: “New Network Struc- tures”, “Storage of Renewable Energies”, “Reorientation of Industrial Processes” and “System Integration”. Researchers are adopting a holistic approach to these four subprojects in order to examine specific issues relevant to the individuals and institutions that play key roles in energy generation, transmission, supply, and distribution. The program’s 10-year lifespan en- sures that the initiative will include a long-term interchange between theory and practice.
System integration: ENavi
As a participant in the “ENavi” subproject, IKEM is partnering with roughly 90 institutions from the fields of science, business, and law to develop a navigation system that promotes the transition to sustainable energy. Because system integration is vital to the success of compre- hensive energy reforms, the program partners’ integrative approach includes research on heat, gas, and fuel use. IKEM plays a key role in ensuring that the findings from theoretical analyses can be applied in practice. From the outset, field tests are conducted to assess the concrete technical, economic, and legal implications of the energy transition. Test results can then be applied to other regions. Program partners intend to expand the initiative to include research on 50 municipally owned power generation and electricity distribution companies, or Stadtwerke.
This report should be cited as
Klinge, A. 2018. Decarbonization policies for the building sector in Berlin, Mecklenburg- Vorpommern and Baden-Württemberg. Mapping of selected policies and analysis of their rep- lication potential to other regions in Germany. Deliverable of Working Package 4, Task 7. Re- port of the BMF funded project Enavi. IKEM – Institute for Climate Protection, Energy and Mo- bility, July 2018.
IKEM – Institut für Klimaschutz, Energie und Mobilität e.V.
Magazinstraße 15 – 16 | 10179 Berlin +49 (0)30 40 81 87 010 | ikem@info.de
Table of Contents
List of Figures and Tables ... 4
I. Introduction ... 1
1. Background... 1
2. Aim, objectives and tasks ... 2
3. Report structure ... 3
II. Literature Review ... 5
1. Background information ... 5
a) Emissions in the building sector ... 5
b) Barriers to energy efficiency improvements in buildings ... 5
2. Theoretical Background ... 8
a) Policy identification and classifications ... 8
b) Policy mapping ... 9
c) Best practice examples ... 13
d) Transferability of regional policies ... 13
III. Methodology ... 15
1. Policy instrument classification ... 15
2. Policy mapping ... 15
3. Regional case studies: best practice examples and transferability ... 17
IV. Policy Elements ... 19
1. European Policy Environment ... 19
a) Energy Performance of Buildings Directive ... 19
b) Energy Efficiency Directive ... 21
c) European financial incentives ... 21
2. German Policy Environment ... 22
a) Regulatory instruments ... 23
b) Financial instruments ... 26
c) Informative instruments ... 28
3. Regional Policy Environment ... 29
a) Berlin ... 30
b) Mecklenburg-Vorpommern ... 38
c) Baden-Württemberg ... 40
V. Policy mapping ... 47
1. Justification of dimensions ... 47
2. Policy map ... 48
VI. Discussion of results ... 50
a) Similarities and Differences ... 50
b) Multilevel reinforcement and federalism ... 60
c) Best practice and transferability ... 62
VII. Conclusion ... 72
1. Summary ... 72
2. Recommendations ... 74
3. Future research ... 75
VIII. Bibliography ... 77
List of Figures and Tables
Figure 1: Barriers to EE investments ... 7
Figure 2: Policy map developed by (Neuhoff et al., 2011) ... 10
Figure 3: Energy transition roadmap developed by (Pehnt et al., 2012) ... 11
Figure 4: Energy efficiency policy map developed by (Covary and Averesch, 2013) ... 12
Figure 5: Policy map prototype ... 16
Figure 6: Minimum energy performance requirements for new buildings in Germany ... 24
Table 7: German federal state energy laws/concepts ... Fehler! Textmarke nicht definiert. Figure 7: European building stock composition (excluding industrial buildings) ... 47
Figure 8:Energy consumption of the building stock by time classes: ... 54
Figure 9: Institutional actors for climate finance in the building sector ... 56
Figure 10: CO2 emissions from final energy consumption of households, tertiary sector and other consumers (excluding industry and transport) in 1000t (polluter balance) ... 61
Table 1: Impact assessment of the EnEV 2014 in terms of energy savings ... 25
Table 2: KfW Energy-Efficient Renovation and Construction scheme... 27
I. Introduction
1. Background
European regions play an increasingly important role in the implementation of decarboniza- tion measures. The European Cohesion policy developed eleven objectives, from which the sixth is “Preserving and protecting the environment and promoting resource efficiency. For the planning period 2014 till 2020 with the goal to support “smart, sustainable and inclusive growth” (European Commission, 2010) through investments amounting to EUR 351.8 billion (European Commission, 2015). In light of a widely used European multilevel governance ap- proach the empowerment of the regions and a mix of bottom-up, planning and implementation by regional authorities, and top-down, developing framework and allocating funding, strate- gies is essential (European Commission, 2011) to fulfill the greenhouse (GHG) emission goals stated in the Europe 2020 Strategy (European Commission, 2010).
Germany has in comparison to other countries like France or the UK a decentralized govern- ance system. German municipalities are granted local self-governance under the German con- stitution Article 28, § 1-2, if it not interfering with limits set by the German law itself. The six- teen German federal states are working basically as the umbrella organizations of the munici- palities and implement the policies to incentivize energy efficiency (EE) measures in the re- gion.
Due to this, German federal state policies play a big role in the implementation chain of EE measures since they are the last policy maker before the actual executive stage and general with a bigger influence radius then a single municipality. Since Germany is moving to a decen- tralized energy supply system the regions are the most important actors to implement EE measures and prepare the citizens for adoption. From this viewpoint it is not surprising that different federal states and cities have different approaches towards the energy transition and varying measures to achieve their goals. Therefore, it is important to build on regional ad- vantages and respond to particular social and economic barriers to implementation.
EE is one of the most promising and fast to implement measures to achieve lower GHG emis- sions in a limited time frame (Corrales et al., 2014, p. 9). Therefore, a big variety of policy ele- ments is existing to either set incentives or enforce higher EE among all sectors. The building sector generates in most European regions the highest emissions compared to others. There- fore, it is the most important field of action to implement EE policies.
The paper will explore and group regional policies related to building sector decarbonization implemented in Berlin, Baden-Württemberg and Mecklenburg-Vorpommern in a policy map to make them comparable and test the transferability of policy measures to other regions. The regions are selected because they are representative for the different federal policy environ- ment in Germany. Berlin representing the capital and city state. Baden-Württemberg is repre- sentative for the south and has already advanced EE policies implemented. Whereas, Mecklen- burg-Vorpommern is located in the former eastern part of Germany and even though it has a high share of renewable energy sources it has no main climate law in place.
While multiple studies identify and qualify important energy efficiency policies implemented at European or German level, a gap of research is existing on the regional sphere. As (Ringel et al., 2016) describe it, there is a considerable expansion of instruments to foster decarboniza- tion measures in the building sector and the development of evaluation tools at federal level realized. But, “It should be noted that the federal states can and do apply additional instru- ments. However, the impacts of these supplementary instruments are not tracked systemati- cally in the national action plans.” (Ringel et al., 2016, p. 1296)
Simultaneous, many decarbonization approaches stress a bottom up implementation strategy and a development in regional policies to empower the execution stage. This generates an im- portance for a comparison of different policies applied at regional level and an evaluation of their outcomes to advance actual and future policies in European regions.
Furthermore, the visualization of policies is a perfect tool to establish a learning mechanism for all actors involved in the building sector and encourage an information exchange on all policy stages. Therefore, the present report will rely on visualization to promote further knowledge exchange and get new actors involved. It also serves as an information basis for stakeholder, planning on implementing EE measures in their building stock.
2. Aim, objectives and tasks
To address the gaps mentioned above the aim of this report is to assist the evidence based improvements of GHG mitigation policies in the building sector at regional level by visualizing implemented policies via mapping and facilitate learning mechanisms between different Ger- man regions.
To address this aim, the objectives of the paper are:
• To identify, analyze, classify and visualize the EE policies at regional level in several representative regions in Germany
• To highlight the interconnection of policy elements by pointing out similarities in im- plementation or goal setting and tracing back source laws and strategies on Ger- man/European level.
• To compare implemented policies among different regions in a descriptive policy map, identify differences and test their transferability to other regions
To realize the objectives above, the report tasks are:
• Conduct a literature review to:
o Detect the emission volume of the building sector and distinguish exiting barri- ers to EE policy implementation
o Classify the approaches detected in existing literature
o Combine reviewed studies and their results to establish consistent approach for the report goals
o Develop the report methodology based on the beforehand conducted analysis
• Identify relevant policies at the European, German and regional level for the selected federal states
• Classify and compare the allocated policies using a policy map approach developed in the methodology and based on reviewed mapping schemes
• Draw conclusions on lessons learned by comparing similarities and differences of these policies
• Expand conclusions in regional case studies to develop best practice examples
• Discuss in how far the best practice examples are replicable to other regions 3. Report structure
The report is structured in 8 chapters. After the justification of the importance and contribu- tion of the research and stating its aim, goal, objectives, and task in Chapter 1.
Chapter 2 reviews studies about the current state of emissions from the building sector and the barriers associated with its decarbonization. Then it describes the present state of re- search literature concerning policy identification and classification, European multilevel gov- ernance and policy mapping. In particular, the literature focusing on decarb policies for the building sector will be reviewed, if available.
Chapter 3 details the methodology of the present research based on the review of methods conducted in the previous chapter to identify, test, compare and map policies.
Chapter 4 summarizes applied policies on European, German and regional level while also attempting to classify them under the beforehand established categories using the methodolo- gy above.
Chapter 5 will condense the conducted research in the previous chapters to one policy map using the combination of mapping approaches developed beforehand.
Chapter 6 discusses the findings from the previous sections to narrow down the content to answer the research question. Moreover, the best practice examples through in depth case studies of the selected regions will be developed and tested in terms of the transferability to the other regions.
Chapter 7 will summarize the results and give recommendations for further policy develop- ment and research
II. Literature Review
1. Background information
a) Emissions in the building sector
Direct or both indirect and direct GHG emissions associated by the building sector in Germany steadily increased during which years?? and peaked in 2013 at 9.5 gigatons CO2-eq. from there a reduction to 9.0 Gt in 2016 was realized. While the emissions generated by the building stock decreased due to new energy production policies, the energy consumption of the building stock experienced a steady growing development since 2010. Also due to an increasing floor area in the same time period energy consumption rose from 119 EJ in 2010 to 124EJ in 2016.
(IEA, 2017, p. 78)
In Germany a different path of development in building relevant CO2 emissions and energy consumption can be observed. With a peak of 3.62 EJ in 2010 the overall trend was a declining energy consumption by 11% in the building sector to 3.07 EJ in 2015. Recognized by the statis- tic are all residential and commercial buildings and hereby the spheres of heating, hot water, cooling. And in the case of residential buildings also the installed lightning infrastructure. The energy used in all spheres was generated to 87.2% from fuel and 12.8% from electricity. The development of building relevant CO2 emissions was similar to the energy consumption. While the peak with 255 Mt CO2 emissions was in 2010, the overall development was a decline about 18% from 2008 to 2015. The emissions declined from 254 Mt in 2008 to 208 Mt in 2015 and the lowest realized emissions were in 2014 with 205 Mt. Important to note is the fact that CO2 emissions in the building sector are calculated in form of the polluter balance. Hereby, all emissions generated by the operation of the building are attributed to the CO2 balance sheet.
In contrast, the direct emission balance is calculated with the source principal. In the case of the building sector this would mean just the emissions generated by the actual heating of the building and electricity needed for lightning and ignoring the emissions generated by the pro- duction of distance heating systems or thermal pumps. Since energy efficiency measures are most often tackling the polluter this is the balance of choice (BMWi, 2017, p. 35).
b) Barriers to energy efficiency improvements in buildings
In 2010 the GHG emissions of the building sector amounted to 19% of the energy related total and accounted for 32% of the global final energy use. Therefore, the building sector represents
a big challenge for future GHG reductions and a way into a low carbon future. Even though improving EE standards in buildings is a widely recognized, promising environmental strategy there are nevertheless barriers to implementation. But the approached towards higher EE in the building sector varies widely from country developing to developed countries. While the biggest challenge in developing countries is to offer a sufficient energy supply for energy ser- vice in new building types, in developed countries the energy demand by existing buildings is highly inefficient and energy use is uneconomical. The paper will concentrate on the European building sector due to the high saving potential through energy efficiency measures. To under- stand the slow development of energy saving in buildings it is important to point out the barri- ers existing in the building sector towards increased energy efficiency. (Brown et al., 2007) produced a major list of barriers hindering the uptake of cost-effective measures towards in- creased energy efficiency.
Hereby, the strongest discovered barriers are institutional. This means that the decision- making process and the environment are highly complex and fragmentated. The resulting clash of interests between investors, tenants, owners, architects, energy service providers and all further market players slows down the process of widely deployed GHG mitigation technol- ogies and further research in that area.
Distorted information about existing cost-effective technologies is a further problem. The in- formation needed to evaluate measures important for a specific actor is hard to obtain or in- complete. Since energy use in most cases is calculated as a whole and not broken down into the different cost units, benefits from new implemented technologies is quite difficult to ap- propriate to singe their costs. Here again the fragmentated market structure comes into play, since an information obtained by one actor might not be interesting for him but for another player on a different stage who has no possibility to access that information and vice versa.
Moreover, the high upfront costs to realize energy efficiency improvements in buildings are a key problem. While many households and building owners see the benefits of efficient tech- nologies the sensibility to the acquiring costs is way higher then benefits obtained over the life cycle from the purchased technology.
Besides the high upfront costs new technologies also inherit the risk of low performance due to different circumstances. The cost effectiveness of energy efficient equipment is highly situa- tion dependent and can be difficult to predict.
Furthermore, the existing split incentives in advanced building energy performance is an of- ten-cited barrier to implementation. While the building owner or constructors bear the costs for the replacement or installation of energy use improvements the tenants and apartment owners are the ones benefitting from them. Since 90% of all households in multifamily build- ings are renters this is a major obstacle to overcome and the reason why most landlords do nor invest into energy efficient retrofits and construction parts.
In the case of low income households and small businesses the uncertainty about future ener- gy prices and policies combined with a more difficult access to the financial market hinder investments into energy efficiency.
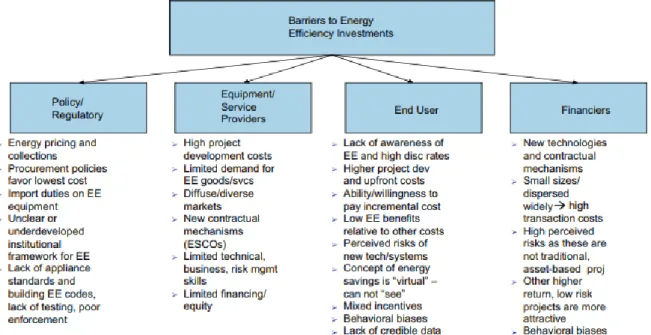
Besides the mentioned economic barriers there are also deeply rooted social barriers. The main obstacle is the lack of information the average society can obtain. While the scientific discourse incorporated many measures to boost the topic of energy efficiency in the building sector many energy consumers have nearly no knowledge about existing technologies or their environmental impact. This leads to a wasteful energy consumption behavior, where new technologies are ineffective if they are not combined with an educational approach (Allouhi et al., 2015). A comprehensive list of discovered barriers to EE improvements is shown in Figure 1.
Figure 1: Barriers to EE investments
Source: (Sarkar and Singh, 2010, p. 5562)
2. Theoretical Background
a) Policy identification and classifications
Various attempts have been conducted to classify different policies under categories and in- strument groupings. One was made by (Koeppel and Ürge-Vorsatz, 2007) as a background research for the IPCC IV AR in their work: "Assessment of policy instruments for reducing GHG emissions from buildings”, where they developed twenty worldwide used key policy instru- ments for GHG emission reduction in buildings and classified them under four categories.
Namely, control and regulatory instruments; economic and market-based instruments; fiscal instruments and incentives; as well as support, information and voluntary actions.
The other major piece of research is summarized in the MURE database coordinated by the French Environment and Energy Management Agency (ADEME) together with 37 partners from 31 countries (MURE, 2018h). The database condenses energy policies for all European countries in one database. In the field of EE in the building sector they developed seven policy types:
• Legislative/Normative,
• Legislative/Informative,
• Financial,
• Fiscal/Tariffs,
• Information/Education/Training,
• Co-operative Measures,
• Cross-cutting with sector-specific characteristics
(Girod et al., 2017, p. 229) condense these seven policy types to four categories in, namely:
Standards, monetary incentives, information, voluntary agreements and others, to conduct their research about the innovation potential of different EE policies in European countries There is various literature existing concerning the classification of policies, so the work for the MUSE database and the background research for the IPCC IV AR were reviewed as the most comprehensive ones worldwide. In conclusion, there are multiple ways to establish a con- sistent classification approach. It depends on the research question as well as the policy envi- ronment focused on. What is clear is a basic split off between market based and command and control instruments. From there more subcategories are possible, depending on the specific research focus and the policy environment. The developed methodology for the present report will be presented in the following chapter. (Koeppel and Ürge-Vorsatz, 2007).
b) Policy mapping
The mapping of polices in the building sector is used by this research to visualize complex rela- tions between laws, policies and strategies to make an abstract concept easier to understand and manageable. In fact, mapping approaches in the building sector are often used to enhance consumer responsibility about their energy consumption by visualizing collected consumer data. While this consumption approach is resulting in geographical energy use maps, the idea can be also taken to show relations and effects of policy instruments (Reul and Michaels, 2012). To give an overview, this section will review different approaches towards policy map- ping established in selected research papers.
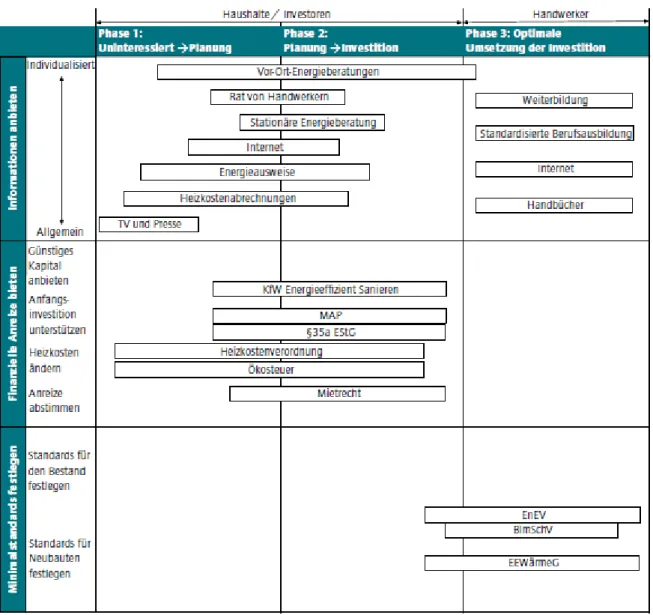
(Neuhoff et al., 2011) for example summarized Instruments and programs for a reduction of energy used for heating in a map, combining three phases of individual adaption and three categories of political instruments. On the vertical axis they used the three instrument classifi- cations: establishing minimal standards, set financial incentives and offer information about optimizing energy use for heating. The horizontal axis offers an overview of the different adop- tion phases separated into crucial changing points: From disinterest to planning, from plan- ning to investment and at least the execution of the investment. The specific instruments, for example subsidy programs for energy efficiency updates, are grouped to one of the categories and spanned over the phases where they are important. The map is illustrated in Figure 2.
Figure 2: Policy map developed by (Neuhoff et al., 2011)
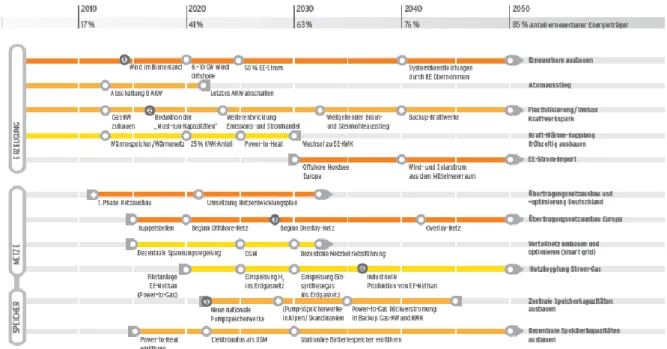
Whereas, (Pehnt et al., 2012) developed a comprehensive roadmap of the German energy tran- sition over time and for different fields of action. They made a single map for every field of action, e.g. energy production, and split the vertical side into the different affected sectors.
Over the horizontal side they span a time series from 2010 to 2050. In different colored ar- rows the essential steps towards the central goals of the energy transition strategy are visual- ized and result in a map resembling a metro timetable.
Figure 3: Energy transition roadmap developed by (Pehnt et al., 2012)
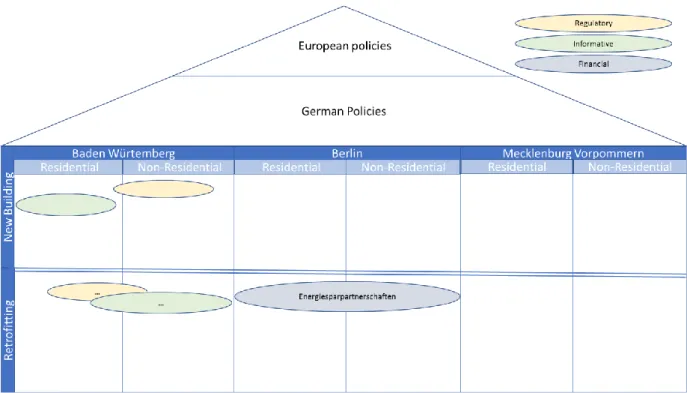
Furthermore, (Covary and Averesch, 2013) developed a policy map for the South African legal environment. They used the shape of a pyramid to visualize the what or hierarchy of energy efficiency laws, directives and policies and separated it vertically into two spheres of origin, the Department of Energy and other decision-making bodies. The fundament of the pyramid is a square block summarizing the achievements generated by the implemented policies and regulations as well as existing gaps and overlaps.
Figure 4: Energy efficiency policy map developed by (Covary and Averesch, 2013)
Overall, the mentioned reports, even though they are extremely different in content and map- ping approach, follow the same objective. The goal is to visualize a complex interrelation of policies by condensing them into one diagram and make them easy to understand through different graphical strategies. Thus, the findings of the studies get easier to perceive for every interested party, regardless their background.
c) Best practice examples
The in beforehand developed policy classification will be used, in combination with further indicators, to identify best practice policies. Best practice in the political sphere could be defined as a policy instrument generating the best outcomes compared to other similar implemented policies (Bergek and Norrman, 2008, p. 6). Therefore, it is the chosen method in the present report to condense findings into real examples and give recommendations for implementation.
(Mosselman et al., 2004) conducted an evaluation study about state aid and defined evaluation as: “the systematic investigation of the effectiveness of (economic) intervention whereby the per- formance of support measures is judged against pre-specified standards or criteria” (Mosselman
et al., 2004, p. 23). In conclusion an evaluation of outcomes of a political intervention can also
be conducted by measuring its effectiveness and the performance. The effectiveness can be derived from the policy comparison and the performance refers to the realization of the in- tended goal setting during the introduction of the political intervention.
d) Transferability of regional policies
(Williams and Dzhekova, 2014) conducted a comprehensive research about the transferability of policy elements. Hereby, they detected two main spheres of importance, namely the ap- plicability (feasibility) in the receiver country and the general transferability (generalizability) of the policy element. They based their results on the study about health care policy transfer by (Buffett et al., 2007), who developed main attributes for the two spheres:
1. Attributes for Transferability: magnitude of issues in local setting, magnitude of reach or coverage, cost-effectiveness, target group characteristics
2. Attributes for Applicability: political climate, political barriers, social acceptance, local- ly tailored intervention, available essential resources and identified organization(s) to provide intervention; organizational expertise; and capacity
The research project TRANSPOSE, funded by the German ministry of research and education (BmBF), is focusing on the transfer of political instruments for energy savings in private
households. Within the Project, working package 7 is analyzing the transferability of policy instruments, implemented to encourage private households to save energy, from other Euro- pean countries to Germany. In two working paper for the project (Bürger, 2011) and (Tews, 2011) tested the transferability of two policy elements, an electricity saving quota and electric- ity efficiency tariffs for consumers, from European countries, where they are implemented, to Germany, where an employment of these instruments would be favored.
Both studies conclude that there is a neither the political nor the legislative framework in Germany to implement one of the both policies at the moment. Furthermore, they develop fields of action in the German policy environment to make a transfer of policies possible. Bür- ger (2011) draws these conclusions from comparing Germany with the example countries in the light of six, for the implementation relevant, context factors, namely: number of obliged stakeholders, distribution of size between obliged enterprises, competitor structure, institu- tional framework, degree of additionality and depth of monitoring.
Tews (2011) is using a similar approach without a transferable category set but a rather spe- cific mix of dimensions applying in the examined policy case. Overall, both transfer test ap- proaches follow the paradigm of finding crucial dimensions for successful implementation and then test if these are also given in the policy environment the instrument should be transfera- ble to.
III. Methodology
1. Policy instrument classification
At first, the selected regions, Berlin, Baden-Württemberg and Mecklenburg-Vorpommern, will be analyzed concerning EE-related policies implemented to decarbonize the building sector.
These policies will then be classified and categorized into sub-sectors where they mostly ap- ply. The results will then be summarized in a policy map.
To archive this target, an in-depth literature review was chosen to start with. Secondary litera- ture about policy mapping in different policy environments will be considered and will be ana- lyzed to establish a consistent approach for the categorization of the different dimensions in the policy map.
The selected Instrument classification is based on the reviewed studies in section two. By comparing the different approaches to each other and considering the building sector as field of action for decarbonization measures, a condensed classification method will be established.
The policy categories of regulatory, informative and financial tools were derived for the pre- sent report from the conducted studies.
To assess regional policies and group them into categories, the review will be conducted based on a mix of online sources, state environment agency websites and published reports by gov- ernments or other public and semi-private sources.
2. Policy mapping
A mix of the above reviewed mapping approaches will serve as the foundation to establish a policy map suitable for the policy environment applied to decarbonize the building sector.
After the collection of important data and the detailed review of regional policy elements the in beforehand classified policy instruments will be grouped after sectoral importance. Follow- ing the idea of (Pehnt et al., 2012) the policy instruments will be grouped to the sectors where they apply, namely residential and non-residential buildings.
Furthermore, the map will be divided into measures promoting the retrofitting of existing buildings or the construction of new buildings. Thus, applied policies most often focus rather on one of the two categories of energy efficiency updates. Through the separation the map will be more lucid and comparable.
After the grouping, the differences of strategies and applied policy instruments will be visual- ized and collected in a table. The method of presenting the results in the table is similar to (Covary and Averesch, 2013), but instead of a pyramid used by these authors, a house shaped diagram will be established to show the hierarchy of policies. In this case, the European poli- cies on top and the German policy landscape underneath will build the “roof”, while the “body”
of the house will be split between the federal states. These will be divided vertically into the residential and commercial building sector on the x-axis and between retrofitting or new building measures on the y-axis.
With different colors the categorization of policy elements should be highlighted and by this lead to a comparable policy map of the different federal states. So, the horizontal axes will build the split off between residential and non-residential buildings.
The policy instruments will be visualized with colored ellipses stretched out over the sectors where they apply, comparable with the mapping approach of (Neuhoff et al., 2011) where the instruments were stretched out over different phases of adoption. The different colors will then show the different classifications of policy instruments, so financial, regulatory or in- formative. Therefore, the policy map will summarize the important strategies and measures for EE in the building sector for commercial and residential buildings as well as the differences to the other regions and can help to give future recommendations for advanced EE policies in the building sector at regional level. The prototype or sample is presented in Figure 55
Figure 5: Policy map prototype
3. Regional case studies: best practice examples and transferability
As a final step, in-depth case studies for the selected federal states will be developed. Hereby, the effects of the implemented policies and strategies will be stressed and outcomes will be evaluated. Best practice examples will be developed based on the policy evaluation.
Best practice policies provide the evidence of policy achievements by being examined in terms of success factors and quantifiable outcomes. The reviewed literature about best practice de- termination follow the logic of evaluating the effectiveness and the performance of a policy. In this case, the effectiveness can be understood in how easy the policy can be implemented and how efficient is the regulatory framework and the performance can be quantified in how far the policy meets the goals set for it. (Bergek and Norrman, 2008).
The extracted best practice examples of applied policies in the federal states will furthermore be tested in their transferability to other regions. Hereby, a set of political and legal framework dimensions, essential for a successful implementation of decarbonization policies, will be de- rived from the reviewed literature in chapter two. Since the reviewed study by Bürger (2011) was focusing on energy saving policies in different European countries, the developed dimen- sions have to be modified to serve also a regional transferability study. Hereby the developed attributes by (Buffett et al., 2007) will be considered to establish transferability attributes to test regional transferability of applied decarbonization policies in the building sector.
Following Bürger (2011), the by the policy affected stakeholder groups will be examined, which already includes the target group characteristics, as referred to by Buffet et al. (2007).
Based on the attributes, “available essential resources and identified organization(s) to pro- vide intervention; organizational expertise; and capacity”, also the inner state institutional framework will be evaluated in regard of leeway for implementation. To combine the attrib- utes, “magnitude of issues in the local setting and magnitude of the reach or coverage” the composition and noteworthy characteristics of the building stock will be contrasted with the constellation in other states. Also important to evaluate are the funding possibilities available in one policy environment and which can differ strongly from region to region (European Commission, 2011).
Based on the literature review, the preliminary list of indicators to test the transferability of policies applied to decarbonize the building sector includes:
• Similarity of Stakeholder interests.
• Magnitude of issue in regional framework.
• Addressed target group characteristics.
• Degree of additionality.
These are chosen based on the reviewed literature and combining the applicability and the transferability of policy elements This list will be reviewed and finalized during the course of research. The test will be based on a qualitative evaluation of the indicators, which can be used to suggest or oppose further research on how to implement a specific policy element in anoth- er region.
IV. Policy Elements
The chapter will offer a comprehensive overview of applied decarbonization measures in the building sector at different policy levels. Therefore, the following paragraphs will summarize the most important policies implemented on the European and German level. Afterwards en- ergy efficiency policies implemented at regional level will be examined in detail for the Ger- man federal states, Berlin, Mecklenburg-Vorpommern and Baden-Württemberg.
1. European Policy Environment
European buildings contribute to 40% of the energy consumption and are responsible for 36%
of CO2 emissions in the EU. Since new buildings consume three to five liters of oil per square meter and older buildings consume an average of twenty-five liters for heating, incentivizing EE building updates as well as further fostering EE in new buildings is a key challenge for Eu- ropean environmental policies. Moreover, 35% of buildings in the EU are older than 50 years, which makes retrofitting measures a main field of action. The estimates of the European Com- mission conclude that an EE improvement in the building sector would result in a 5% emission reduction. Therefore, the 2010 Energy Performance of Buildings Directive and the 2012 Ener- gy Efficiency Directive were developed to set an European EE framework containing reduction targets and mandatory measures and represent the EU’s main legislation to reduce energy consumption of buildings (European Commission, 2017a). The contents as well as main fund- ing possibilities and financial incentives are summarized in the following paragraphs.
a) Energy Performance of Buildings Directive
At the European level the Energy Performance of Buildings Directive (EPBD) (European Com- mission, 2002) was a major step towards increased energy efficiency in the building sector.
Key aspects of the Directive are minimum standards for energy performance of new buildings and retrofitting measures as well as the introduction of a certification scheme in the residen- tial and non-residential building sector. The directive got renewed by its recast in 2010, which further specifies actions Member States (MS) are obliged to and reinforced the 2002 directive in more detail.
In short, the directive obliges MS to introduce:
1. Building codes setting minimum energy performance requirements for new buildings and retrofitting measures.
2. Actions that all new buildings will be nearly zero energy buildings by the end of 2020.
3. Building energy performance certificates.
4. Inspection schemes for the Heating, Ventilation and Air Conditioning (HVAC) systems.
5. National financial incentives to foster EE in buildings (European Commission, 2017a).
The obligations in the directive follow the logic of minimum standards, leaving the leeway to implement stricter regulations at national level (EPBD Recast, 2010, Article 1 (3)). Further- more, the minimum standards set up in the directive are only obligatory if they are economi- cally cost effective over the implementation period in the MS (EPBD Recast, 2010, Article 4 (1)). The minimum standards are calculated with a universal established method and imple- mented at national level. Therefore, they are part of the national reports on energy perfor- mance requirements and are updated every five years (European Commission, 2017a).
While the minimum standards for building codes are country dependent, the obligation for all new buildings being nearly zero-energy buildings by the end of 2020 is universal. Public owned buildings should be updated even until the 31.12.2018. Compared to national imple- mented minimum standards this is stated as a clear goal with an implementation deadline (EPBD Recast, 2010). Moreover, detailed national energy efficiency action plans (NEEAP) on how to reach this goal have to be submitted to the Commission in a three-year interval, con- taining comprehensive financial, regulatory and informative actions.
The introduction of energy efficiency certificates for buildings is mandatory for all MS. They must contain the national minimum standards set by the building codes to establish a compar- ative information mechanism for flat owners or tenants about the energy performance of their buildings. This applies for new buildings as well as after retrofitting measures. While they also contain proposals for actions to enhance the EE in the related building, the implementation of these actions is not mandatory (EPBD Recast, 2010, Article 11,12)
After the same logic as the building certificates also a detailed inspection of the HAVC system in buildings is mandatory after the EPBD. While it is obligatory to get the efficiency factor and further aspects of the HAVC system checked by independent professionals in a regular time interval, the frequency of the inspections can be defined at national level and is further re- stricted by the cost effectiveness. (EPBD Recast, 2010, Article 14 ff.) The outcoming update recommendations are not backed up by penalties for non-compliance and therefore a pure informative law as the beforehand described certificate scheme.
Complementary to the soft regulatory and informative policy instruments, the directive also calls for the development of appropriate financial instruments to incentivize EE updates in the
building sector. Therefore, MS have to develop an inventory of all applied and planned finan- cial incentives at national level and submit it to the Commission every three years as updated list. The Commission will then test the applied instruments concerning their adequacy, effec- tiveness and coordination (EPBD Recast, 2010, Article 10)
In general, the EPBD builds rather a soft law framework, since sanctions are applied at nation- al level and defined by the MS themselves. The directive states that the sanction must be “ef- fective, proportionate and deterrent” (EPBD Recast, 2010, Article 27), which leaves a big in- terpretation and implementation leeway for the MS. This is also apparent through the big vari- ety of energy efficiency laws on national basis in the EU.
b) Energy Efficiency Directive
The 2012 Energy Efficiency Directive builds another key law for EE improvements in the Eu- ropean building sector. The directive is building rather on a strategic framework for EE im- provements instead on clear achievement goals. In line with that, MS are obliged by the di- rective to formulate clear EE goals in terms of primary energy as well as energy end use sav- ings until 2020. These have to be explained by available data and must be in accordance to the overall EU 2020 energy saving goal of a primary energy consumption of 1 474 Mio. t oil equivalent (Energy Efficiency Directive, 2012, Article 3).
Moreover, MS are obliged to develop a strategy to incentivize retrofitting measures for EE up- dates on existing buildings. Through an overview of the national building stock for every MS and a determination of cost effective retrofitting concepts the foundation for effective strate- gies and measures incentivizing EE building updates should be established. This strategy was first summitted by all MS on the 30. April 2014 and must be updated in a three-year period since then. (Energy Efficiency Directive, 2012, Article 4)
In the further Articles the directive refers mainly to the EPBD in concreate goal setting and thereby builds the strategic framework for the implementation of it. It also further summarizes EE measures and strategies in other sectors and is the main piece of European legislation in the EE field. These sector specific strategies are then further specified in other directives, such as the EPBD.
c) European financial incentives
Over the past years an increase in public funding at European level for energy efficiency measures was realizable. But following estimates of the European Commission additional EUR 177 billion a year from 2021 to 20130 are needed to achieve the 2030 energy and climate ob-
jectives. Therefore, the EU is further allocating funds and grants to support energy efficacy updates in the residential and non-residential building sector (European Commission, 2017b).
Numerous funding possibilities are existing at the European level as increasing public and pri- vate investments into sustainable energy projects is a key priority. EE projects can be funded under the Cohesion Fund, the European Regional Development Fund, as part of the European Structural and Investment Funds (ESIF) or by The European Investment Bank (EIB).
As an addition to the ESIF and in cooperation with the EIB the Smart Finance for Smart Build- ings Initiative (SFSB) was launched in 2016 to unlock additional EUR 10 billion of public and private funding. The goal setting is to achieve further EE projects through financial intermedi- aries and investment platforms. Furthermore, the fund aims at a higher effectivity of public funding and the development of further energy financing models, such as energy performance contracting. Also the assistance in the project development from European side should be rein- forced and improved (European Commission, 2016).
There are multiple options to allocate funding for EE improvement project at European level.
The structure of funding is dependent on the exact EE update which should be undertaken, but the most important funding options are named above. The SFSB can be seen as the most recent development in the EE for buildings funding at European level and is therefore explained in more detail.
2. German Policy Environment
Germany is ranked as the eighth largest emitter in terms of energy use of the world and the biggest European energy consumer in 2012. Simultaneous Germany is the fourth biggest econ- omy worldwide and in its energy demand completely dependent on imports due to low fossil fuel reserves. Tis gave the pre- conditions for the pole position of German EE policies in an international comparison. The circumstances of 97% oil and 87% gas imports of demanded energy gave rise to the importance of the development of RES and the ambitious EE goals.
Thus, EE improvements generate higher energy security with a limited production from RES and should lead in the long term to further energy independency of Germany (Nejat et al., 2015, p. 853)
The political environment in Germany is also under the leading political programs in terms of strict EE measures in the building sector. Due to the strict subsidiary system implemented in Germany a steady tightening of measures is taking place. At state level the implemented politi- cal instruments represent the consensus of all federal states and the obliged policy implemen-
tation resulting from European directives. If a federal state implements instruments exceeding the standards agreed at state level and which then prove to have positive impacts the federal state can try to make the measure mandatory at state level for all other states.
Which additional measures are implemented at federal state level will be summarized in the next section. In the following the decarbonization policies applied in the building sector of Germany will be explained. The policies will be categorized into regulatory, financial and in- formative instruments and will be discussed by their impact in terms of energy savings.
a) Regulatory instruments
The mayor regulatory policy instrument in Germany to decarbonize the building sector is the building code. Building codes got established in Germany at state level in the late 1970s. In the beginning of 1977 the codes were introduced to regulate the use of building components in new buildings. Over the past 40 years the codes got further developed to establish a holistic approach towards higher EE in the building sector. Minimum requirements were tightened in existing dimensions and further requirements for new buildings as well as retrofitting measures were added over time.
Requirements set by the building codes are covering the following energy uses and functions:
• Heating
• Cooling
• Dehumidification
• Ventilation
• Airtightness
• Thermal bridging
• Hot water
• Technical installations
• Lighting
• Design, position & orientation of building
• Passive cooling
• Renewable Energy (solar, PV, others):
Requirement of heat supply based on renewable energy 15 ~ 50% depending on the type of renewable energy and building. (GBPN, 2017)
Primary energy demand requirements are set by minimum standards dependent on the size and type of building and requirements for different building components are defined by specif-
ic u-values. The requirements are set by the German energy savings ordinance, Energiee- insparverordnung, (EnEV), which is tightening the minimum standards for new buildings and retrofitting over time (ACEEE, 2016). The EnEV 2014 is setting the minimum standards for retrofitting measures while the standards for new buildings got strengthened again in the EnEV 2016. The performance of renovation is not mandatory, but if a landlord decides to ret- rofit the building the measures have to comply with the EnEV 2014 standards
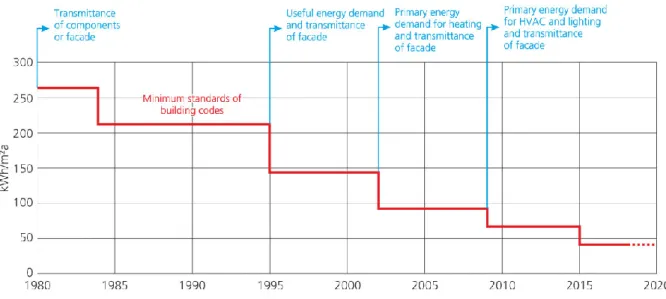
The development of minimum requirements over time for new buildings is summarized in Figure 6:
Figure 6: Minimum energy performance requirements for new buildings in Germany
Source: (ACEEE, 2016, 9-4)
As shown in Figure 6, over time more appliances get allocated to the primary energy demand and simultaneous the minimum standard for new buildings in kilowatt hours per square meter and year get further tightened with every new EnEV release. From the first introduction of the EnEV in 2002, as a recast for the in 1978 established thermal insulation ordinance, Wärmeschutzverordnung, (WSchV), with a minimum requirement of 100 kWh/m²a to the planned goal of 0 kWh/m²a in 2021 (Michelsen and Ritter, 2017, p. 788).
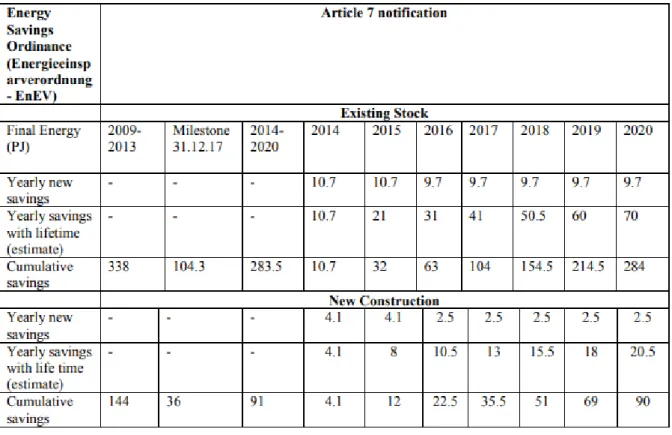
Since building codes are a part of the mandatory actions defined by the EPBD and also part of the NEEAP, the realized savings have to be reported and estimated for coming years. Further- more, Article 7, EED, obliges MS to introduce an EE obligation scheme as well as further policy measures to foster EE updates in all sectors. Moreover, it is mandatory to include an assess- ment of the taken policy action into the NEEAP and report them to the Commission (Energy Efficiency Directive, 2012)
The results of the impact evaluation for building codes in Germany are summarized in Table 1.
The impact evaluation is not split in residential and non-residential sector but gives a good overview of the impact of the building code in Germany over time. The yearly new savings are decreasing in both, the existing and new building stock, over time due to a decreasing saving potential with increasingly applied EE measures and tighter restrictions over time (Ringel et al., 2016, p. 1296).
Table 1: Impact assessment of the EnEV 2014 in terms of energy savings
Source: (MURE, 2018f)
There are some further regulatory instruments established in Germany, but mostly with minor impact. Such as the climate-friendly building and housing strategy, which is the long-term po- litical framework strategy of Germany aiming at focusing the EE approaches of different gov- ernment stages. By that trying to combine strategies for cities, neighborhoods and single build- ings under one development strategies. Measures under the strategy include the aim of a cli- mate neutral building stock until 2050 and the energy efficiency strategy for buildings (ESG), which was decided in 2015 by the federal cabinet.
Since the strategy is aiming at a holistic and inclusive approach it incorporates different spheres of the German urban development approach. Therefore, trying to combine strategies associated with housing in general by developing concrete solutions for problems associated with demographic change, urban and rural development and gentrification. It is rather a soft law for goal setting than a concrete legislation backed with penalties, but offers some legisla- tive backed up policy elements.
For Example, one outcome of the strategy is a training program sponsored by the state for con- struction workers and employees in related areas of the building sector. Through EU funds a vocational training and online training platforms could be established, which is called “BUILD UP Skills – QUALITRAIN” (MURE, 2018f).
In general, the strategy is not offering any new concrete legislation. The aim is simply to have a framework in which different strategies can be combined to a holistic approach which gener- ates a higher impact than single measures going in different directions.
b) Financial instruments
The major funding institution in the field of EE grants is the German development bank, the KfW. There are several programs launched by the KfW to foster EE updates in the residential and non-residential building sector combined with overlapping credit optimization, consulta- tion and control mechanisms. Moreover, there are also further financial initiatives launched outside the KfW funding framework. The financial incentives for EE updates in Germany are a mix of consultation, conditional funding dependent on primary energy savings and stimulating programs. The main instruments are summarized in the following.
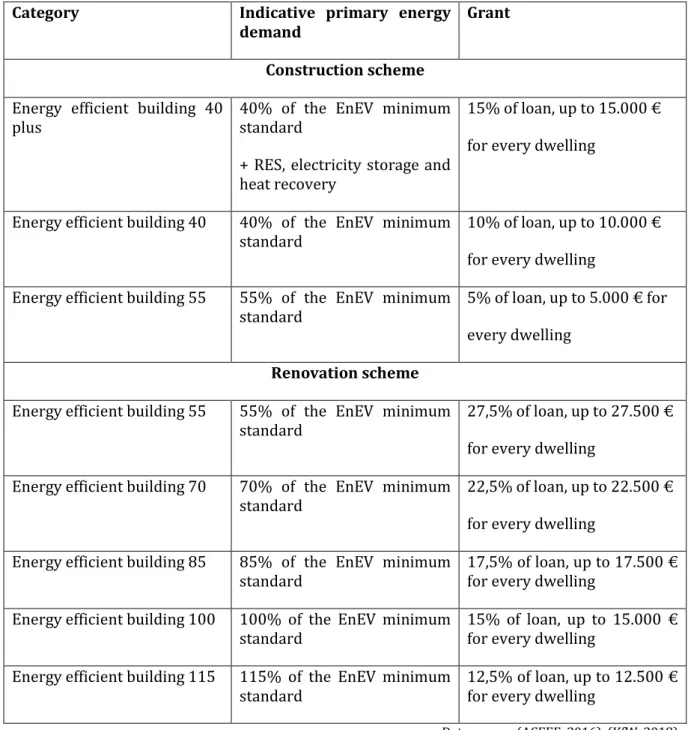
The main pillar of EE funding in Germany is built by the KfW, which is offering soft loans with minimum requirements for eligibility exceeding the standards set in the building codes. The main program, KfW CO2 renovation program, as well as the included extra funding programs, KfW Energy-Efficient Renovation and KfW Energy-Efficient Construction are the essential grants to fulfill the objectives decided at European level. Support for EE updates in the residen- tial and non-residential sector are offered through grants and interest rate discounts (MURE, 2018i). The 2017 NEEAP states that funding was increased to EUR 2 billion per year (NEEAP, 2017, p. 17) and the primary energy savings are estimated to amount to 292 PJ in the period from 2014 until 2020 (NEEAP, 2017, p. 35).
For both, the renovation and the construction scheme a holistic approach combining soft loans and grants was established. The categories, KfW energy-efficient building 115, 100 and mon-
ument (only for renovation), 70, 55, 40 (plus) and low energy building standard were devel- oped for different funding possibilities. The number is representative for the primary energy demand in kWh/m²a. Therefore, a efficiency building 40 is using just 40% of the annual prima- ry energy demanded compared an equivalent house (MURE, 2018d, 2018c). While from 2014 onwards, only buildings from the categories 55 and lower were eligible for the construction scheme for renovations more categories are still available. The funding possibilities as well as the primary energy demand are summarized in Table 2.
Table 2: KfW Energy-Efficient Renovation and Construction scheme
Category Indicative primary energy demand
Grant
Construction scheme Energy efficient building 40
plus 40% of the EnEV minimum
standard
+ RES, electricity storage and heat recovery
15% of loan, up to 15.000 € for every dwelling
Energy efficient building 40 40% of the EnEV minimum
standard 10% of loan, up to 10.000 €
for every dwelling Energy efficient building 55 55% of the EnEV minimum
standard
5% of loan, up to 5.000 € for every dwelling
Renovation scheme Energy efficient building 55 55% of the EnEV minimum
standard 27,5% of loan, up to 27.500 €
for every dwelling Energy efficient building 70 70% of the EnEV minimum
standard
22,5% of loan, up to 22.500 € for every dwelling
Energy efficient building 85 85% of the EnEV minimum
standard 17,5% of loan, up to 17.500 €
for every dwelling Energy efficient building 100 100% of the EnEV minimum
standard
15% of loan, up to 15.000 € for every dwelling
Energy efficient building 115 115% of the EnEV minimum
standard 12,5% of loan, up to 12.500 €
for every dwelling
Data source: (ACEEE, 2016), (KfW, 2018)
The KfW initiative has a major impact on energy savings in Germany. In 2014 around 230000 houses and dwellings got renovated due to a KfW credit and under the efficiency house scheme and further 110000 new constructions where built in the framework. This is account- ing to around 45% of all new buildings and an impact in terms of primary energy savings of 292 PJ in the period 2009 – 2013 (MURE, 2018i; ACEEE, 2016, 9-4). To achieve the ambitious goal that all buildings should be nearly zero energy buildings until the end of 2020, as stated in the EPBD, this already high impact has to increase strongly. But it is noteworthy that already in 2014 nearly half of the finished constructions in Germany were surpassing the minimum building code standard by 55% more energy savings as mandatory.
The grant and loan programs are closely connected to free or supported energy consulting instruments also supported by the KfW. Further partners offering energy efficiency checks and consultation are the Caritas, a social service provider, and the Federal Office for Economic Af- fairs and export Control (BAFA). Caritas is offering free energy efficiency checks especially for low income households, while the BAFA is supporting on-site consultation for EE renovations with grants for 50% of consultancy costs. In 2016 the BAFA program volume amounted to EUR 6.1 million and an estimated saving potential of 1.6 PJ (MURE, 2018a, 2018b).
In total there are sixteen financial measures on energy efficiency and renewable energy in buildings in place at federal level. From which are many directly resulting from European di- rectives and some are additional added in line with the national market structure. The impact, according to the constant evaluation due to the implemented Article 7 notification resulting from the EED, of the financial instruments is considerable high compared to other European countries. But to fulfill the stated goals at European level a steady increase of generated sav- ings is necessary (ACEEE, 2016).
c) Informative instruments
The main information instrument at German level is the obligatory energy efficiency certificate for every building in the residential and non-residential sector. The certificate was introduced 2008 as a result of the EnEV recast in 2007. After the introduction the first applied certificate was not mandatory and had to be specific requested by an interested buyer for a building (Steininger et al., 2017, p. 4). Furthermore, the first introduced certificate design was simply an energy demand or consumption report which lead to unclear results and information due to a high dependency of a user behavior of people living in the building. Therefore, the certificate got renewed with the EnEV 2014 and got into force in 2015. Hereby, the duty of certificates for
every building and the right of tenants to review them before signing a contract got introduced and backed up with a monetary penalty for noncompliance (ACEEE, 2016, 9-4).
Many of the concerns about the information value have been addressed and incorporated into the steadily changing EnEV guidelines. There is still much criticism about the implementation design of the certificate. A general problem is that even though to a high heterogeneity in EE performance for different dwellings in one building, the certificate is issued for the complete building. Additionally, the incorporation of the different criticized shortcomings in every new EnEV recast are in a way valuable, but also lead to incomparable information over time and an increasing variety in the design and data of issued certificates even in the same time period (Steininger et al., 2017, p. 24).
While energy efficiency certificates in general are associated with a reasonable impact on in- creasing EE updates, the German implementation due to its shortcomings has a rather low impact on overall energy savings (MURE, 2018g). Even with a penalty mechanism in influence of the instrument could not be increased because of the information inconsistency within it.
Since the implementation in 2015 Suggestions for improving this information tool are a cen- tralized database with a standardized design and more specific data, such as detailed thermal transmittance values or the efficiency of components (Henger et al., 2017, p. 46).
Additional to the certificate scheme there are further complementary information initiatives launched. Examples for advertisement campaigns are the initiative “Germany makes it Effi- cient” (Deutschland macht´s effizient), which is advertising the introduction of smart metering in private households or the “Initiative Energy Efficiency” (Initiative Energieeffizienz). With these advertisement measures the German state tries to incentivize EE sensible decisions and foster technological research in this field (MURE, 2018e; Henger et al., 2017, p. 26). An impact evaluation for these tools is so far not available.
3. Regional Policy Environment
As shortly discussed above, German federal states have the opportunity to implement own legislations which have to fulfill the standards set at the state level but can consist of further and more ambiguous policies. When a policy at federal state level is proven to be effective the federal state can propose to implement the law at state level. Therefore, the proposed law has to get approved by the two chambers (Bundestag; Bundesrat) and gets implemented at state level after a majority acceptation.
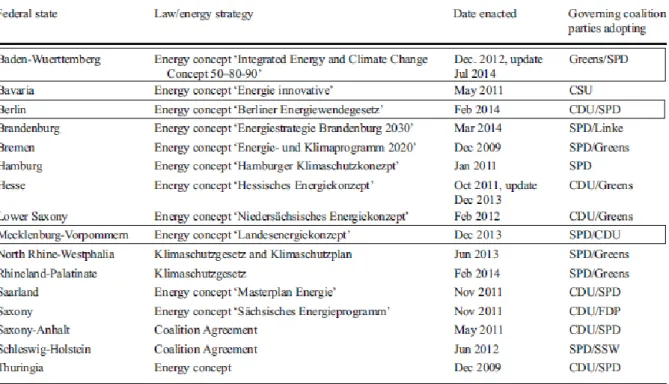
The regional laws implemented at federal state level in Germany and the initiating party are summarized in Table 3. It gets clear that there is a big variety of laws and different federal state policies all fulfilling the standard set at state level but offering additional policies to build on regional advantages. This leads to a situation of a steady increase of environmental targets in line with the state energy transformation strategy as a combination of top-down and bot- tom-up implementation processes (Ringel, 2016, p. 758).
The regional policy programs implemented in Berlin, Baden-Württemberg and Mecklenburg- Vorpommern will be in depth analyzed and summarized in the following. Therefore, also the regional policies will be categorized into regulatory, financial and informative policies to make them comparable. Furthermore, the policies will be analyzed in terms of the sector where they apply (residential, non-residential) to later visualize them in the policy map.
Table 3: German federal state energy laws/concepts
Source: (Ringel, 2016, p. 758)
a) Berlin
The building sector of berlin is responsible for 49% of all GHG emissions in 2012 which equals a 10.3 Mio. t CO2 pollution. The challenges for a decarbonization of the building sector in Ber- lin are various. A main challenge builds the high renting rate and low ownership of condos and
therefore a high tenant landlord barrier for EE updates. Furthermore, a big part of the building sector is listed as historical monuments
To realize an 85% reduction of CO2 emissions until 2050 as stated in the Berlin climate protec- tion goals further development in the political instrument mix is needed. The main spheres where the most potential through further GHG mitigation measures in the building sector can be realized are the renovation rate of old buildings as well as the renovation depth. Further development areas with high potential are the building stock density, subsidy rate and the living area per person. To influence these factors is the main goal of the EE policy instruments applied in Berlin.
The main restrictions for the EE update potentials in Berlin are social compatibility and eco- nomic efficiency. Energetic and EE modernization of flats is causing increased renting prices due to the possibility of the landlord to allocate the cost for EE updates on the net rent of the renovated areas. Consequently, to high modernization rates is specific districts are cause social repression and are leading to special division of social milieus since low income households cannot afford the 11% of appropriated cost from modernization measures additional to the rent (Berlin Senate, 2017, 64 f.).
Due to this different potentials and challenges Berlin is an interesting policy environment to analyze in terms of building sector mitigation policies. Due to the high share of the building sector on the total CO2 emissions and the special challenges resulting from the social structure in the city. In the following the regulatory, financial and informative policy environment will be summarized and explained to get an overview of applied measures and strategies in Berlin to build on regional advantages and potentials and deal with the regional disadvantages and re- strictions.
(1) Regulatory Instruments
Additional to the regulatory framework set at state level the federal state Berlin established, as described above, its own legislative framework for climate protection. The Berlin energy tran- sition law (Berliner Energiewendegesetz (EWG)) was passed and came into force in 2016 and since then builds the main piece of legislation aiming at the decarbonization of all sectors in- cluding the building sector. The main climate targets are similar to the German targets but a little more ambitious in the long-term perspective. While the state of Berlin as well as Germany are aiming at a 40% CO2 until 2020 compared to 1990 Berlin commits to a 60% reduction in 2030 whereas the German target is 55% (Berlin Senate, 2016, §3). To achieve the stated GHG reduction targets Berlin developed the Berlin energy and climate protection program 2030
(Energie- und Klimaschutzprogramm 2030 (BEK 2030)) as a catalogue of measures and strat- egies supplementary to the EWG. The regulatory policy instruments supporting the decarboni- zation of the building sector resulting from them are summarized in the following.
Exemplary function of the public sector
A main regulatory dimension of Berlins EE policy environment is the role model function of public bodies. As at European and German level it is the easiest sector to influence and can serve as an informative example for the private sector to initiate further EE improvements. In line with the German and European goals berlin aims at a climate neutral administration until 2030 with a full action plan how to fulfill that goal.
Supplementary to the measures from the action plan public bodies are obliged to develop a detailed restructuring strategy to reach the EE goals. The plan is not already available since the deadline for the submission of the plans is ending in 2019. Furthermore, a part of the role model function enshrined in the EWG is a mandatory installation of energy management sys- tems in all publicly owned buildings. The gathered data about electricity use in the buildings will be published on the internet to make it available for the public (Berlin Senate, 2016, §6-9).
Climate protection as part of education
Further stated in the EWG is the plan to incorporate climate sensible education topics into the educational system. Thereby, students should get early sensitized about unsustainable behav- iors and the importance of climate mitigation. A main part is the responsible consumption of energy and the explanation of saving potentials through for example EE updates or EE appli- ances. A second layer of this measure is the sponsoring by the Senate for school projects en- hancing EE including student participation (Berlin Senate, 2016, §14)
Climate protection agreements
An important aspect of Berlins EE policy environment is the so-called climate protection agreements with large associations and enterprises of the private economy. Especially associa- tions and enterprises from big interest for climate protection and energy. Therefore, the Berlin Senate is negotiating with strategically important partners, such as energy providers or large cooperative housing associations, contracts which are binding the partners to the climate pro- tection goals enshrined in the EWS. For accepting stricter regulations and developing measures for GHG emission reductions in the enterprise the partners receive a share of the climate protection investments of Berlin. The measures have to aim at the goal of higher EE as well as the use of RES and the resulting savings have to be reported to the responsible senate (Berlin Senate, 2016, §10)