Approach for Managing Service Compositions
Lianne Bodenstaff?1, Andreas Wombacher1, and Manfred Reichert2
1 University of Twente, The Netherlands {l.bodenstaff,a.wombacher}@utwente.nl
2 University of Ulm, Germany manfred.reichert@uni-ulm.de
Abstract. For companies managing complex Web service compositions, chal- lenges arise which go far beyond simple bilateral contract monitoring. For exam- ple, it is not only important to determine whether or not a component (i.e., Web service) in a composition is performing properly, but also to understand what the impact of its performance is on the overall service composition. To tackle this challenge, in previous work we developed MoDe4SLA which allows managing and monitoring dependencies between services in a composition. This paper em- pirically validates MoDe4SLA through an extensive and interactive experiment among 34 participants.
Key words: SLAs, service composition, empirical validation, SLA management
1 Introduction
Regarding the monitoring of Web service (WS) compositions, it is necessary to take composition structure as well as characteristics of services into account. This infor- mation is needed to assess composition performance. This is particularly important when considering the growing complexity of WS compositions. Particularly, providers of composite services struggle to manage these complex constellations. Different ser- vices are provided with different quality levels. Further, services stem from different providers, and have different impact on the composition. To meet Service Level Agree- ments (SLA) with its customers any company faces the challenge of managing its un- derlying services. For each SLA violation the company determines its impact on the composition and decides on how to respond. Generally, complexity of this decision process grows with the number of services being involved in the composition.
The goal of MoDe4SLA [1, 2] is to determine for each service in a composition its impacton the composition performance. The latter is measured by analyzing different metrics (e.g. costs and response time) as used in SLAs. Through analysis of bothde- pendency structureandimpactit becomes possible to monitor composition performance taking dependencies between services into account. The advantage of such analysis is the possibility to explain SLA violations of a service composition through identifying badly performing services the composition depends on.
?This research has been supported by the Dutch Organization for Scientific Research (NWO) under contract number 612.063.409
This paper validates our scientific solution (MoDe4SLA) for the real-life problem of managing complex service compositions through acontrolled, quantitative experi- ment[3, 4]. Experimental validation in Computer Science is recognized as being very important [5, 4]. However, still a minority of research papers actually provides some experimental results [6, 7]. Without validating developed approaches like MoDe4SLA, however, a researcher might steer his research efforts into a fruitless direction [5]. In our evaluation we conduct an experiment with 34 participants. These participants are asked to manage Web service compositions using our approach and to do this without using MoDe4SLA. We gather data on their experiences and analyze them.
This paper evaluatesusefulnessof our MoDe4SLA approach for managers burdened with maintenance of service compositions [8]. We first provide some background infor- mation on MoDe4SLA in Section 2. Related work is discussed in Section 3. We evaluate usefulness by asking experts to manage simulated runs of service compositions using MoDe4SLA (Sections 4 and 5). We conclude with a summary in Section 6.
2 Background & Example scenario
MoDe4SLA [1, 2] intends to supports companies in managing their composite services by identifying and monitoring their dependency on other services requested from exter- nal providers. Our approach pinpoints to services causing SLA violations of the com- position. SLAs describe constraints (e.g., response time and availability) a service has.
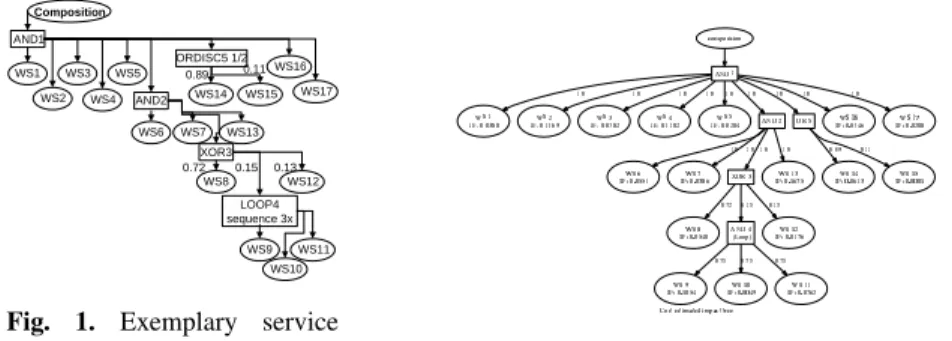
Our abstract example scenario (Fig. 1) depicts a composition where every composition invocation triggers WS 1 - WS 7, WS 13, WS 16, and WS 17. In addition WS 8, WS 12, or theLoop-construct is chosen (XOR-construct where each outgoing edge is annotated with thechance to be chosencompared to its siblings). If theLoopis chosen, WS 9 - WS 11 are invoked in a repeatedsequence(on average 3 times). Further, either WS 14 or WS 15 is invoked (ORDISC-construct with ratio 0.89 : 0.11). Except for services in the Loop sequence, all services are invoked inparallel.
Composition
LOOP4 sequence 3x
WS17 AND1
AND2 ORDISC5 1/2
XOR3 WS16 WS15 WS14
WS13
WS12
WS11 WS10 WS9 WS8 WS7 WS6 WS5 WS4 WS3 WS2 WS1
0.72 0.15 0.13 0.89 0.11
Fig. 1. Exemplary service
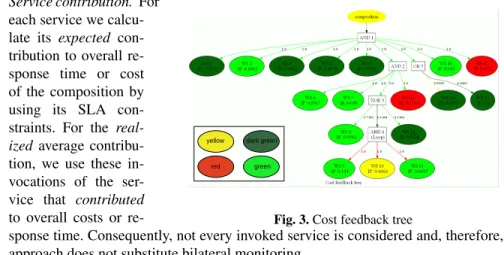
composition Fig. 2.Estimated impact tree for cost
Offering a composite service to customers implies that a company relies on other service providers. SLA constraints might depend on different services, or depend on them in different ways. For example, if a company offers information with fast response time by querying five providers and returning information of the fastest responding one,
a cost constraint is influenced by all five services (invoking means paying), while a response time constraint is only influenced by the fastest responding one. As a conse- quence, MoDe4SLA analyzes dependencies for each constraint separately and repre- sents them inimpact trees. We analyzeexpectedbehavior of services using their SLAs andrealized behavior using logs. Differences between realized and expected behav- ior are presented in afeedback treeto users. MoDe4SLA calculates three values for these trees:contribution factorsdepict the number of times a branch is invoked and contributes to the constraint value.Service contributionsdepict the average constraint value when it contributes, andimpact factorscombine these measures.
Contribution factors. Each branch of a tree is annotated with a value indicating the number of times the branch contributes to the compositionper composition invocation.
Fig. 2 depicts theestimated impact tree for costs based on the composition structure from Fig. 1 and estimations on the number of invocations. For example, each outgoing edge of the XOR-construct has an expected contribution factor. E.g., the composition manager expects WS 8 to contribute 72% of the time to the composition costs.
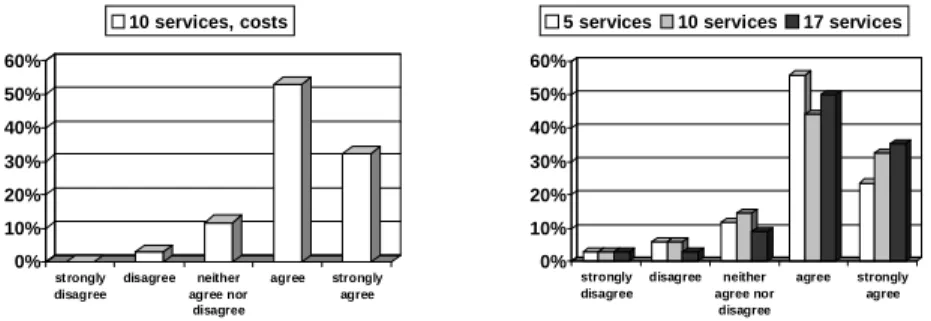
yellow dark green
red green
Fig. 3.Cost feedback tree Service contribution. For
each service we calcu- late its expected con- tribution to overall re- sponse time or cost of the composition by using its SLA con- straints. For the real- ized average contribu- tion, we use these in- vocations of the ser- vice that contributed to overall costs or re-
sponse time. Consequently, not every invoked service is considered and, therefore, our approach does not substitute bilateral monitoring.
Impact factors. Each service is annotated with animpact factor(IF in Fig. 2). This is calculated by multiplying contribution factor (i.e., number of times a service contributes per composition invocation) and average service contribution (i.e., average constraint value of a service, e.g., average response time), divided by the average constraint value (e.g., response time) of the composition. The value indicates the averagecontribution percentage to the compositionconcerning a constraint. For example, in Fig. 2, WS 13 has an expected IF of 0.1675, i.e., it is expected that 16.75% of the composition costs are due to WS 13. Generally, impact factors in one composition add up to 1.
Feedback trees. Our goal is to provide information on composition performance through graphicalfeedback trees. These trees (cf. Fig. 3) indicate differences between design time estimations and realized values monitored in event logs. More particular, the feedback tree showscausesfor SLA violations of a composite service. These differ- ences are depicted bycoloringbranches for contribution factors and services for service
contributions. As discussed, impact factors combine these two measures and show the average impact of each service. Colorredindicates worse performance than expected andgreen indicates proper performance.Yellowindicates the service is not perform- ing perfectly, but still within boundaries set by the company, anddark greenindicates a service runs better than anticipated on. Edges are colored in the same manner. For example, red indicates an edge contributes more often than expected.
Fig. 3 depicts the cost feedback tree of our example scenario. The yellow compo- sition indicates the cost constraint is not met. This is caused by two factors: (1)Per- formance of service WS 13is bad since it violates its SLA (i.e., it is colored red) with an impact factor (IF) of 0.1763, i.e., almost 18% of the overall costs are contributed by this service. (2) Due to thestructure of the composition, services WS 9 - WS 11 are contributing more often than expected (i.e., red incoming edges) which causes elevated costs. Although WS 17 is not functioning properly, its impact factor is too low (i.e., 2%) for causing major composition violations. Furthermore, several services are over- performing (i.e., dark green). If performance problems are solved, these services might positively influence overall costs.
3 Related work
Menasce [9] presents response time analysis of composed services to identify impact of slowed down services. The result is a measure for the overall slow down depending on statistical likelihood of a service not delivering expected response time. As opposed to our approach, Menasce performs analysis at design-time rather than providing a runtime based analysis. A different approach with the same goal is the virtual resource manager proposed by Burchard et al. [10]. It targets a grid environment where a calculation task is distributed among different grid vertices for individual computation jobs. If a grid vertex fails to deliver the promised service level, a domain controller first reschedules the job onto a different vertex within the same domain. If this action fails, the domain controller attempts to query other domain controllers for passing over the computation job. Although the approach covers runtime, it follows a hierarchical autonomic recov- ery mechanism. MoDe4SLA focusses on identifying causes for correction on the level of business operations rather than on autonomous job scheduling. In the COSMA ap- proach Ludwig et al. [11] describe a framework for life cycle management of SLAs in composite services. They recognize the problem of managing dependencies between different SLAs. Furthermore, their COSMAdoc component describes composite spe- cific dependencies but does not explicate what type of dependencies are considered.
The SALMon approach by Oriol et al. [12] aims at monitoring and adapting SOA sys- tems at runtime. Monitoring is done for SLA violations. Further, a decision component performs corrective actions so that SLAs are satisfied. Their approach does not focus on service compositions but on runtime adaptability. As a consequence, they are not concerned with dependencies between different SLAs. Moser et al. [13] describe an approach for automatically replacing services at runtime without causing any down- time for the overall system. The BPEL processes are monitored according to their QoS attributes and replacement of services and partners is offered on various strategies. Al- though their approach has similarities to ours, their goals focus on runtime adaptability,
and not on service compositions and their SLA dependencies. Sahai et al. [14] aim at automated SLAmonitoringby specifying SLAs and not only considering provider side guarantees but focus also on distributed monitoring, taking the client side into account as well. Barbon et al. [15] enable run-time monitoring while separating business logic from monitoring functionality. For each process instance a monitor is created. Unique for this approach is its ability to also monitorclassesof instances, enabling abstraction from an instance level. The smart monitoring approach of Baresi et al. [16] implements the monitor itself as a service. There are three types of monitors available for different aspects of the system. Their approach is developed to monitor specifically contracts with constraints. In [17] Baresi et al. present an approach to dynamically monitor BPEL pro- cesses by adding monitoring rules to the different processes. These rules are executed during runtime. Our approach does not require modifications to the process descriptions what might suit better to some application areas. An interesting approach in this direc- tion is work by Mahbub et al. [18] who considers the whole state of the system in their monitoring approach. They aim at monitoring derivations of system behavior.
Most of the discussed approaches are evaluated by providing a proof-of-concept implementation (e.g., [19, 20]). In addition, some approaches are validated by a perfor- mance study (e.g., [18, 21]). However, to our knowledge, none of the approaches has been empirically validated. This complicates finding a suitable method to compare our approach with. Therefore, we choose to use straightforward bilateral monitoring as a baseline for evaluating MoDe4SLA.
4 Evaluating usefulness: Setup
The design of our evaluation is described more extensively in Bodenstaff et al. [8]. To evaluate usefulness of the results from our MoDe4SLA analysis, we interview experts, asking them to make a statement on how useful they perceive the approach when man- aging compositions. We use the following criterion to evaluate usefulness:
MoDe4SLA is considered as being useful when experts testing it perceive the feed- back given by MoDe4SLA as more useful for managing and maintaining the com- position than when using bilateral monitoring results.
Common management approaches return bilateral monitoring results to users. They do not provide information on the relation between the different services, but merely return individual service performance. For evaluating our MoDe4SLA approach, we extend the implementation of an existing simulator - SENECA [22] - with generating impact models and with an analyzer module (cf. Fig. 4). This simulator randomly gen- erates acomposition structurefor a given number of services. To each created service in the composition a randomly generated SLA is assigned. Theimpact modelsare de- rived based on the composition structure and SLAs. SENECA simulates invocation of the services according to the composition structure. Accordingly, services might violate their SLAs. The simulator gathersruntime dataand generatesfeedback models.
Simulator
Gather runtime data
Generate feedback models Generate
composition
& SLAs
Generate impact models Generator
Run composition
Analyzer
1 2
Fig. 4.Evaluating usefulness For our evaluation
we prepare three com- positions of different complexity. The com- plete set of documents, including the question- naire handed out to experts for evaluation can be found in Bo-
denstaff et al. [23]. The first test case (TC1) consists of five services with three con- structs, the second test case consists of ten services with one OR-split and one discrim- inative join. Finally, the third test case consists of seventeen services connected through five constructs. This case constitutes our example scenario (cf. Fig. 1).
For each composition two documents are prepared. The MoDe4SLA document con- tains feedback models for both response time and costs, while the control document contains performance data for each service resulting from bilateral monitoring, but does not provide information on how they are related [23]. Main goal of our evaluation is to test following hypothesis:
The MoDe4SLA document has a clear benefit over the control document when managing the composition.
We evaluate this hypothesis by conducting a survey considering the following re- search questions (RQ):
RQ1Accuracy of identifying malfunctioning services using MoDe4SLA in compar- ison to the use of bilateral monitoring results,
RQ2Efficiency in identifying malfunctioning services using MoDe4SLA compared to bilateral monitoring results,
RQ3Confidence experts have in their answers when using MoDe4SLA compared to bilateral monitoring results.
RQ4How complex is the MoDe4SLA approach for users?
RQ5Which possible improvements do experts suggest for the MoDe4SLA approach?
For this purpose, we prepare a questionnaire of 49 questions that experts answer be- fore, during and after the experiment. Typically they five-level Likert item (i.e., Strongly disagree, Disagree, Neither agree nor disagree, Agree, Strongly agree) to rate responses.
We start with a trial run on three colleagues to discover problems in examples, test cases, and questionnaire. Although no errors are found, a front sheet depicting graph- ically each composition is added. We conduct six more sessions with 34 participants from several universities and companies. Each session consists of:
1. A presentation explaining the goal of the approach.
2. Discussion of two examples where bilateral monitoring results and MoDe4SLA feedback model results are explained, including an interpretation discussion.
3. The evaluation: First some introductional questionsare answered (Q1-Q7) after which the first test case withbilateral monitoring results is studied and the par- ticipant answers Q8-Q11. Then the MoDe4SLA feedback trees are studied and
Q12-Q18 are answered. These steps are repeated for the second and third case. We conclude with general questions (Q41-Q47).
5 Conclusions from evaluating usefulness
We introduce some demographics after which we discuss answers related to questions from Section 4. We conclude with an analysis of relations between different outliers in questions in Section 5.3. Statistics on all questions can be found in [23].
5.1 Demographics
The group of 34 participants consists of experts in developing and managing services.
11 experts are from industry, of which 9 are also active in academia, and additional 23 experts from academia. 15% of the experts have experience using tools for managing composite services. 15% of the experts have experience developing tools for managing composite services. 60% of the participants have not worked with composite services, while the remaining 40% have experience varying from less than one year to over three years. 9% of the participants consider themselves having a high level of expertise in managing composite services. They are in particular supportive for MoDe4SLA ap- proach and therefore no explicit discussion of this participant group is done. The low number of experts in managing service compositions does not influence the overall re- sult since also experts in services understand the complexity of service compositions and their management although they have not performed the task themselves yet.
Although our participants are familiar with service compositions, on average their expertise in managing them is not high. As advantage this inexperience helps us in de- termining how difficult it is to master MoDe4SLA. As disadvantage, we cannot expect much feedback on possible other approaches for managing service compositions.
5.2 Statistics
We start each test case with a question on how complex the participants feel the com- position is (TC1 with 5 services: Q8, TC2 with 10 services: Q19, TC3 with 17 ser- vices: Q30) (cf. Fig. 5). We assume TC2 is perceived as less complex than TC1 since it contains only one construct: an OR-split with discriminative join while TC1 contains three constructs. We add this question since we assume the more complex the com- position is, the more useful MoDe4SLA will be. Although participants consider the different test cases to be of different complexity, and although participants appreciate using MoDe4SLA even more when considering the complex test case (i.e., TC3), these differences were lower than expected as discussed in the following.
RQ1: Accuracy. We want to know whether participants feel that identifying problematic services can be done more accurately with than without MoDe4SLA. We have two questions giving us an insight on this.
The first question is asked for each test case, and for both response time and costs.
We ask participants whether they perceive identifying the impact each service has on the
0%
10%
20%
30%
40%
50%
60%
70%
80%
strongly disagree
disagree neither agree nor
disagree
agree strongly agree
5 services 10 services 17 services
Fig. 5.The composition is complex.
0%
10%
20%
30%
40%
50%
disagree neither agree nor
disagree
agree strongly agree 10 services, costs
Fig. 6.It is easier to determine the impact of each service with the analysis than without.
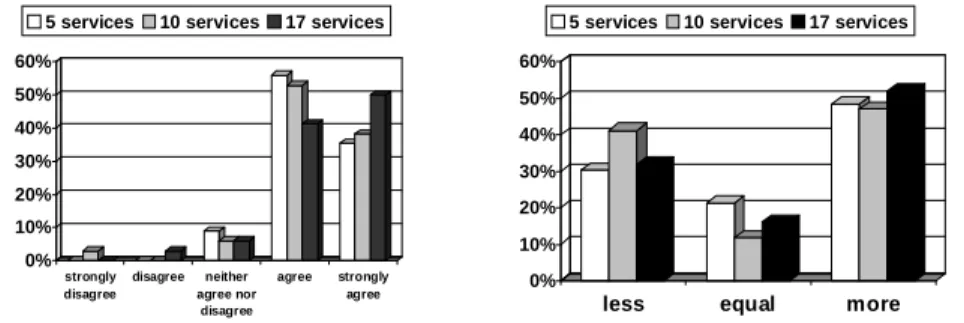
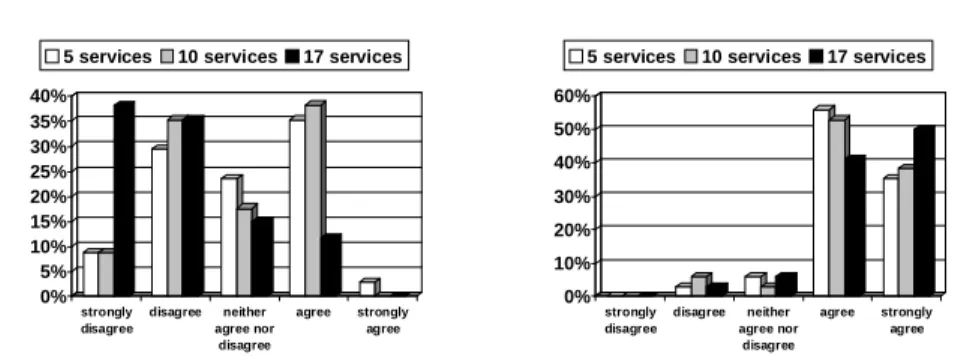
composition, is easier with MoDe4SLA than it is without MoDe4SLA (for TC1: Q15 and Q16, for TC2: Q26 and Q27, for TC3: Q37 and Q38). MoDe4SLA is perceived as being more useful for response time than for costs, and as more useful for TC3 than for TC1 and TC2. The majority perceives the use of MoDe4SLA as very helpful for easier identification of the impact. Fig. 6 depicts the histogram withleastpositive responses for our approach. It still entails over 80% of the participants agreeing or strongly agreeing to the statement.
Second, for each test case we ask participants whether they consider MoDe4SLA being helpful when managing the composition with regard to accurately depicting mal- functioning services (for TC1, TC2, and TC3, and Q18, Q29, and Q40). Fig. 8 depicts results. 75-80% of the participants agree or strongly agree that MoDe4SLA is helpful to accurately depict these services even for the least complex composition.
0%
10%
20%
30%
40%
50%
60%
st rongly disagree
disagree neither agree nor
disagree
agree strongly agree
10 services, costs
Fig. 7.It takes less time to see relations between different services and the composition.
0%
10%
20%
30%
40%
50%
60%
strongly disagree
disagree neither agree nor
disagree
agree strongly agree
5 services 10 services 17 services
Fig. 8. MoDe4SLA is helpful when depicting malfunctioning services.
RQ2: Efficiency. We investigate whether participants consider it as moreefficientwhen using MoDe4SLA for managing service compositions than without. First, for each test case and for both response time and cost we ask participants to respond to the state- ment that it takes less time to see relations between the different services in a compo- sition when using MoDe4SLA. Since MoDe4SLA relies on identifying relations and dependencies between the services, we assume that MoDe4SLA is helpful when try-
ing to identify these relations. Depending on the test case, 85-100% of the participants (strongly) agree with this statement. Fig. 7 depicts the least positive responses.
Second, for each test case we ask participants whether they consider MoDe4SLA being helpful when managing the composition with regard to efficiently depicting mal- functioning services (for TC1, TC2, and TC3, and Q18, Q29, and Q40). Fig. 9 depicts results for these questions. Around 90% of the participants agree or strongly agree that MoDe4SLA is helpful to accurately identify these services.
RQ3: Confidence. To evaluate how confident participants are when making a choice on which services to adapt to get better performance, for each test case we ask three ques- tions. First, we ask how confident they are making a choicebeforeseeing MoDe4SLA models. Second, we ask how confident they are about their original choice when seeing the models. Third, we ask how confident they are making a choice when considering MoDe4SLA models. The aim of the second question is to find out whether partici- pants feel MoDe4SLA giving additional support. If they feel more or less confident, MoDe4SLA apparently gives them additional insights. If they do not change their opin- ion, MoDe4SLA has not given additional insights. The change in confidence (i.e., the second question) is depicted in Fig. 10. For each test case at least 80% of the participants change their confidence level. The confidence level of participants before considering MoDe4SLA is depicted in Fig. 11. Experts have reasonable confidence levels in the first and second test case but no confidence in the third one. In Fig. 12 the confidence level goes up for all test cases after participants studied the MoDe4SLA files. On aver- age participants feel more confident making choices on which services to adapt using MoDe4SLA than without it.
0%
10%
20%
30%
40%
50%
60%
strongly disagree
disagree neither agree nor
disagree
agree strongly agree
5 services 10 services 17 services
Fig. 9.MoDe4SLA is helpful to fast select ser- vices to renegotiate.
0%
10%
20%
30%
40%
50%
60%
less equal more
5 services 10 services 17 services
Fig. 10.How is your confidence in your selec- tion for renegotiation?
We test usefulness of our approach by answering RQ1-RQ3. In addition, we ask participants at the end of the survey to respond to the statement that using MoDe4SLA is helpful when managing composite services (cf. Fig. 13). None of them disagrees or strongly disagrees with this statement. 94% of them agree or strongly agree with it.
RQ4: Complexity. Another important aspect is how difficult MoDe4SLA is to compre- hend. We strive to develop anintuitiveapproach that is easy to understand for users. Of course, the positive evaluation results concerning MoDe4SLA usefulness after a short
0%
5%
10%
15%
20%
25%
30%
35%
40%
strongly disagree
disagree neither agree nor
disagree
agree strongly agree
5 services 10 services 17 services
Fig. 11.I would feel confident in selecting ser- vices for renegotiation.
0%
10%
20%
30%
40%
50%
60%
strongly disagree
disagree neither agree nor
disagree
agree strongly agree
5 services 10 services 17 services
Fig. 12.I feel more confident selecting renegoti- ation services with MoDe4SLA than without.
training period support our claim that its usability is good. However, we also want to know whether participants feel the given explanation of MoDe4SLA was sufficient to use the models (cf. Q42). The presentation takes at most one and a half hour, including discussion and questions. Fig. 14 indicates that over 85% of the participants agree with this statement. A considerable group (around 12%) appreciate more explanation.
Furthermore, in Q45 we ask participants to name weak points of the approach. Here, we find indicators MoDe4SLA is less intuitive for some of the participants. 7 of them (i.e., around 20%) indicate they have problems understanding the values in the model.
With these values, participants sometimes mean impact factors, but usually contribution factors (i.e., branch annotations) turn out to be hard to understand. The magnitude of numbers confused some of the participants. 2 of them (i.e., around 6%) state for them the feedback models are too complex to comprehend. In conclusion, about 75% of the participants have no difficulties understanding values in the feedback models.
RQ5: Possible improvements. We ask participants to state what they feel is most ben- eficial about the feedback models. Participants like the visualization part, especially the coloring. Furthermore, impact factors and analysis itself are beneficial. Also, we ask for possible improvements. The first is a reduction of the many numbers used in the models. As discussed in RQ4, for some participants there is too much information given. In addition, participants feel they are able to choose using colors and impact factors. Therefore, we consider filtering this information when models are presented to users. Second, participants appreciate some interpretation guidelines. For example, “a low impact factor indicates”, “a high ratio means”, and “from the combination of an impact factor and ratio you can derive”. Therefore, we consider extending the presenta- tion with information on these statements. Third, related to the previous improvement, participants appreciate guidelines for decision making. It is beneficial if the models in- dicate which services to consider for change, and why. Currently, models only provide monitoring information without suggestions on how to improve performance. Develop- ing such guidelines is part of our future work.
5.3 Evaluation conclusions
Test cases. Although we introduce three test cases with different complexity levels, MoDe4SLA is already perceived as useful when managing a composition with only
0%
5%
10%
15%
20%
25%
30%
35%
40%
45%
50%
neither agree nor disagree
agree strongly agree
Fig. 13.MoDe4SLA is helpful for managing ser- vice compositions.
0%
10%
20%
30%
40%
50%
60%
70%
disagree neither agree nor disagree
agree strongly agree
Fig. 14.The presentation is sufficient to under- stand MoDe4SLA.
five services. Furthermore, our test case with seventeen services is considered as highly complex. However, real-life compositions are typically much larger. As a consequence, a proper management approach is definitely necessary in those cases. Further, TC2 is perceived as less complex than TC1 although it consists of twice as many services. The three constructs in TC1 make it more complex than TC2 that contains one construct.
Cost versus response time. When browsing through the different diagrams, it is clear that most participants struggle more with response time dependencies than with cost de- pendencies. As a result, MoDe4SLA is especially appreciated in response time models, which is also supported by answers of Q48 where beneficial parts are named. Response time of a branch depends on the interaction between different services: Whether service A contributes, does not only depend on whether it is invoked, and how fast is runs, but also on how fast its neighbor runs. Also for cost the contribution depends on the cost of other services, but this dependency is less strong.
6 Summary and Outlook
This paper presents our evaluation of usefulness of our MoDe4SLA approach. In several interactive sessions we conduct an extensive evaluation where 34 participants answer 49 questions. To support our hypothesis that MoDe4SLA models have a clear benefit over an approach that only supports bilateral monitoring (cf. Section 4), we investigate usefulness of our approach as perceived by experts. All three sub-questions concerning accuracy (RQ1), efficiency (RQ2), and confidence (RQ3) clearly indicate that partici- pants benefit from the MoDe4SLA models. Though there are improvements to be con- sidered, as discussed in RQ5, participants are able to properly understand MoDe4SLA within one and a half hour. These results give us support to continue developing our monitoring approach. So far, we only ask participants for theiropinion. There are no good or bad answers. Of course, we want to know whether the answers our participants give are effectiveas well. In other words, we want to know whether their decisions are better when making them with MoDe4SLA than without. This is considered in our effectiveness evaluation in future research.
References
1. Bodenstaff, L., Wombacher, A., Reichert, M., Jaeger, M.C.: Monitoring dependencies for SLAs: The MoDe4SLA approach. In: Proc. SCC’08. 21–29
2. Bodenstaff, L., Wombacher, A., Reichert, M.U., Jaeger, M.C.: Analyzing impact factors on composite services. In: Proc. SCC’09. 218–226
3. Kitchenham, B.: Evaluating Software Engineering Methods and Tool Part 1: The Evaluation Context and Evaluation Methods. ACM SIGSOFT Software Engineering Notes21(1) (1996) 4. Zelkowitz, M., Wallace, D.: Experimental Models for Validating Computer Technology.
IEEE Computer31(5) (1998) 23–31
5. Tichy, W.: Should Computer Scientists Experiment More? IEEE Computer31(5) (1998) 6. Sjøberg, D., Hannay, J., Hansen, O., Kampenes, V., Karahasanovic, A., Liborg, N., Rekdal,
A.: A Survey of Controlled Experiments in Software Engineering. IEEE Transactions on Software Engineering31(9) (2005) 733–753
7. Tichy, W., Lukowicz, P., Prechelt, L., Heinz, E.: Experimental Evaluation in Computer Sci- ence: A Quantitative Study. Journal of Systems & Software28(1) (1995) 9–18
8. Bodenstaff, L., Wombacher, A., Jaeger, M.C., Reichert, M., Wieringa, R.: Monitoring service compositions in MoDe4SLA: Design of validation. In: Proc. ICEIS’09
9. Menasc´e, D.A.: Response-time analysis of composite Web services. IEEE Internet Comput- ing8(1) (2004) 90–92
10. Burchard, L.O., Hovestadt, M., Kao, O., Keller, A., Linnert, B.: The Virtual Resource Man- ager: An architecture for SLA-aware resource management. In: Proc. on Cluster Comp. and the Grid. (2004) 126–133
11. Ludwig, A., Franczyk, B.: Managing dynamics of composite Service Level Agreements with COSMA. In: Proc. Int. Conf. on Fuzzy Systems and Knowledge Discovery. (2008) 12. Oriol, M., Marco, J., Franch, X., Ameller, D.: Monitoring adaptable SOA-systems using
SALMon. In: Proc. WS on Service Monitoring, Adaptation and Beyond. (2008)
13. Moser, O., Rosenberg, F., Dustdar, S.: Non-intrusive monitoring and service adaptation for WS-BPEL. In: Proc. WWW’08
14. Sahai, A., Machiraju, V., Sayal, M., van Moorsel, A.P.A., Casati, F.: Automated SLA moni- toring for Web services. In: Proc. Int. WS on Distributed Systems. (2002) 28–41
15. Barbon, F., Traverso, P., Pistore, M., Trainotti, M.: Run-time monitoring of instances and classes of Web service compositions. In: Proc. ICWS’06. 63–71
16. Baresi, L., Ghezzi, C., Guinea, S.: Smart monitors for composed services. In: Proc. IC- SOC’04. 193–202
17. Baresi, L., Guinea, S.: Towards dynamic monitoring of WS-BPEL processes. In: Proc.
ICSOC’05. 269–282
18. Mahbub, K., Spanoudakis, G.: Run-time monitoring of requirements for systems composed of Web-services: Initial implementation and evaluation experience. In: Proc. ICWS’05 19. Baresi, L., Guinea, S.: Towards dynamic monitoring of WS-BPEL processes. Lecture Notes
in Computer Science3826(2005) 269
20. Ludwig, A., Franczyk, B.: COSMA—An Approach for Managing SLAs in Composite Ser- vices. In: Proc. ICSOC’08, Springer 632
21. Pistore, M., Traverso, P.: Assumption-Based Composition and Monitoring of Web Services.
Test and Analysis of Web Services (2007) 307–335
22. Jaeger, M.C., Rojec-Goldmann, G.: SENECA - simulation of algorithms for the selection of Web services for compositions. In: Proc. TES’05. 84–97
23. Bodenstaff, L., Wombacher, A., Reichert, M.: Evaluation data for MoDe4SLA. Technical report: TR-CTIT-10-05, University of Twente (2010)