https://doi.org/10.1007/s00227-019-3596-z ORIGINAL PAPER
Effects of temperature on carbon circulation in macroalgal food webs are mediated by herbivores
Maysa Ito1 · Marco Scotti1 · Markus Franz1 · Francisco R. Barboza1 · Björn Buchholz1 · Martin Zimmer2,3 · Tamar Guy‑Haim1,4 · Martin Wahl1
Received: 23 May 2019 / Accepted: 24 September 2019
© The Author(s) 2019
Abstract
Warming is one of the most dramatic aspects of climate change and threatens future ecosystem functioning. It may alter pri- mary productivity and thus jeopardize carbon sequestration, a crucial ecosystem service provided by coastal environments.
Fucus vesiculosus is an important canopy-forming macroalga in the Baltic Sea, and its main consumer is Idotea balthica.
The objective of this study is to understand how temperature impacts a simplified food web composed of macroalgae and herbivores to quantify the effect on organic carbon storage. The organisms were exposed to a temperature gradient from 5 to 25 °C. We measured and modeled primary production, respiration, growth and epiphytic load on the surface of Fucus and respiration, growth and egestion of Idotea. The results show that temperature affects physiological responses of Fucus and Idotea separately. However, Idotea proved more sensitive to increasing temperatures than the primary producers. The lag between the collapse of the grazer and the decline of Fucus and epiphytes above 20 °C allows an increase of carbon storage of the primary productivity at higher temperatures. Therefore, along the temperature gradient, the simplified food web stores carbon in a non-monotonic way (reaching minimum at 20 °C). Our work stresses the need of considering the combined metabolic performance of all organisms for sound predictions on carbon circulation in food webs.
Introduction
Future predictions on global carbon cycle estimate the rise of atmospheric carbon concentration due to anthropogenic CO2 emissions, the magnitude of which increases even fur- ther when the ocean-atmosphere models are integrated with the responses of primary producers to climate change (Cox et al. 2000). The carbon fixation through photosynthesis and
the release of carbon through respiration determine whether the system is a sink or a source of carbon (Valentini et al.
2000). Warming may decrease net primary production due to steeper increase of respiration than photosynthesis to rising temperature (Tait and Schiel 2013). This mechanism leads to a reduction in carbon fixation by primary producers, thus jeopardizing global carbon sequestration (Mystakidis et al.
2016).
In coastal marine systems, canopy-forming seaweeds are responsible for a substantial proportion of total carbon stor- age (Golléty et al. 2008). For example, in the Australian coast, the estimated storage in living macrophytes biomass is 2200 × 106 grams of carbon per square kilometer (Hill et al.
2015). However, changes in the temperature regime (e.g.
fluctuations and warming) threaten key macroalgae popu- lations and their functioning (Wernberg et al. 2010; Wahl et al. 2015; Arias-Ortiz et al. 2018). In general, temperature- driven individual- and community-level shifts of physiologi- cal responses (Vasseur et al. 2014) and trophic interactions (Gilbert et al. 2014) can impact ecosystem functioning, such as carbon flow within the food web (Duarte and Cebrian 1996).
Responsible Editor: K. Bischof.
Reviewed by undisclosed experts.
* Maysa Ito
maysito@gmail.com
1 GEOMAR Helmholtz Centre for Ocean Research Kiel, Düsternbrooker Weg 20, 24105 Kiel, Germany
2 Leibniz Centre for Tropical Marine Research, Bremen, Germany
3 Faculty 02 Biology/Chemistry, University of Bremen, Bremen, Germany
4 National Institute of Oceanography, Israel Oceanographic and Limnological Research, Haifa, Israel
Under climate change scenarios, grazing plays an impor- tant role in maintaining balanced food webs. For instance, mesograzers consume epiphytic and free floating algae thus increasing light penetration and releasing habitat-forming macrophytes from competition (Alsterberg et al. 2013).
Mesograzers also prey upon small herbivores that feed on benthic microalgae resulting in top-down control (Alster- berg et al. 2013). However, mesograzers may pose a risk to primary producers (Gutow et al. 2016). Provost et al.
(2017) demonstrated that besides direct effects of warming, indirect effects such as increase in herbivory represent addi- tional threats to kelps exposed to higher temperatures. The strength of trophic interactions varies with temperature due to changes in physiological responses (Brown et al. 2004), e.g. consumers experience an increase in metabolic rates with rising temperature that results in individual and popula- tion growth and intensification of feeding rates (O’Connor et al. 2009).
Individual thermal performances are usually hump- shaped, indicating that biochemical reaction rates accel- erate until the optimum temperature (Pörtner and Farrell 2008; Harley et al. 2012). The metabolic intensification, which occurs until the optimum temperature, increases loss of energy through respiration resulting in higher energy demand. All the organisms that compose a food web are vulnerable to the increase of energy demand resulting in the amplification of consumption in all trophic levels. Thus, the amount of energy produced by the lowest trophic level, which is already reduced by physiological response to tem- perature, becomes the limiting factor that determines the structure of the biological community (Kordas et al. 2011).
The ensuing alterations of the food web structure depend on the specific tolerance to warming and the effective trophic level of the interacting organisms involved. A possible sce- nario is that herbivores cope with their rising energy demand by increasing grazing rates (O’Connor 2009). An alterna- tive scenario is related to the loss of herbivores that do not tolerate warming. This loss might alleviate the pressure on the base of the food web, thus resulting in thriving primary producers (Petchey et al. 1999). The combination of both scenarios means that the rise in temperature enhances the metabolic activity of herbivores, thus triggering the top- down control on primary producers until the optimum tem- perature of the grazers is attained. If the temperature contin- ues to rise above the optimal thresholds of herbivores, they will reduce their consumption (i.e. the declining part of the hump-shaped curve) until reaching their upper temperature tolerance limit, thus releasing the primary producers from top-down control (Mertens et al. 2015).
Fucus vesiculosus plays important roles in ecosystem functioning since it provides a habitat to numerous species (Wikström and Kautsky 2007) and contributes to nutrient binding, oxygen production and carbon fixation in coastal
food webs (Worm et al. 2000). The Fucus populations in the Baltic Sea have already experienced steep decline since the 1970s, which was attributed mainly to high input of nutrients (Nilsson et al. 2004). The increase of nutrients may cause a phytoplankton bloom that, due to decreased water trans- parency, restricts the macroalgae population to shallower depths (Kautsky et al. 1986). Another side effect of nutrient load is the excessive growth of filamentous algae (Nilsson et al. 2004). The filamentous algae may affect F. vesiculosus in different ways. The first one is the increase of competi- tion for hard surfaces during the recruitment stage (Berger et al. 2003, Kraufvelin et al. 2007). The second one is that epiphytic filamentous algae may attract grazers that con- sume both epiphytes and host algae, i.e. “co-consumption”, although they may also protect F. vesiculosus from direct predation, i.e. “protective coating” (Wahl and Hay 1995;
Karez et al. 2000; Råberg and Kautsky 2008). In the Baltic Sea, the isopod Idotea balthica exerts strong control on pri- mary producers and is the main consumer of F. vesiculosus (Engkvist et al. 2000).
In this work, we studied the impact of temperature on carbon fluxes together with the interaction between the mac- roalgae system, i.e. the Fucus-epiphytes assemblage (Thorn- ber et al. 2016) and the mesograzer I. balthica. We aimed to (a) investigate how single physiological responses of the Fucus-epiphytes assemblage and I. balthica are modulated by different temperatures and (b) quantify the amount of car- bon transferred through the trophic interaction between the grazer and the macroalgae assemblage along the temperature gradient. We expect temperature to regulate the carbon bal- ance directly by affecting the physiology at individual-level and indirectly due to its effect on grazing rates. Modeling the carbon balance from a system perspective might chal- lenge the interpretation based on the performance of single species.
Materials and methods
Material collectionIndividuals of F. vesiculosus were collected in the Kiel Fjord (54°38ʹN, 10°20ʹE) on 17 Oct 2016 and transported within 20 min to the facilities of GEOMAR while maintained in the seawater from the sampling site. The algae were col- lected together with attached cobbles, as naturally occur in the field. The Fucus individuals were placed in tanks inside a climate chamber at field temperature (15 °C) for 24 h with continuous flow through of seawater. The tanks were equipped with a combination of LED lights providing an irradiance level of 165 μmol photons m−2 s−1 (eco+ LED- Leiste SUNSET 3500 K 34 W and eco+ LED-Leiste DAY 5500 K 34 W, LEDAquaristik UG, Hövelhof, Germany).
The organisms were kept under 12:12 h light: dark cycle, which corresponded to field conditions when the material collection took place. After the initial 24 h, all individu- als of F. vesiculosus were submerged in freshwater for 20 s, a procedure ensuring the removal of all motile organisms associated with the thalli (Holmlund et al. 1990) and the F.
vesiculosus were then placed in the experimental setup. The organisms removed with freshwater were retained in a sieve and 18 I. balthica individuals of approximately 1.2 cm were collected. Each individual was kept isolated inside a 200 mL glass jar with food ad libitum and continuous aeration for temperature acclimation.
Experimental design
The experiment was conducted in the climate chamber from 17 Oct to 30 Nov 2016. The macroalgae were kept in 10 L buckets that were maintained in thermobaths. The buckets were equipped with a mosquito net (mesh size 1.5 mm, installed vertically dividing each bucket into two equal sized halves). In each half of the bucket, one F. vesiculosus indi- vidual of comparable biomass (mean wet weight = 11.2 g, sd = 5.5 g) was placed. The buckets were supplied with con- tinued aeration and received a flow through of 13 L sand- filtered seawater per day pumped from the Kiel Fjord. There were three replicate buckets per temperature treatment.
The target temperatures for the experiment were 5, 10, 15, 20, 22 and 25 °C. Since we expected I. balthica to decline at 25 °C, we added 22 °C for keeping a higher resolution of the hump-shaped curve of the thermal performance.
These temperatures were reached by gradually increasing or decreasing 1 °C per day the initial temperature of the tanks (15 °C). In order to have identical rates of temper- ature change, the starting points of warming and cooling differed in time. After 10 days all tanks attained the target temperatures. Once the target temperatures were reached, in only one of the two halves of each bucket we introduced one individual of I. balthica in order to assess the effect of grazing on F. vesiculosus. The temperature treatment ran for 4 weeks. We started the experiment in October since field temperature matched the mean temperature of the selected gradient (15 °C). Moreover, carrying out the study during this month kept at minimum the amount of energy invested by F. vesiculosus for reproduction (Graiff et al. 2017).
Every week the macroalgae were separated from the graz- ers for 2 days. Both were maintained in thermobaths at the corresponding temperatures; the macroalgae were kept in the buckets and each isopod was transferred to a 200 mL-glass jar for egestion quantification before the respiration meas- urement. This separation process imposed transient starva- tion on the grazers. However, moderated starvation periods have little or no effect on lipid content and survival of adult I. balthica (Gutow et al. 2007).
Incubations
Every week we incubated the Fucus-epiphytes assemblage (i.e.
the brown algae together with associated epiphytes) for pho- tosynthesis and respiration measurements and each I. balthica individually for respiration measurements.
The photosynthesis and respiration of the Fucus-epiphytes assemblage were measured in 6 L gas-tight cylindrical cham- bers equipped with a stirrer and a non-invasive oxygen sensor spot PSt3 (PreSens Precision Sensing GmbH, Regensburg, Germany). The seawater used for incubations was filtered through a 1 μm polypropylene sediment filter. After sealing the chamber, the change in oxygen concentration was logged during 1 h using the Multi-channel Fiber Optic Oxygen Meter Oxy-10 mini (PreSens Precision Sensing GmbH, Regensburg, Germany). The incubation chambers were kept in thermobaths respecting the corresponding temperatures. The photosynthe- sis (net primary production, NPP) incubations were performed under light conditions (165 μmol photons m−2 s−1). The respi- ration measurements were performed in the dark after a black cover was temporarily placed over the tanks. During every incubation, a control chamber containing only filtered seawa- ter was measured for correcting possible changes in oxygen concentration.
The respiration of I. balthica was measured in 100 mL Winkler bottles. The measurements were carried out with the PreSens system described above and logged during 1 h, after sealing the bottle. The water used for incubation was fil- tered through 0.2 μm Whatman mixed cellulose ester filter (GE Healthcare Life Sciences, Germany) and kept in bottles inside thermobaths overnight to reach the temperature of the respective treatments before the incubations. Control incuba- tions of filtered seawater were carried out for detecting pos- sible changes in oxygen concentration due to reasons unrelated to the respiration of I. balthica (e.g. temperature compensa- tion). All the respiration incubations were carried out in ther- mobaths, in order to maintain the experimental temperature conditions.
The oxygen consumed or produced was calculated as the difference between final and initial concentrations; this value was corrected by the control incubations and standardized by incubation time, biomass (wet weight - ww, g) of the Fucus- epiphytes assemblage or length (mm) of I. balthica.
Growth of the Fucus‑epiphytes assemblage
The macrophyte biomass was quantified (ww) weekly. The relative growth rate (RGR) was calculated according to Eq. 1:
(1) RGR(%) =100⋅
ln( bt)
−ln( bt−1) Δt
where bt−1 refers to initial biomass, bt indicates final biomass and Δt is the number of days between the two measurements.
Biomass of epiphytes
In order to avoid disturbing certain properties of the F. vesic- ulosus surface, e.g. bacterial composition (Wahl et al. 2010), during the experiment we did not remove the epiphytic fila- mentous algae growing on the host brown algae. Therefore, biomass quantification and incubations for photosynthesis and respiration refer to both the host brown algae and epi- phytes (i.e. Fucus-epiphytes assemblage). At the end of the experiment, the epiphytes were removed from a piece of F.
vesiculosus with a cell scraper, washed with distilled water and kept in 20 mL glass vials. The samples were frozen at
− 80 °C. They were thawed and dried at 40 °C for 48 h and the dry weight was quantified. The dry weight was normal- ized by the wet weight of the piece of F. vesiculosus from which the epiphytes were removed.
Egestion and growth rates of I. balthica
Weekly, the grazers were isolated from the F. vesiculosus for 48 h (period in which the macroalgae incubations were carried out). After this period, we collected the fecal pellets produced with disposable transfer pipettes and froze them at
− 20 °C. For dry weight (dw) determination, the pellets were thawed, placed in pre-muffled and pre-weighed Whatman glass microfiber filters (GF/C–GE Healthcare Life Sciences, Germany), freeze-dried and weighed. After each incubation, the isopods were photographed and their body length (from cephalon to telson, excluding antennas) was measured using ImageJ software (Schneider et al. 2012). After all measure- ments were completed, the individuals were placed back in the buckets. The body length was converted to body mass according to the Eq. 2 (author’s unpublished data; see sup- plementary information 1, SI.1):
where m is body mass in dry weight (mg) and l is body length (mm). Finally, using weekly measurements of body mass we determined growth rates (Eq. 3):
where G is growth rate, mt and mt-1 are final and initial body mass, respectively, and Δt is the time interval between initial and final measurements (in our case, 7 days).
Carbon consumption of I. balthica
The measurements of egestion (E), respiration (R) and growth (G) rates of I. balthica were converted to carbon (2) log(m) =2.56⋅log(l) −1.86
(3) G=
(mt−mt
−1
)
Δt
(SI.1 and SI.2). The values were summed to determine the carbon consumption per individual per day (C), according to Eq. 4 (Crisp 1971).
In order to quantify the energy used from the carbon storage of the primary producers, we calculated the ratio between I. balthica consumption and the NPP of Fucus- epiphytes assemblage. The ratio presents the proportion of carbon mobilized from NPP of the assemblage, thus the higher the ratio the lower the amount of carbon stored in the primary producers. The oxygen production was con- verted to carbon using a photosynthesis quotient of 1.2 (Kotta et al. 2000) and a respiration quotient was 0.85 (Hawkins and Bayne, 1985) (see SI.3). NPP of the Fucus- epiphytes assemblage and consumption of I. balthica were expressed as milligrams of carbon per day. To obtain a more realistic outcome, we scaled experimentally quanti- fied NPP and consumption with field data of I. balthica density in relation to 1 kg dry weight of F. vesiculosus biomass to the respective temperatures (Anders and Möller 1983) (see SI.4).
Assimilation efficiency of I. balthica
We calculated the assimilation efficiency of I. balthica after Lang et al. (2017). Assimilation efficiency (ε) is obtained dividing the energy assimilated (respiration plus growth) by the total consumption:
Assimilation efficiency is always included in the inter- val 0 ≤ ε ≤ 1; without knowing the relative importance of the three consumption components (i.e. egestion, respira- tion and growth) it can be calculated with the following equation:
where Eε is the activation energy for assimilation efficiency, T is the temperature in Kelvin (K) and T0 the temperature normalized to 20 °C (293.15 K), k is the Boltzmann’s con- stant (8.62 × 10⁻⁵ eV K−1), m is the body mass in grams and αε is the allometric exponent for assimilation efficiency.
Many studies report that the allometric exponent of various types of consumers (i.e. detritivores, herbivores and car- nivores) is 3/4 while the activation energy ranges between 0.6 and 0.7 eV (Brown et al. 2004; Lang et al. 2017). Here we aimed at quantifying the exact values of these constant parameters for I. balthica.
(4) C=G+R+E
(5) 𝜀= R+G
C
(6) 𝜀= eE𝜀
(T−T0)
kTT0 m𝛼𝜀 1+eE𝜀
(T−T0)
kTT0 m𝛼𝜀
Statistical analysis
The focus of our analysis was to assess the effect of tem- perature on the carbon transfer along the Fucus-epiphytes- grazer system. Therefore, the weekly repeated measurements obtained for every response variable were summarized in a single mean value per replicate and temperature level. Meas- urements obtained from the second week onwards were con- sidered, excluding the first week when acclimation to the tar- get temperatures took place. In case of growth of I. balthica, mean daily values as biomass were used along the 3 weeks to avoid stochastic variations due to the molting of single individuals, which occurred during different moments. The effect of the temperature gradient over the response vari- ables of Fucus-epiphytes assemblage (i.e. NPP, respiration, growth and epiphytic load) was modeled using linear regres- sion analysis. The adequacy of the selected models was eval- uated through diagnostic plots of residuals. The models were selected according to the best fit provided by the Akaike Information Criterion (AIC). Respiration, growth, egestion, consumption and ratio consumption:NPP of I. balthica were modeled using nonlinear least squares. The Gaussian equa- tion fitted to these I. balthica responses to temperature was based on Angilletta (2006). The assimilation efficiency was fitted using nonlinear least squares and it follows a logistic model (Lang et al. 2017). The analyses were performed with the R package stats (R Core Team 2017).
Results
NPP, respiration and growth rates of Fucus‑epiphytes assemblage
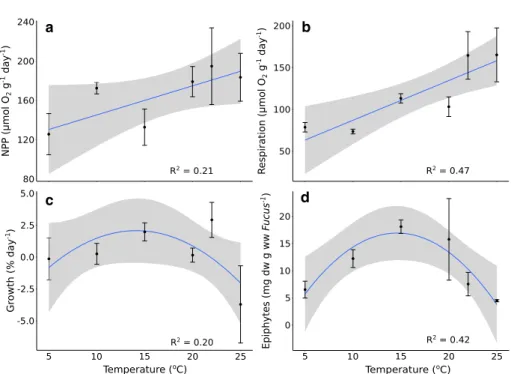
NPP and respiration increased linearly with tempera- ture (Fig. 1a and b; Table 1). On average, the increase of NPP with temperature was marginally significant from 130.41 μmol O2 [g ww Fucus]−1 day−1 at 5 °C to 189.66 μmol O2 [g ww Fucus]−1 day−1 at 25 °C. Respira- tion increased from 63.27 μmol O2 [g ww Fucus]−1 day−1 at 5 °C to 158.28 μmol O2 [g ww Fucus]−1 day−1 at 25 °C.
The best fit for growth rates was a quadratic polynomial (Fig. 1c) although the relationship with temperature was not siginificant (Table 1). The modeled maximum growth rate occurred at 15 °C (2.05% day−1) and the minimum at 25 °C (− 2.04% day−1).
Biomass of epiphytes
Biomass of epiphytes changed with temperature following a quadratic polynomial trend (Fig. 1d; Table 1). The epiphytic load was low at 5 °C (average 6.15 mg dw epiphytes [g ww Fucus]−1), reaching the highest fouling density at 15 °C (20.54 mg dw epiphytes [g ww Fucus]−1). Beyond the peak, the epiphytes biomass declined to 3.79 mg dw epiphytes [g ww Fucus]−1 at 25 °C.
Fig. 1 Relationship between temperature and net primary production (NPP) (a), respi- ration (b), growth (c) of the Fucus-epiphytes assemblage and macroepiphytes load on F.
vesiculosus surface (d) (blue lines: mean trends, grey areas:
95% confidence intervals). The circles correspond to mean values and the bars to standard error of the mean (n = 3)
a b
c d
Respiration, egestion, growth and carbon consumption rates of I. balthica
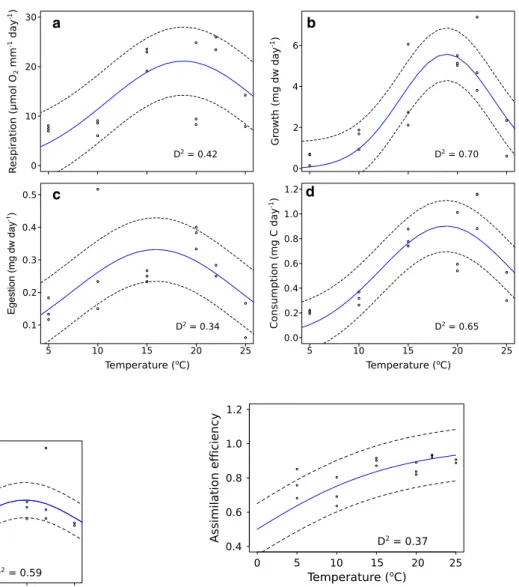
The respiration, growth, egestion and carbon consumption rates of I. balthica were modeled with Gaussian fitting (Table 2). Respiration increased from 5 to 20 °C (4.55 and 20.83 μmol O2 [mm Idotea]−1 day−1, respectively), followed by a decrease reaching 15.29 μmol O2 [mm Idotea]−1 day−1 at 25 °C (Fig. 2a). Growth rates also increased from 5 to 20 °C (0.08 to 5.43 mg dw day−1, respectively), and decreased above this temperature to 2.45 mg dw day−1 at 25 °C (Fig. 2b). Egestion rate observed at 5 °C was 0.15 mg dw day−1, followed by an increase towards the maximum value at 15 °C (0.32 mg dw day−1); after this peak, egestion decreased to 0.19 mg dw day−1 at 25 °C (Fig. 2c). The amount of carbon con- sumed by the isopod was low at 5 and 10 °C (0.10 and 0.38 mg C day−1, respectively), increased and peaked at 20 and 22 °C (0.89 and 0.81 mg C day−1, respectively),
followed by a final decline at 25 °C (0.59 mg C day−1) (Fig. 2d; Table 2).
Ratio consumption: NPP
The ratio of organic carbon consumed in relation to the NPP informs about how much useful carbon produced by Fucus- epiphytes assemblage is lost to grazing instead of being potentially available for growth, reproduction and exudate (e.g. as dissolved organic carbon) of the macroalgae. The ratio responded to temperature following a Gaussian trend (Fig. 3; Table 2). From 5 to 22 °C the proportion increased from 0.001 to 0.024 decreasing at 25 °C to 0.017. Gutow et al. (2006) found that I. balthica is able to destroy algae patches rapidly due to sloppy feeding behavior, which we did not take into account for the proportion calculated. Thus, despite the low percentage we found in this study, this might be an underestimation of the carbon removal of the macroal- gae assemblage by I. balthica.
Table 1 Linear model results of the response variables of Fucus-epiphytes assemblage exposed to temperature gradient
The linear models follow the equation y = a + bx and the quadratic function follows the equation y = a + bx + cx2. The element y corresponds to the response variable (NPP—net primary production, respiration, growth and epyphites load), x is the temperature (independent variable) and the parameters a, b and c refer to the terms presented
Response variable Model Term Estimate Std. Error t value p value
NPP Linear (R2 = 0.214, F1, 14 = 3.803, p = 0.071) a 115.597 28.042 4.122 0.001
b 2.962 1.519 1.950 0.071
Respiration Linear (R2 = 0.465, F1, 14 = 12.180, p = 0.003) a 39.514 25.129 1.572 0.138
b 4.750 1.361 3.490 0.003
Growth Quadratic (R2 = 0.202, F2, 15 = 1.897, p = 0.184) a 0.243 0.716 0.339 0.739
b − 1.782 3.037 − 0.587 0.566
c − 5.641 3.037 − 1.857 0.083
Epiphytic load Quadratic (R2 = 0.417, F2, 14 = 4.997, p = 0.023) a 11.149 1.423 7.830 < 0.001
b − 0.614 5.871 − 0.105 0.918
c − 18.549 5.871 − 3.159 0.006
Table 2 Gaussian model results summarizing the response variables from I. balthica exposed to temperature gradient
The term mu refers to mean value and the term sigma stands for standard deviation of the Gaussian func- tion fitted
Species Response variable Term Estimate Std.
Error t value P value I. balthica Respiration (D2 = 0.42) Mu 18.710 1.729 10.821 < 0.001
Sigma 7.828 2.089 3.747 0.002
Growth (D2 = 0.70) Mu 18.910 0.677 27.910 < 0.001 Sigma 4.747 0.813 5.833 < 0.001 Egestion (D2 = 0.34) Mu 15.899 1.302 12.204 < 0.001 Sigma 8.579 1.961 4.374 < 0.001 Consumption (D2 = 0.65) Mu 18.843 0.990 19.030 < 0.001 Sigma 6.673 1.178 5.663 < 0.001 Ratio consumption: NPP (D2 = 0.59) Mu 19.822 1.342 14.770 < 0.001
Sigma 5.930 1.508 3.931 0.001
Assimilation efficiency
The assimilation efficiency of I. balthica followed a logistic trend that tends to saturation with increasing tem- perature (i.e. especially, starting from 15 °C; Fig. 4). By applying the Eqs. 5 and 6 to our data, we fitted a logistic curve and obtained the value of the constant parameters representing the allometric exponent (αε = 0.77) and the activation energy (Eε = 0.74 eV) for the assimilation effi- ciency of I. balthica. These values comply with those of the metabolic theory (Brown et al. 2004) as illustrated by Lang et al. (2017), i.e. αε = 0.75 and 0.6 eV ≤ Eε ≤ 0.7 eV.
Discussion
In this work we measured individual-level metabolic responses of two consecutive trophic levels exposed to a temperature gradient and combined them to quantify the potential carbon storage in the primary producers of this simplified food web. The NPP rate of F. vesiculosus pre- sented an increase (marginally significant) and respiration rates of the macroalgae increased linearly under the tem- perature gradient to which they were exposed (Fig. 1). The respiration and growth rates of the mesograzers reached maximum values at ca. 20 °C, while egestion rate peaked at 15 °C (Fig. 2a–c). The proportion of carbon consumed by the isopods to the NPP of the Fucus-epiphytes assem- blage (Fig. 3) followed the individual carbon consumption
Fig. 2 Relationship between temperature and respiration (a), growth (b), egestion (dw of fecal pellets produced per day) (c) and carbon consump- tion (d) rates of Idotea balthica.
The circles correspond to the replicates (n = 3), the blue line refers to mean trend and dashed lines define the thresholds of the 95% confidence intervals
a b
c d
Fig. 3 Relationship between temperature and ratio of Idotea balthica consumption to Fucus vesiculosus NPP. The circles correspond to the replicates (n = 3), the blue line refers to mean trend and dashed lines define the thresholds of the 95% confidence intervals
Fig. 4 Relationship between temperature and assimilation efficiency of Idotea balthica. The circles correspond to the replicates (n = 3), the blue line refers to mean trend and dashed lines define the thresholds of the 95% confidence intervals
trend of I. balthica (Fig. 2d) with both peaking around 20 °C. The carbon balance of the trophic interaction between the Fucus-epiphytes assemblage and I. balthica was regulated by temperature. The combination of meta- bolic processes with different functional responses (i.e.
the modeled trends) illustrates that conclusions on carbon balance differ when considering single species in isolation versus a system perspective.
F. vesiculosus is able to withstand a wide range of envi- ronmental changes, since the species is exposed to different temperatures along the seasons (Takolander et al. 2017).
Graiff et al. (2015) demonstrated that the temperature for maximum photosynthesis capacity (expressed as maximum relative electron transport rate) was 24 °C. Takolander et al.
(2017) found that temperatures beyond 26 °C jeopardize the photosynthetic activity of the macroalgae. In our study, the rates of NPP did not decrease along the temperature gradient and respiration of the Fucus-epiphytes assemblage increased linearly with temperature (Fig. 1a and b). Our experimental temperature did not exceed 25 °C, which could be the reason we did not detect a collapse in NPP rates. In addition, we were not able to directly disentangle the contribution of F.
vesiculosus to NPP and respiration from that of epiphytes.
However, Binzer and Middelboe (2005) demonstrated that the photosynthetic performance per thallus surface area of Fucus in isolation is higher than that of epiphytic filamen- tous algae. Graiff et al. (2015) showed that the highest rates of F. vesiculosus growth ranged between 15 and 20 °C. In our work, although the growth rate trend (Fig. 1c) was com- parable with the previous study, it did not respond signifi- cantly to temperature (Table 1). In light of these results and the similiarities of our trends to those obtained by previous studies (Graiff et al. 2015; Takolander et al. 2017), we sug- gest that in our work F. vesiculosus was the main responsible for NPP changes. Noticeably, the NPP rate was relatively low at 15 °C, the temperature in which the epiphytic load peaked (Fig. 1d). This pattern could indicate that epiphytes negatively affected the photosynthetic activity of F. vesicu- losus due to shading (Vogt and Schramm 1991; Rohde et al.
2008).
Differences in the trends displayed by the physiologi- cal responses of I. balthica in relation to temperature were detected. Our study shows that all metabolic variables con- sidered for I. balthica responded to temperature following a non-monotonic curve, exhibiting increasing values up to the optimum (Strong and Daborn 1980). Respiration and growth rates peaked at ca. 20 °C, beyond which they decreased, showing considerably lower values at 25 °C (Fig. 2a and b).
Similarly, Panov and MacQueen (1998) observed that high temperatures are responsible for low growth rates of amphi- pods. In case of respiration, our model corroborates the findings of Gutow et al. (2016) between 10 and 22 °C. Our results demonstrate that beyond 22 °C, the respiration rate
declines, revealing the upper limit for this response variable for I. balthica. Clarke and Fraser (2004) suggested respira- tion rates as an appropriate indicator for basal metabolism (i.e. energy necessary for maintaining essential metabolic activities) in invertebrates because the respiration is related to the synthesis of ATP. Therefore, a temperature of 20 °C can be regarded as the limit of I. balthica metabolism capac- ity since the respiration rates attain their maximum. Dif- ferently, egestion rate peaked at lower temperature (15 °C;
Fig. 2c). Although the amount of algae consumed directly by the grazer was not quantified in our experiment, Gutow et al. (2006) found that I. balthica egests about 90% of the ingested algae. The high percentage is attributed to the her- bivore feeding, i.e. the algae are available in excess and such diet is poor in nitrogen and proteins thus the feeding rate must be intensified in order to supply the isopod’s demands.
As an analogy to ecosystem functioning, the fitness of individuals should be considered as multidimensional (Laughlin and Messier 2015). Thus, in order to have a bet- ter perspective of how the grazers interfere in the carbon balance, we integrated the physiological response variables that result in energy expenditure (i.e. respiration, growth and egestion) for calculating carbon consumption. Our out- comes on the individual responses demonstrate that the car- bon consumed by I. balthica was modulated by temperature (Fig. 2d). The I. balthica consumption changed very little at low temperatures (between 5 and 10 °C) and increased from 10 to ca. 20 °C, followed by a drastic decrease beyond this threshold. Respiration is usually the most important determi- nant of an individual’s carbon budget (López-Urrutia et al.
2006) but our results show that both growth and respiration can mostly explain the changes of this response variable for I. balthica.
Allen et al. (2005) suggested that the carbon stored in the individuals can be scaled up to calculate the stor- age capacity of ecosystems. Therefore, we focused on the proportion of NPP consumed by I. balthica to under- stand how the carbon storage in the simplified food web of the experiment was modulated by the temperature gradient. Although the NPP rate increased linearly with temperature, the ratio of carbon consumed by I. balthica in relation to NPP increased up to 20 °C and decreased at 25 °C (Fig. 3). This outcome can be explained by the mesograzer’s carbon consumption and is coherent with the increase of grazing on the primary producers that was previously found to occur in temperatures up to 20 °C (Gutow et al. 2016). The change in the ratio is due to the reduction of the metabolism of I. balthica (Fig. 2) at temperatures above 22 °C. Werner et al. (2016) also found that warming affected the metabolism of grazers at lower temperatures than that of the primary producers. This pat- tern confirms the finding of Mertens et al. (2015) that the daily interaction strength per capita increased up to 20 °C.
Between 22 and 24 °C the strength declined significantly, i.e. the primary producers outperformed the grazers under higher temperatures. Our results show that the decline of potential carbon storage is driven by I. balthica within the temperature range of its maximum consumption (from 15 to 20 °C; Kotta et al. 2006). Therefore, the carbon stor- age in this simplified food web is regulated by top-down control only at temperatures between 15 and 20 °C, while above such interval the decline in the consumption of the grazers was severe enough to attenuate the effect on the NPP.Although the grazer’s consumption in relation to NPP may be regarded as negligible (up to 2.5%), the secondary production is a relevant link to higher trophic levels in the food web (Waters 1977). Secondary production is defined as the formation of biomass by heterotrophic organisms (Benke and Huryn 2010) and is directly dependent on assimilation efficiency, which is modulated by tempera- ture (Lang et al. 2017). In our study, the assimilation effi- ciency increased with temperature (Fig. 4) and, according to the values of Lang et al. (2017), at higher temperatures the assimilation efficiency of I. balthica was comparable to that of carnivores. The authors detected differences in the assimilation efficiencies of detritivores, herbivores and carnivores, attributing the dissimilarities between the feeding modes to digestibility. Jormalainen et al.
(2005) found that phlorotannin produced by F. vesiculo- sus was responsible for lowering assimilation efficiency in I. balthica since this compound decreases digestibility.
However, temperatures higher than 20 °C inhibit the pro- duction of phlorotannins by brown algae (Cruces et al.
2012), which supports high assimilation efficiency of the grazers. In our study such pattern is further corroborated by the egestion rates of the isopod, which decreased at 20 °C, thus suggesting higher digestibility. Therefore, the secondary production in the present work was a product of the synergistic response of autotrophs and heterotrophs to temperature.
Warming is expected to intensify the loss of carbon stored within the living systems (Allen et al. 2005). Here we show that at temperatures higher than 20 °C the Fucus- epiphytes assemblage presents higher capacity to store carbon while the grazers display a decline in all meta- bolic responses. The combination of the linear NPP trend of the macroalgae (Fig. 1a) together with the Gaussian distribution of I. balthica consumption (peak at 18.8 °C;
Fig. 2d; Table 2) resulted in a Gaussian response (ratio consumption: NPP; Fig. 3) that attains its maximum at 19.8 °C (Table 2). These outcomes emphasize how inte- grating the study of the physiological responses of single species with herbivory is crucial to quantify functioning and services provided by primary producers under global warming scenarios.
Conclusions
In this work, we showed that the strength of the interaction between the Fucus-epiphytes assemblage and I. balthica is modulated by species-specific physiological responses to temperature. The decline of the herbivore’s physiological performance causes an increase in carbon storage at the level of the primary producers. Therefore, the interaction strength between primary producers and herbivore plays an important role in driving the carbon balance of the system in times of ocean warming. The inclusion of primary producers has been shown to be an essential feature to yield accurate car- bon cycle estimates using ocean-atmosphere models (Cox et al. 2000). Here we demonstrate that trophic interactions should not be neglected if the goal is to generate realistic predictions of carbon storage and circulation in food webs.
Acknowledgements We are thankful to Dr. Lars Gutow for provid- ing data for the conversion of fecal pellets dry weight into carbon, Christian Pansch for allowing the use of the mesocosms facilities and Katherine Amorim for providing support during the experiment.
We would like to thank two anonymous reviewers for the comments that improved the manuscript. MI acknowledges financial support of CAPES foundation (Ministry of Education of Brazil) through the Doctoral Programme (Process Number: 99999.001303/2015-05). FRB acknowledges the financial support of the German Academic Exchange Service (DAAD) through the project Doctoral Programmes in Germany 2015/16 (57129429).
Author contribution MI and MW conceived and designed the study.
MI, MS, MF, FRB and BB conducted the experiment. MI, MS, MZ, FRB and TGH analyzed the data. MI wrote the first draft of the manu- script. All authors significantly contributed to the preparation and revi- sion of the manuscript.
Data availability The data is archived at PANGEA database. https ://
doi.panga ea.de/10.1594/PANGA EA.90165 8
Compliance with ethical standards
Conflict of interest The authors declare that they have no conflict of interest.
Ethical statement All applicable international, national, and/or institu- tional guidelines for the care and use of animals were followed.
Open Access This article is distributed under the terms of the Crea- tive Commons Attribution 4.0 International License (http://creat iveco mmons .org/licen ses/by/4.0/), which permits unrestricted use, distribu- tion, and reproduction in any medium, provided you give appropriate credit to the original author(s) and the source, provide a link to the Creative Commons license, and indicate if changes were made.
References
Allen AP, Gilloly JF, Brown JH (2005) Linking the global carbon cycle to individual metabolism. Funct Ecol 19:202–213. https ://doi.org /10.1111/j.1365-2435.2005.00952 .x
Alsterberg C, Eklöf JS, Gamfeldt L, Havenhand JN, Sundbäck K (2013) Consumers mediate the effects of experimental ocean acidifica- tion and warming on primary producers. P Natl Acad Sci USA 110:8603–8608. https ://doi.org/10.1073/pnas.13037 97110 Anders K, Möller H (1983) Seasonal fluctuations in macrobenthic
fauna of the F. vesiculosus belt in Kiel Fjord (western Baltic Sea). Helgoländer Meeresun 36:277–283. https ://doi.org/10.1007/
BF019 83631
Angilletta MJ (2006) Estimating and comparing thermal performance curves. J Therm Biol 31:541–545. https ://doi.org/10.1016/j.jther bio.2006.06.002
Arias-Ortiz A, Serrano O, Masqué P, Lavery PS, Mueller U, Kend- rick GA et al (2018) A marine heatwave drives massive losses from the world’s largest seagrass carbon stocks. Nat Clim Change 8:338–344. https ://doi.org/10.1038/s4155 8-018-0096-y Benke AC, Huryn AD (2010) J N Am Benthol Soc 29:264–285. https
://doi.org/10.1899/08-075.1
Berger R, Henriksson E, Kautsky L, Malm T (2003) Effects of filamen- tous algae and deposited matter on the survival of Fucus vesicu- losus L. germlings in the Baltic Sea. Aquat Ecol 37:1–11. https ://
doi.org/10.1023/A:10221 36900 630
Binzer T, Middelboe AL (2005) From thallus to communities: scale effects and photosynthetic performance in macroalgae communi- ties. Mar Ecol Prog Ser 287:65–75. https ://doi.org/10.3354/meps2 87065
Brown JH, Gillooly JF, Allen AP, Savage VM, West GB (2004) Toward a metabolic theory of ecology. Ecology 85:1771–1789. https ://doi.
org/10.1890/03-9000
Clarke A, Fraser KPP (2004) Why does metabolism scale with temperature? Funct Ecol 18:243–251. https ://doi.org/10.111 1/j.0269-8463.2004.00841 .x
Cox PM, Betts RA, Jones CD, Spall SA, Totterdell IJ (2000) Accel- eration of global warming due to carbon-cycle feedbacks in a coupled climate model. Nature 408:184–187. https ://doi.
org/10.1038/35041 539
Crisp DJ (1971) Energy flow measurements. In: Holme NA, McIntyre AD (eds) Methods for the study of marine benthos. Blackwell Scientific Publications, Oxford, pp 197–279
Cruces E, Huovinen P, Gomez I (2012) Phlorotannin and antioxidant responses upon short-term exposure to UV radiation and elevated temperature in three South Pacific kelps. Photochem Photobiol 88:58–66. https ://doi.org/10.1111/j.1751-1097.2011.01013 .x Duarte CM, Cebrian J (1996) The fate of marine autotrophic produc-
tion. Limnol Oceanogr 41:1758–1766. https ://doi.org/10.4319/
lo.1996.41.8.1758
Engkvist R, Malm T, Tobiasson S (2000) Density dependent graz- ing effects of the isopod Idotea baltica Pallas on Fucus vesicu- losus L in the Baltic Sea. Aquat Ecol 34:253–256. https ://doi.
org/10.1023/A:10099 19526 259
Gilbert B, Tunney TD, McCann KS, DeLong JP, Vasseur DA, Sav- age V et al (2014) A bioenergetic framework for the temperature dependence of trophic interactions. Ecol Lett 17:902–914. https ://doi.org/10.1111/ele.12307
Golléty C, Migne A, Davoult D (2008) Benthic metabolism on a shel- tered rocky shore: role of the canopy in the carbon budget. J Phycol 44:1146–1153. https ://doi.org/10.1111/j.1529-8817.2008.00569 .x Graiff A, Liesner D, Karsten U, Bartsch I (2015) Temperature toler- ance of western Baltic Sea Fucus vesiculosus—growth, photosyn- thesis and survival. J Exp Mar Biol Ecol 471:8–16. https ://doi.
org/10.1016/j.jembe .2015.05.009
Graiff A, Dankworth M, Wahl M, Karsten U, Bartsch I (2017) Seasonal variations of Fucus vesiculosus fertility under ocean acidification and warming in the western Baltic Sea. Bot Mar 60:239–255.
https ://doi.org/10.1515/bot-2016-0081
Gutow L, Strahl J, Wiencke C, Franke HD, Saborowski R (2006) Behavioural and metabolic adaptations of marine isopods to the rafting life style. Mar Biol 149:821–828. https ://doi.org/10.1007/
s0022 7-006-0257-9
Gutow L, Leidenberger S, Boos K, Franke HD (2007) Differential life history responses of two Idotea species (Crustacea: Isopoda) to food limitation. Mar Ecol Prog Ser 344:159–172. https ://doi.
org/10.3354/meps0 6894
Gutow L, Petersen I, Bartl K, Huenerlage K (2016) Marine meso- herbivore consumption scales faster with temperature than sea- weed primary production. J Exp Mar Biol Ecol 477:80–85. https ://doi.org/10.1016/j.jembe .2016.01.009
Harley CDG, Anderson KM, Demes KW, Jorve JP, Kordas RL, Coyle TA, Graham MH (2012) Effects of climate change on global seaweed communities. J Phycol 48:1064–1078. https ://doi.org/
10.1111/j.1529-8817.2012.01224 .x
Hawkins AJS, Bayne BL (1985) Seasonal variation in the relative utilization of carbon and nitrogen by the mussel Mytilus edulis:
budgets, conversion efficiencies and maintenance requirements.
Mar Ecol Prog Ser 25:181–188. https ://doi.org/10.3354/meps0 25181
Hill R, Bellgrove A, Macreadie PI, Petrou K, Beardall J, Steven A, Ralph PJ (2015) Can macroalgae contribute to blue carbon? An Australian perspective. Limnol Oceanogr 60:1689–1706. https ://
doi.org/10.1002/lno.10128
Holmlund MB, Peterson CH, Hay ME (1990) Does algal morphology affect amphipod susceptibility to fish predation? J Exp Mar Biol Ecol 139:65–83. https ://doi.org/10.1016/0022-0981(90)90039 -F Jormalainen V, Honkanen T, Vesakoski O, Koivikko R (2005) Polar
extracts of the brown alga Fucus vesiculosus (L.) reduce assimi- lation efficiency but do not deter the herbivorous isopod Idotea baltica (Pallas). J Exp Mar Biol Ecol 317:143–157. https ://doi.
org/10.1016/j.jembe .2004.11.021
Karez R, Engelbert S, Sommer U (2000) ‘Co-consumption’ and ‘pro- tective coating’: two new proposed effects of epiphytes on their macroalgal hosts in mesograzer-epiphyte-host interactions. Mar Ecol Prog Ser 205:85–93. https ://doi.org/10.3354/meps2 05085 Kautsky N, Kautsky H, Kautsky U, Waern M (1986) Decreased depth
penetration of Fucus vesiculosus (L.) since the 1940s indicates eutrophication of the Baltic Sea. Mar Ecol Prog Ser 28:1–8. https ://doi.org/10.3354/meps0 28001
Kordas RL, Harley CDG, O’Connor MI (2011) Community ecology in a warming world: the influence of temperature on interspecific interactions in marine systems. J Exp Mar Biol Ecol 400:218–226.
https ://doi.org/10.1016/j.jembe .2011.02.029
Kotta J, Paalme T, Martin G, Makinen A (2000) Major changes in mac- roalgae community composition affect the food and habitat pref- erence of Idotea baltica. Int Rev Hydrobiol 85:697–706. https ://
doi.org/10.1002/1522-2632(20001 1)85:5/6%3c697 :AID-IROH6 97%3e3.0.CO;2-0
Kotta J, Orav-Kotta H, Paalme T, Kotta I, Kukk H (2006) Seasonal changes in situ grazing of the mesoherbivores Idotea baltica and Gammarus oceanicus on the brown algae Fucus vesiculo- sus and Pylaiella littoralis in the central Gulf of Finland, Baltic Sea. Hydrobiologia 554:117–125. https ://doi.org/10.1007/s1075 0-005-1011-x
Kraufvelin P, Ruuskanen AT, Nappu N, Kiirikki M (2007) Winter colo- nisation and succession of filamentous macroalgae on artificial substrates and possible relationships to Fucus vesiculosus settle- ment in early summer. Estuar Coast Shelf S 72:665–674. https ://
doi.org/10.1016/j.ecss.2006.11.029
Lang B, Ehnes RB, Brose U, Rall BC (2017) Temperature and con- sumer type dependencies of energy flows in natural communities.
Oikos 126:1717–1725. https ://doi.org/10.1111/oik.04419 Laughlin DC, Messier J (2015) Fitness of multidimensional phenotypes
in dynamic adaptive landscapes. Trends Ecol Evol 30:487–496.
https ://doi.org/10.1016/j.tree.2015.06.003
López-Urrutia Á, San Martin E, Harris RP, Irigoien X (2006) Scal- ing the metabolic balance of the oceans. P Natl Acad Sci USA 103:8739–8744. https ://doi.org/10.1073/pnas.06011 37103 Mertens NL, Russell BD, Connell SD (2015) Escaping herbivory:
ocean warming as a refuge for primary producers where con- sumer metabolism and consumption cannot pursue. Oecologia 179:1223–1229. https ://doi.org/10.1007/s0044 2-015-3438-8 Mystakidis S, Davin EL, Gruber N, Seneviratne SI (2016) Constraining
future terrestrial carbon cycle projections using observation-based water and carbon flux estimates. Glob Change Biol 22:2198–2215.
https ://doi.org/10.1111/gcb.13217
Nilsson J, Engkvist R, Persson LE (2004) Long-term decline and recent recovery of Fucus populations along the rocky shores of southeast Sweden, Baltic Sea. Aquat Ecol 38:587–598. https ://doi.
org/10.1007/s1045 2-004-5665-7
O’Connor MI (2009) Warming strengthens an herbivore—plant inter- action. Ecology 90:388–398. https ://doi.org/10.1890/08-0034.1 O’Connor MI, Piehler MF, Leech DM, Anton A, Bruno JF (2009)
Warming and resource availability shift food web structure and metabolism. PLoS Biol 7:e1000178. https ://doi.org/10.1371/journ al.pbio.10001 78
Panov VE, McQueen DJ (1998) Effects of temperature on individual growth rate and body size of a freshwater amphipod. Can J Zoolog 76:1107–1116. https ://doi.org/10.1139/z98-025
Petchey OL, McPhearson PT, Casey TM, Morin PJ (1999) Environ- mental warming alters food-web structure and ecosystem function.
Nature 402:69–72. https ://doi.org/10.1038/47023
Pörtner HO, Farrell AP (2008) Physiology and climate change. Science 322:690–692. https ://doi.org/10.1126/scien ce.11631 56
Provost EJ, Kelaher BP, Dworjanyn SA, Russell BD, Connell SD, Ghedini G et al (2017) Climate-driven disparities among eco- logical interactions threaten kelp forest persistence. Glob Change Biol 23:353–361. https ://doi.org/10.1111/gcb.13414
Råberg S, Kautsky L (2008) Grazer identity is crucial for facilitating growth of the perennial brown alga Fucus vesiculosus. Mar Ecol Prog Ser 361:111–118. https ://doi.org/10.3354/meps0 7428 Rohde S, Hiebenthal C, Wahl M, Karez R, Bischof K (2008) Decreased
depth distribution of Fucus vesiculosus (Phaeophyceae) in the Western Baltic: effects of light deficiency and epibionts on growth and photosynthesis. Eur J Phycol 43:143–150. https ://doi.
org/10.1080/09670 26080 19010 18
Schneider CA, Rasband WS, Eliceiri KW (2012) NIH Image to ImageJ:
25 years of image analysis. Nat Methods 9:671–675. https ://doi.
org/10.1038/nmeth .2089
Strong KW, Daborn GR (1980) The influence of temperature on energy budget variables, body size, and seasonal occurrence of the isopod Idotea baltica (Pallas). Can J Zoolog 58:1992–1996. https ://doi.
org/10.1139/z80-274
Tait LW, Schiel DR (2013) Impacts of temperature on primary pro- ductivity and respiration in naturally structured macroalgal assemblages. PLoS ONE 8:e74413. https ://doi.org/10.1371/journ al.pone.00744 13
Takolander A, Leskinen E, Cabeza M (2017) Synergistic effects of extreme temperature and low salinity on foundational macroalga
Fucus vesiculosus in the northern Baltic Sea. J Exp Mar Biol Ecol 495:110–118. https ://doi.org/10.1016/j.jembe .2017.07.001 R Core Team (2017) R: a language and environment for statistical com-
puting. R Foundation for Statistical Computing, Vienna, Austria.
Accessible online at: https ://www.R-proje ct.org/
Thornber C, Jones E, Thomsen M (2016) Epibiont-marine macrophyte assemblages. In: Ólafsson E (ed) Marine macrophytes as founda- tion species. CRC Press, Boca Raton, pp 43–65
Valentini R, Matteucci G, Dolman AJ, Schulze ED, Rebmann CJ, Moors EJ et al (2000) Respiration as the main determinant of carbon balance in European forests. Nature 404:861–865. https ://
doi.org/10.1038/35009 084
Vasseur DA, DeLong JP, Gilbert B, Greig HS, Harley CDG, McCann KS et al (2014) Increased temperature variation poses a greater risk to species than climate warming. P Roy Soc B 281:20132612.
https ://doi.org/10.1098/rspb.2013.2612
Vogt H, Schramm W (1991) Conspicuous decline of Fucus in Kiel Bay (western Baltic): what are the causes? Mar Ecol Prog Ser 69:189–194. https ://doi.org/10.3354/meps0 69189
Wahl M, Hay ME (1995) Associational resistance and shared doom:
effects of epibiosis on herbivory. Oecologia 102:329–340. https ://doi.org/10.1007/BF003 29800
Wahl M, Shahnaz L, Dobretsov S, Saha M, Symanowski F, David K et al (2010) Ecology of antifouling resistance in the bladder wrack Fucus vesiculosus: patterns of microfouling and antimicrobial pro- tection. Mar Ecol Prog Ser 411:33–48. https ://doi.org/10.3354/
meps0 8644
Wahl M, Molis M, Hobday AJ, Dudgeon S, Neumann R, Steinberg P et al (2015) The responses of brown macroalgae to environ- mental change from local to global scales: direct versus eco- logically mediated effects. Perspect Phycol 2:11–29. https ://doi.
org/10.1127/pip/2015/0019
Waters TF (1977) Secondary production in inland waters. In: Mac- fadyen A (ed) Advances in ecological research, vol 10. Aca- demic Press, London, pp 91–164. https ://doi.org/10.1016/s0065 -2504(08)60235 -4
Wernberg T, Thomsen MS, Tuya F, Kendrick GA, Staehr PA, Toohey BD (2010) Decreasing resilience of kelp beds along a latitudinal temperature gradient: potential implications for a warmer future. Ecol Lett 13:685–694. https ://doi.org/10.111 1/j.1461-0248.2010.01466 .x
Werner FJ, Graiff A, Matthiessen B (2016) Temperature effects on seaweed-sustaining top-down control vary with season. Oecologia 180:889–901. https ://doi.org/10.1007/s0044 2-015-3489-x Wikström SA, Kautsky L (2007) Structure and diversity of inverte-
brate communities in the presence and absence of canopy-forming Fucus vesiculosus in the Baltic Sea. Estuar Coast Shelf S 72:168–
176. https ://doi.org/10.1016/j.jembe .2011.02.029
Worm B, Lotze HK, Sommer U (2000) Coastal food web structure, car- bon storage, and nitrogen retention regulated by consumer pres- sure and nutrient loading. Limnol Oceanogr 45:339–349. https ://
doi.org/10.4319/lo.2000.45.2.0
Publisher’s Note Springer Nature remains neutral with regard to jurisdictional claims in published maps and institutional affiliations.