Supporting Information for
“Initialization and ensemble generation for decadal climate pre- dictions: A comparison of different methods”
Iuliia Polkova1, Sebastian Brune1, Christopher Kadow2, Vanya Romanova3, Gereon Gollan4, Johanna Baehr1, Rita Glowienka-Hense3,
Richard J. Greatbatch4, Andreas Hense3, Sebastian Illing2, Armin K¨ohl1, J¨urgen Kr¨oger5, Wolfgang A. M¨uller5, Klaus Pankatz6and Detlef Stammer1
1Institute of Oceanography, Universit¨at Hamburg, CEN, Hamburg, Germany.
2Institute for Meteorology, Freie Universit¨at Berlin, Berlin, Germany.
3Meteorological Institute, University Bonn, Bonn, Germany.
4GEOMAR Helmholtz Centre for Ocean Research Kiel, Kiel, Germany.
5Max Planck Institute for Meteorology, Hamburg, Germany.
6Deutscher Wetterdienst, Offenbach am Main, Germany.
Contents
1. Figure S1 to Section 3.1 on SAT correlation skill.
2. Figures S2 to Section 3.1 on HC700 correlation skill.
3. Figure S3 to Section 3.3 on HC700 anomalies of the North Atlantic subpolar gyre.
4. Figures S4 to Section 3.3 on the basin-wide AMOC mean for lead year 5.
5. Figures S5 to Section 3.3 on the basin-wide AMOC standard deviation for lead year 5.
6. Figures S6 to Section 3.4 on SST ESS, ensemble spread and root-mean-squared error for lead year 1.
7. Figures S7 to Section 3.4 on SST ESS, ensemble spread and root-mean-squared
Additional Figures to Section “3.1 Prediction Skill for Surface Air Tem- perature (SAT) and the upper-ocean heat content (HC700)”
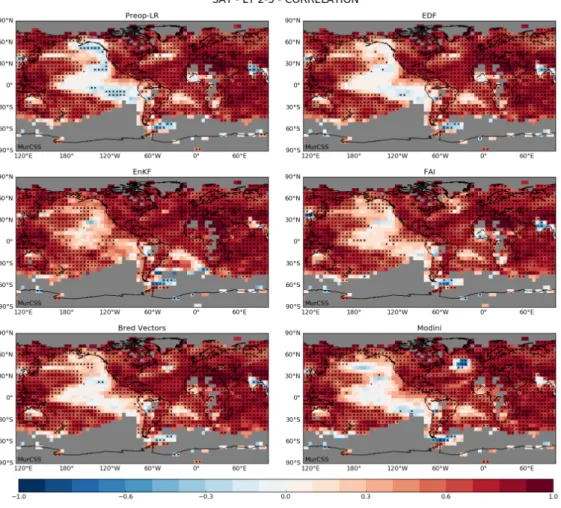
The SAT and HC700 prediction skill from the test-suite experiments and the ref- erence system Preop-LR in terms of correlation coefficients in Figs. S1-S2. Apart from the eastern and central Pacific Ocean and the frontal area of the western-boundary cur- rents, Preop-LR correlates well with SAT from the HadCRUT4 verification data set (Fig.
S1). In the Pacific Ocean, there is an area of reduced skill in lead years 2-5 resembling a characteristic oscillation pattern, i.e., the Pacific Decadal Oscillation. Though corre- lation skill in the this area of the Pacific Ocean tends to come closer to positive values in all test-suite experiments, it is still not statistically significant.
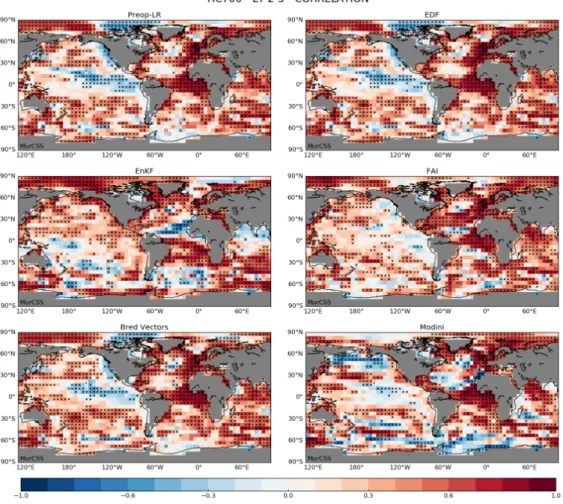
For HC700, in comparison to Preop-LR, the EnKF and FAI reveal better agree- ment with the NOAA/NODC heat content in the eastern and central Pacific Ocean (Fig.
S2). The EnKF shows negative correlation along the Canary Current and the Indian Ocean.
The EDF and the BV, which build on the Preop-LR assimilation, mimic low skill areas of Preop-LR.
Additional Figures to Section “3.3 Skill for the North Atlantic Ocean”
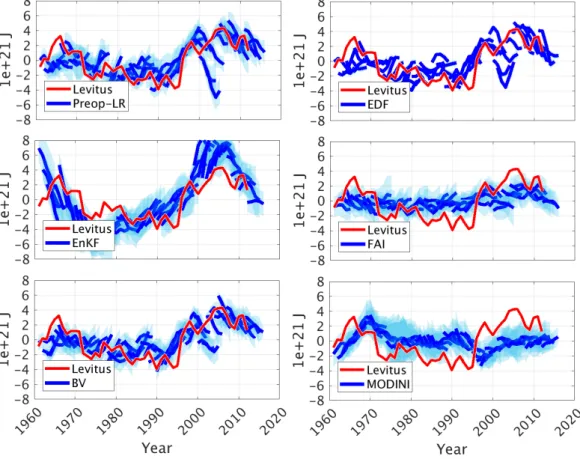
As discussed in the main manuscript, Preop-LR and the EDF and to a smaller ex- tent BV and FAI show a “spike” around 2005. A similar “spike” is also present for the previous MiKlip systems. It comes from hindcasts started in 2000 and 2001 shown in Fig- ure S3. For these initialization cases, the BV and FAI hindcasts show cooler SPG HC700 than in the verification dataset, and Preop-LR and the EDF show a decrease of the SPG HC700.
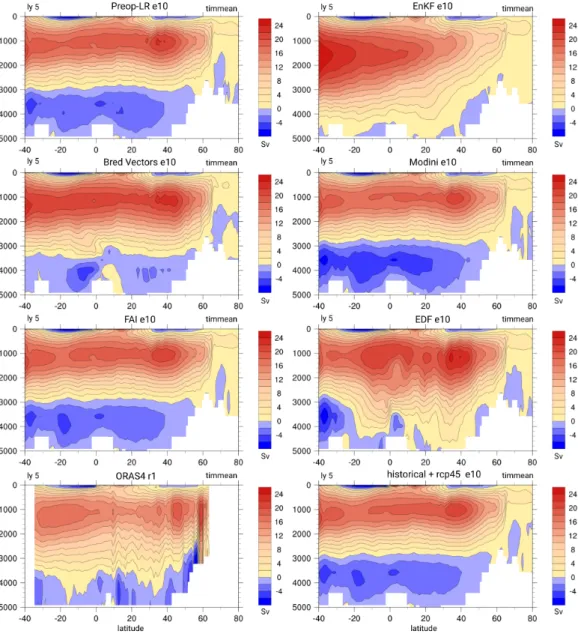
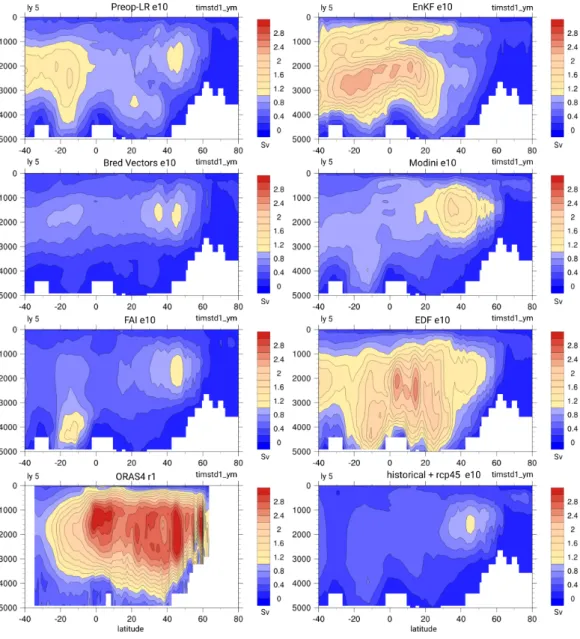
In Preop-LR, the AMOC cell has an expected structure: with a clear separation between the deep-water and the bottom-water cells (Figure S4). The BV and FAI show comparable to Preop-LR overturning cell patterns. The EnKF and the EDF shows ex- tended to the ocean bottom deep-water cell. In terms of the AMOC standard deviation (Figure S5), all the initialized hindcasts simulate reduced variability as compared to Preop- LR, most of them (Preop-LR, BV and FAI) even lower than what is shown by the his- torical simulation. In yr5, the EDF exhibits stronger variability than in Preop-LR, par- ticularly in the tropical North Atlantic. The EnKF shows high variability in the trop- ics. In BV, the variability pattern has a similar shape as in Preop-LR though somewhat
weaker. The FAI AMOC variability, apart from the latitudinal band around 40N, is about half as strong as in Preop-LR.
Additional Figures to Section “3.4 Ensemble Spread Performance”
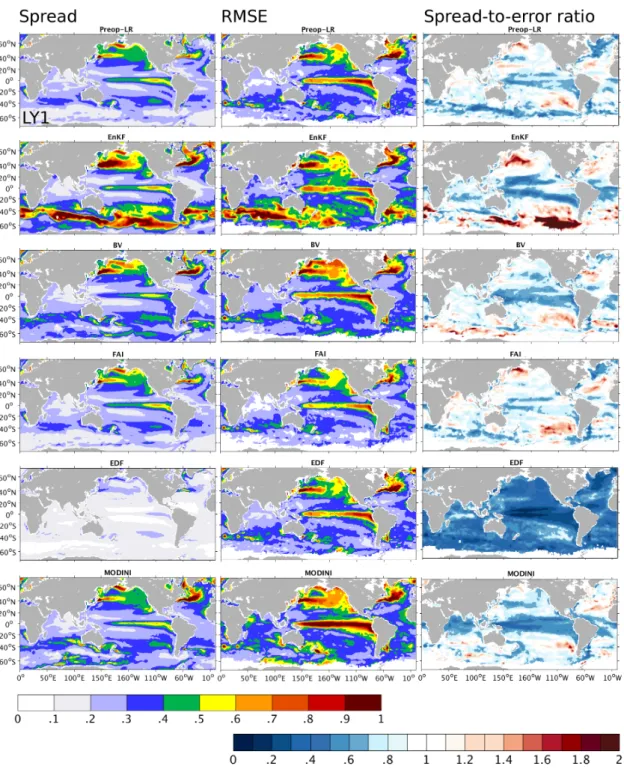
The spread-to-error diagnostic shown in Figure S6 suggests that Preop-LR and the test-suite largely underestimate the spread of surface temperature in the first lead year.
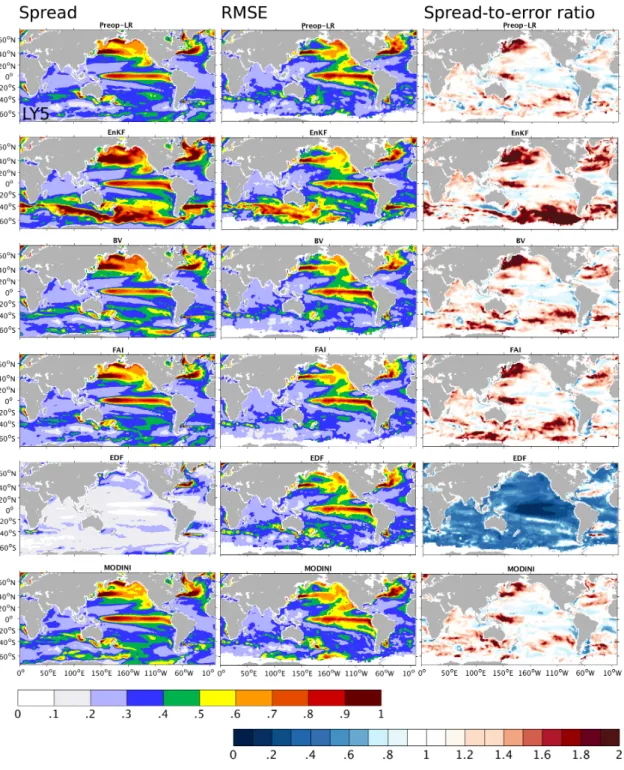
The advanced ensemble generation methods such as BV and EnKF improve the spread at this lead time. Also MODINI increases the spread in the first lead year . The EnKF seems to generate too large spread, especially in the extratropics. FAI does not have im- pact on the spread but has smaller RMSE. EDF by design reduces spread, but the RMSE is close to that of Preop-LR. For later leadtimes, the spread approaches the level of the errors; this feature is common to all the initialized hindcasts in the test-suite (lead year 5 in Figure S7). Note that ESS shown in the manuscript is equivalent to comparing en- semble variance and MSE, while Figures S6 and 7 compare ensemble spread and RMSE.
Also the ESS in the manuscript is calculated for the standardized variables, while the spread-to-error ratio not.
Figure S 1. Correlation skill for SAT w.r.t. HadCRUT4 for lead years 2-5 from Preop-LR (top left panel) and the test-suite experiments (first, second and third rows). Hindcasts initialized from 1960 to 2011 are evaluated. Stippling indicates significant correlation values as estimated with the bootstrap method at the 95% confidence level.
Figure S 2. MSESS for SAT w.r.t. the HadCRUT4 climatology for lead years 2-5 from Preop-LR (top left panel). MSESS for SAT w.r.t. Preop-LR for the test-suite experiments (first, second and third rows). Hindcasts initialized from 1960 to 2011 are evaluated. The range of MSESS is from -∞to +1. Stippling indicates significant MSESS values as estimated with the bootstrap method at the 95% confidence level.
Figure S 3. Time series of HC700 anomalies (1e+21 J) for the North Atlantic subpolar gyre from 5 lead years of the initialized hindcasts (blue) and the NOAA/NODC data (red). Shading represents the ensemble spread.
Figure S 4. Figure 14. The time mean of the Atlantic Meridional Overturning Circulation (in SV) from the initialized hindcasts in the 5th lead year.
Figure S 5. The standard deviation of the Atlantic Meridional Overturning Circulation (in SV) from the initialized hindcasts in the 5th lead year.
Figure S 6. SST spread (left panels, in degC), RMSE with respect to HadISST (middle
Figure S 7. SST spread (left panels, in degC), RMSE with respect to HadISST (middle panels, in degC) and spread-to-error-ratio (right panels) for lead year 5.
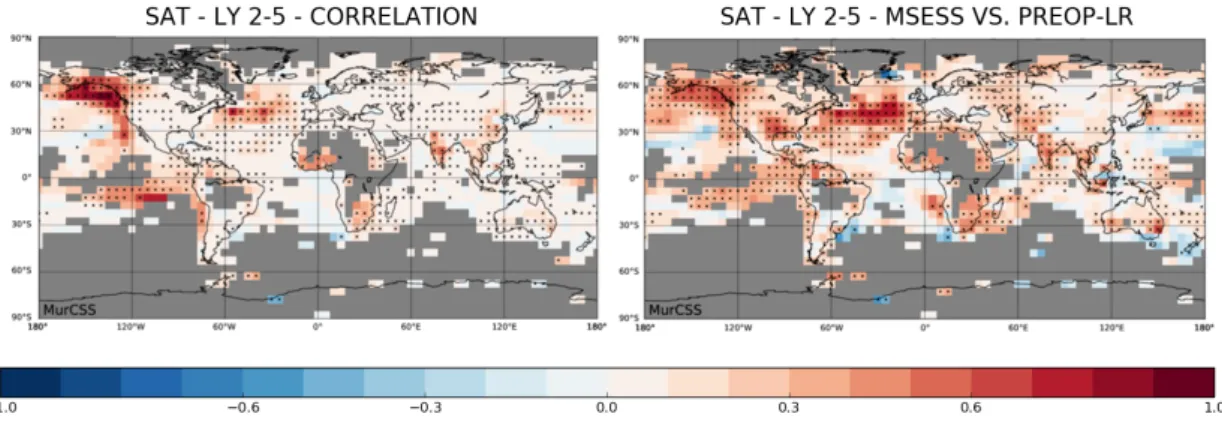
Figure S 8. Correlation skill difference between the multi-initialization ensemble mean and the Preop-LR (left) and MSESS w.r.t. Preop-LR (right) for SAT for lead years 2-5.