A T M O S P H E R I C S C I E N C E
White and wonderful? Microplastics prevail in snow from the Alps to the Arctic
Melanie Bergmann1*†, Sophia Mützel1†, Sebastian Primpke1, Mine B. Tekman1, Jürg Trachsel2, Gunnar Gerdts1
Microplastics (MPs) are ubiquitous, and considerable quantities prevail even in the Arctic; however, there are large knowledge gaps regarding pathways to the North. To assess whether atmospheric transport plays a role, we analyzed snow samples from ice floes in Fram Strait. For comparison, we investigated snow samples from remote (Swiss Alps) and populated (Bremen, Bavaria) European sites. MPs were identified by Fourier transform infrared imaging in 20 of 21 samples. The MP concentration of Arctic snow was significantly lower (0 to 14.4 × 10³ N liter−1) than European snow (0.19 × 10³ to 154 × 103 N liter−1) but still substantial. Polymer composition varied strongly, but varnish, rubber, polyethylene, and polyamide dominated overall. Most particles were in the smallest size range indicating large numbers of particles below the detection limit of 11 m. Our data highlight that atmospheric transport and deposition can be notable pathways for MPs meriting more research.
INTRODUCTION
Plastic pollution is a problem of growing environmental concern, be- cause production rates have increased to 380 million metric tons (MT) year−1 in 2015 (1), and annual waste production is projected to rise to 3.4 billion MT in the next 30 years (2). Many countries still have in- efficient waste management and water treatment systems allowing leakage to the environment (3), which is exacerbated by littering behavior. Mismanaged plastic waste could triple from 60 million to 99 million MT in 2015 to 155 to 265 million MT by 2060, assuming a business-as-usual scenario (4). In addition, plastic is designed to be durable. Therefore, it persists in the environment for long periods of time. Thus, it is hardly unexpected that plastic pollutants are ubiquitous and have been reported from environments close to urban centers, terrestrial areas, and freshwater environments, as well as from the shores of remote uninhabited islands, the sea surface, water column, and deep seafloor (5). Plastic pollutants have also reached polar regions including Arctic beaches (6), sea ice (7), water column (8), sea surface (9–12), and the seafloor (13). Under the influence of light, mechanic abrasion, waves, and temperature fluctuations, plastic items fragment into smaller particles and are termed microplastic (MP) when attaining sizes below 5 mm. Unexpectedly, Arctic surface waters turned out to harbor the highest MP concentrations in a global comparison of MP quantities, despite their remoteness (14).
In addition, litter quantities have increased significantly on the deep Arctic seafloor over the past 15 years as highlighted in a time-series study (13). This stimulated further research unveiling very high con- centrations of MPs in the sediment of the deep Fram Strait (15) and Arctic sea ice (16), prompting the question: “How do all these MPs make it so far to the north?”
One possibility is aerial transport since a yet still limited number of studies found MPs in atmospheric fallout of the cities Dongguan
(China) and Tehran (17, 18). In France, MP concentrations in atmospheric fallout increased fivefold after a rain event, indicating that wet deposition could be a pathway of MPs to Earth’s surfaces (19) including the oceans. Despite the limited research on airborne plastics, its importance is obvious given the precautions that have to be taken in studies on MPs to reduce the risk of contamination through airborne MPs (20). Further, airborne MPs represent a hitherto largely neglected route of exposure to humans and wildlife as these particles could be taken up through inhalation (21). Snow is a scav- enger for diverse impurities and acts as a filter on the ground by dry deposition (22, 23). Here, we sampled snow deposited on ice floes drifting in Fram Strait and on Svalbard to assess whether atmospheric fallout is a pathway of MPs to the Arctic environment. To enable comparisons with previous studies in the Arctic, harmonized auto- mated Fourier transform infrared (FTIR) imaging analysis was applied (15, 16, 24, 25). The Arctic is still widely conceived as one of the last pristine environments on the globe. To verify this view, we also assessed MP concentrations in snow close to more urban sites in northern Europe (Bremen City, Isle of Heligoland) and the Alps (Davos, Tschuggen, Bavaria) for comparison (Fig. 1).
RESULTS
MPs and microfibers were found in all but one snow samples, ranging from 0.02 × 10³ to 154 × 103 N liter−1 and 0.043 × 10³ to 10.2 × 10³ N liter−1, respectively (Fig. 2 and table S1). MPs accounted for 0 to 88% (mean, 12%) of the filtered particles. The material type of fibers, however, could not be determined because of the applied analysis pipeline. Therefore, fiber numbers comprise both synthetic and natural fibers. Nevertheless, we present fiber concentrations to enable comparison with previously published studies, which reported primarily fibers.
Fiber and MP quantities at different locations
MPs occurred at a mean concentration of 9.8 × 10³ N liter−1 (± SE 6.9 × 10³ N liter−1) with highest quantities detected in the sample Bavaria 2 (154 × 103 N liter−1), followed by Heligoland 2 (17.6 × 10³ N liter−1) and Ice Floe 9 (14.4 × 10³ N liter−1) (Fig. 1, A and B,
1Alfred-Wegener-Institut Helmholtz-Zentrum für Polar- und Meeresforschung, Am Handelshafen 12, Bremerhaven 27570, Germany. 2WSL Institute for Snow and Avalanche Research SLF, Flüelastrasse 11, 7260 Davos Dorf, Switzerland.
*Corresponding author. Email: melanie.bergmann@awi.de
†These authors contributed equally to this work as co-first authors.
Copyright © 2019 The Authors, some rights reserved;
exclusive licensee American Association for the Advancement of Science. No claim to original U.S. Government Works. Distributed under a Creative Commons Attribution NonCommercial License 4.0 (CC BY-NC).
on August 20, 2019http://advances.sciencemag.org/Downloaded from
and table S1). Snow from Europe contained significantly more MPs (24.6 ± 18.6 × 10³ N liter−1) than samples from ice floes (Mann-Whitney U test: W = 54, P = 0.011). Still, a mean of 1.76 ± 1.58 × 10³ N liter−1 is substantial for a secluded location such as the Arctic. Figure 3 illustrates images of MPs and fibers from different locations. Ice Floe 9 had a much higher MP concentration than the other Arctic snow samples, raising concern regarding the potential of contamination during sampling or from the helicopter used. Exclusion of this value decreases the mean to 0.18 ± 0.07 × 10³ N liter−1. Still, we think that this high level is unlikely due to contamination as varnish, the main polymer type detected, was not part of the equipment used and also present in high quantities in samples from Ice Floe 3, Bremen, the Alps, and Heligoland, where no helicopter was used. In addition, the sample Ice Floe 9 was taken outside the area likely to be affected by helicopter turbulence. Since the second highest MP abundance was detected on Heligoland at a time of strong winds (18 m s−1; table S2), we tested whether MP abundance was correlated with wind speed but found no significant correlation (Spearman’s rank correlation test: = −0.06, P = 0.80). However, wind direction may have played a role as the strong easterly winds may have transported particles from the neighboring dunes or from the mainland.
The maximum quantities of fibers were detected in snow from Ice Floe 4 (10.2 × 10³ N liter−1), followed by Heligoland 2 (2.75 ×
103 N liter−1) and Bavaria 3 (2.57 × 10³ N liter−1) (Fig. 1, A and B, and table S1). Still, overall, snow from Europe contained significantly more fibers (mean, 1.431 ± 0.325 × 10³ N liter−1) than samples from Arctic ice floes (Mann-Whitney U test: W = 96, P = 0.024), which had still a substantial mean (1.38 ± 1.10 × 10³ N liter−1) given their remoteness. Again, it could be argued that the exceptionally high fiber numbers from Ice Floe 4 may be due to contamination. Its exclusion would lead to a lower mean (0.28 ± 0.095 × 10³ N liter−1).
However, we deem this unlikely as Ice Floe samples 5 to 8 were taken on the same large ice floe by the same personnel, so contamination of these samples should be similarly high. There was no significant correlation between fiber abundance and wind speed (Spearman’s rank correlation test: = −0.17, P = 0.45). The abundance of fibers was positively correlated with MP abundance (Spearman’s rank cor- relation test: = 0.62, P = 0.002).
Size of MPs and fibers
The size of MPs detected ranged between 11 and 475 m. Eighty percent of all detected MPs were ≤25 m, and 98% of all particles were <100 m. Overall, the amount of particles decreased with increasing size (Fig. 2C) with no asymptote reached in the smallest detectable size class. Table S2 comprises the size distribution of individual samples.
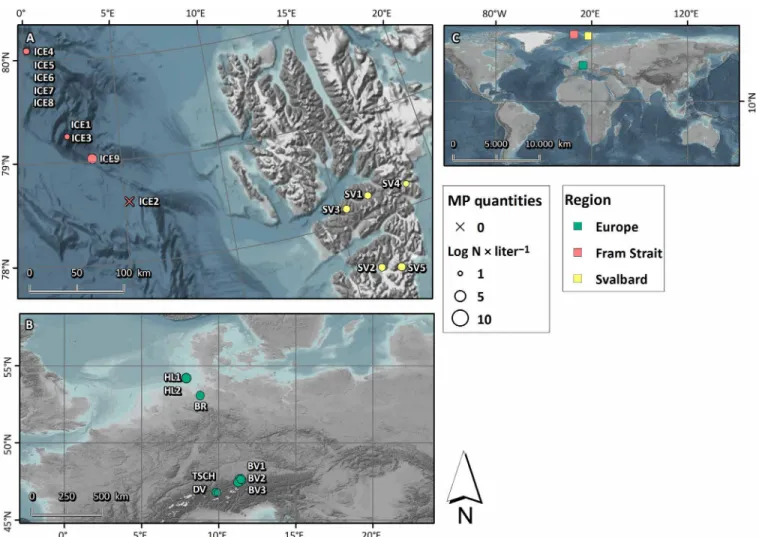
Fig. 1. Map of sampling locations for snow. (A) Sampling sites in the Arctic (ICE, ice floes; SV, Svalbard) and (B) in Europe (HL, Heligoland; BR, Bremen; BV, Bavaria; TSCH, Tschuggen; DV, Davos). (C) Overview of all locations. Size of circles reflects MP particle quantities at log scale. on August 20, 2019http://advances.sciencemag.org/Downloaded from
The length of fibers ranged between 65 and 14,314 m. While 97%
had a maximum length of 5 mm, 31% were shorter than 500 m. In general, the fibers show an increasing trend toward shorter lengths but are not saturated in the lowest size class (fig. S1). European fibers were significantly longer compared with those from Arctic snow (Mann- Whitney U test: W = 13,723, P = 0.0001) even if the two largest European fibers (14,314 and 13,704 m) were excluded. Table S3 includes the size information of individual fibers marked with their region of origin.
Material composition
The highest proportion of MPs in the total natural and synthetic particle load was found in snow from Ice Floe 1 (88%), followed by
Bavaria 2 (67%) and Ice Floe 9 (37%) (table S2). There was no significant difference in the proportion of MP particles from European and Arctic snow (Mann-Whitney U test: W = 170, P = 0.59). The composition varied considerably with 19 different polymer types found in total ranging between 2 (Ice Floe 4) and 12 types (Bavaria 2) per sample (Fig. 2D and table S1). The number of polymers per sample was significantly higher in European (mean, 8.63 ± 0.80) compared with Arctic (mean, 5.14 ± 0.79) samples (Mann-Whitney U test: W = 123, P = 0.013). Acrylates/
polyurethanes/varnish/lacquer (hereafter varnish) occurred most frequently (17 samples), followed by nitrile rubber (16 samples), polyethylene (PE), polyamide, and rubber type 3 (13; ethylene-propylene- diene rubber). The polymer composition of samples from Europe
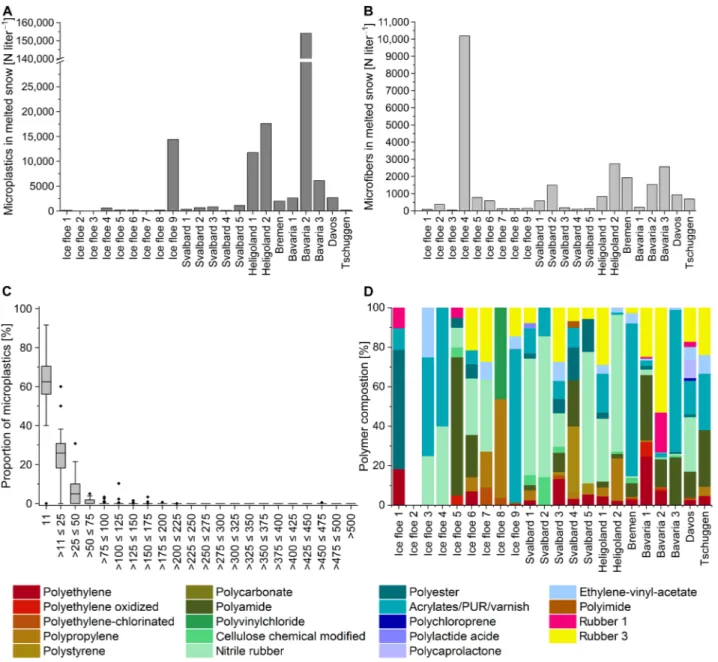
Fig. 2. Particles detected in snow samples collected at different locations from Europe to the Arctic. (A) MP particle quantities recorded by FTIR at different locations.
(B) Concentrations of microfibers detected at different locations (note that no polymers were identified). (C) Box-and-whiskers plot of proportions of MP numbers in different size classes from all snow samples. The upper and lower boundaries of the box indicate the 75th and 25th percentiles, respectively. The line within the box marks the median, error bars (in µm) indicate the 90th and 10th percentiles, and black diamonds represent outliers. (D) Relative composition of polymers identified by FTIR at different locations.
on August 20, 2019http://advances.sciencemag.org/Downloaded from
and the Arctic was significantly different [permutational multi- variate analysis of variance (PERMANOVA): pseudo-F = 2.43, P = 0.006]. The dissimilarity in the polymer composition from European and Arctic samples was 67% and caused primarily by much higher abundances of polyamide, varnish, rubber type 3, nitrile rubber, ethylene-vinyl-acetate, and PE in European sam- ples. By contrast, polystyrene, polyvinyl chloride (PVC), poly- carbonate, polylactic acid, and polyimide occurred exclusively in Arctic snow.
Other particles
Other particles detected in snow accounted for 22 to 100% of the total particles (table S2) and comprised chitin, charcoal, coal, animal fur, plant fibers, and sand. Except for coal, all of these were significantly more abundant in European snow (Mann-Whitney U test: W = 114, P = 0.0015), which also explains the significant differences found in their composition (PERMANOVA: pseudo-F = 7.75, P = 0.001).
Particles assigned to “plant fibers” and “animal fur” contributed most to the 46% dissimilarity [similarity percentage (SIMPER)].
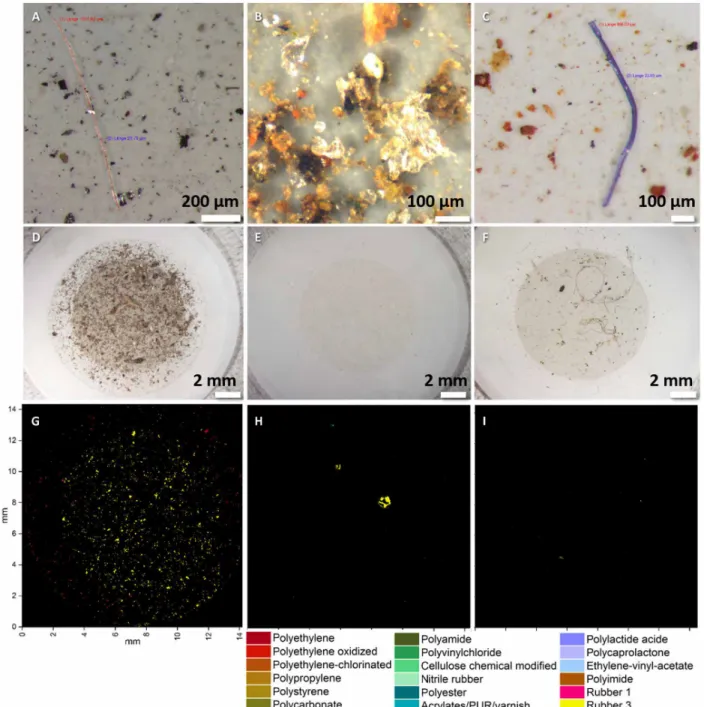
Fig. 3. Photographs of MPs detected in snow. (A) Polystyrene fiber from Svalbard 4 (length, 1101 m); (B) polypropylene particle from Heligoland (diameter, 256 m);
(C) polyvinyl chloride fiber from Ice Floe 8 (length, 956 m). Note that these particular two fibers could be analyzed by FTIR as they happened to lay plane on the filter.
(D to F) Aluminum oxide filter with enriched snow sample. (G to I) Corresponding polymer-dependent false-color image after FTIR measurement and automated anal- ysis. (D and G) Bavaria 2: The sample with most MPs; (E and H) Ice Floe 9: the sample with the third most MPs; (F and I) Bremen: The sample with intermediate MP numbers but many fibers (photo credit: S. Mützel, Alfred-Wegener-Institut Helmholtz-Zentrum für Polar- und Meeresforschung).
on August 20, 2019http://advances.sciencemag.org/Downloaded from
DISCUSSION
This study provides the first data on contamination of snow by MPs.
MP concentrations in snow were very high, indicating significant contamination of the atmosphere. During its passage through the atmosphere, snow binds airborne particles and pollutants, which are eventually deposited on Earth’s surfaces, a phenomenon termed
“scavenging” (22). Our data show that scavenging represents an important pathway of MPs to land and ocean environments in Europe and the Arctic. On the basis of annual snow fall data, we estimate an annual MP deposition of 8.8 ± 7.9 N m−2 (0 to 72 N m−2) in the Fram Strait, 1.4 ± 0.4 N m−2 in Svalbard (0 to 2 N m−2), and 66 ± 60.1 N m−2 (0 to 308 N m−2) in the Alps. It should be noted, however, that these estimates come with very large uncertainties given the variability of the data.
Abundance of MP particles and microfibers
Although MP levels were significantly higher in European (0.191 × 10³ to 154 × 103 N liter−1) compared with Arctic snow (0 to 14.4 × 10³ N liter−1), the conclusions drawn have to be treated with caution given the high variability and sparse spread of samples over large areas. Some variability may be due to the fact that snow from the Arctic was not freshly deposited unlike all European snow samples (except for Swiss snow) and could have been exposed to secondary dry deposition of airborne particles (23) for an unknown period of time. Still, the lower concentrations found in Arctic snow is not un- usual given the distance of the Arctic to densely populated source areas. MP concentrations were also consistently higher in atmospheric fallout from densely populated urban compared with suburban or less densely populated sites in France and Dongguan (18, 26). Dehghani et al.
(17) recorded MPs in the range of 3 to 20 N per gram of dry dust from Tehran. However, quantities are not directly comparable as wet deposition is a more efficient mode of transport than dry deposition (27), and different methods were used. The same applies to MPs recorded in dry fallout from Dongguan (31 to 43 N m−2 day−1) (18).
The highest MP concentration was found in Bavarian snow. Since we took this sample next to a country road, traffic could play a role in terms of automotive emissions, dispersion of settled MPs by cars, and sub sequent scavenging by falling snow. Experiments have shown that significant numbers of similar sized zinc sulfide particles placed on a road were swirled by cars (28). While the most abundant polymer types in this sample, rubber types 1 and 3, point to car tires as a potential source, no firm conclusions can be drawn because of current methodological constraints in the detection of specific rubber types.
Still, the number of MPs in snow from a street in the city of Bremen, our most urban site (~568,000 inhabitants), was only intermediate (2 × 10³ N liter−1). This could be due to lower particle dispersion as freshly deposited snow was collected on a Sunday when traffic is low. By contrast, the Bavarian sample was taken on a Monday with higher car traffic. Lonati et al. (29) reported a 20% lower emission of fine particles in Milano during weekends due to lower particle dispersion by decreased traffic. Snow from the North Sea island Heligoland ranked second and fourth highest (17.6 × 10³ N liter−1), which is unexpected considering that it is inhabited by only ~1200 people and cars are banned. Although there was no significant correlation between MP levels and wind speed overall, strong easterly winds (18 m s−1) prevailing before and during the sampling time may have dispersed MPs from the island’s dune environment and possibly also transported particles from seawater or the mainland.
The lowest European MP concentration was detected in a sample
from the Swiss Alps (0.19 × 10³ N liter−1). This could be considered background contamination as the site was neither urban nor close to traffic.
The MP levels in Arctic snow were still considerable with the third highest concentration (14.4 × 10³ N liter−1) originating from an ice floe. The magnitude difference between Ice Floe 9 and other ice floe samples is notable. Until we know more about atmospheric MP pollution, we can only speculate that atmospheric MP pollution may be variable in both time and space resulting in large differences of MPs falling out via snow. Local wind conditions may play a role.
In addition, Arctic ice floes are often carried from the Central Arctic to the south (i.e., Fram Strait) by the Transpolar Drift once the sea ice breaks up in spring (13, 16). During their drift, they may encounter different air masses carrying varying amounts of MP, which could cause the differences observed. Still, whatever the exact cause, it is unexpected given the remoteness of the location and poses the question
“Where does it all come from?” It is conceivable that airborne MPs are emitted or dispersed locally by ships and by wind. Snow from the Vladivostok district contained particles of marine origin, including sea urchins, algae, and mollusk shells (30). Still, most of the particles likely originate from more distant regions. To shine a light on the issue, we draw on knowledge of pathways of mercury, which is found in high concentrations in Arctic wildlife. A mass-balance approach indicates that wet deposition via snow is the main pathway of mercury to the Arctic ocean (31). Three main routes of transport lead to an accumulation of mercury in the Arctic: (i) The Icelandic Low and North American High transport air masses from north America and western Europe (40%), (ii) the Aleutian Low brings air masses from the north Pacific and east Asia (25%), and (iii) the Siberian High delivers eastern European and Siberian air masses (15%) to the Arctic (31). As with mercury, MPs may be blown over long distances to the Arctic from urban areas in all directions, leading to unexpectedly high levels of MP in the Arctic atmosphere. This is likely exacerbated during high phases of the North Atlantic Oscillation (32). Even large mineral particles (≤450 m) can be transported from the Sahara to the north Atlantic over distances of 3500 km by mechanisms such as rapid horizontal transport, turbulence, uplift in convective systems, and electrical levitation of particles (33). It has been estimated that pollen of willow and pine (10 to 200 m) were transported from western Europe to the Arctic at an altitude of 3000 m in only 5 days (34).
Comparison with MP levels in Arctic Sea ice and deep-sea sediments
Unfortunately, a direct comparison of our results on MP particles with previous data on airborne MPs or those from Arctic seawater is not possible as the latter two deal primarily with fibers (but see the “Abundance of fibers” section) or use different methods resulting in much lower numbers (9, 10, 35). We can, however, compare our results of Arctic ice floes with previous data on MPs in Arctic sea ice and deep-sea sediments (15, 16), also to investigate whether airborne MPs are a source to these compartments. These studies used the same harmonized analytical methods and are thus comparable with our approach. MP concentrations ranged between 1.1 × 10³ and 12 × 103 N liter−1 in Arctic sea ice, which tends to concentrate particles by a factor of 100 relative to adjacent seawater (16) and between 0.04 × 10³ and 3.46 × 10³ N liter−1 in deep-sea sediments (15). Given similar or higher levels in snow from ice floes (0 to 14.4 × 10³ N liter−1), it seems likely that they contribute to MPs in
on August 20, 2019http://advances.sciencemag.org/Downloaded from
sea ice and also sink to the seafloor over time. MPs deposited on ice floes via snow may be embedded directly into the sea ice matrix through snow metamorphism, i.e., compaction, or through release into melt ponds and subsequent refreezing. Another route to these matrices could simply be through wet deposition onto the ocean surface before or during sea ice formation. Once in seawater, MPs may sink to the seafloor. The composition of polymers in snow from ice floes seemed more similar to that of sea ice compared with deep-sea sediments. For example, varnish was one of the most frequent and abundant polymer types reported in both of these spheres but less important in sediments. Still, nitrile rubber and polyamide were important in both ice floe snow and deep-sea sediments and sea ice, such that these polymers may have been transported from the atmosphere to sea ice and the seafloor.
MP size
The size distribution of MPs in snow was unexpectedly similar to MP sizes found in Arctic sea ice and deep-sea sediments (15, 16). Most of the MPs detected in all of these spheres were in the smallest size range (11 m). Scrutinized by scanning electron microscopy, MP particles from atmospheric fallout of Dongguan revealed signs of weathering such that Cai et al. (18) hypothesized atmospheric degradation pro- cesses through collision and friction dynamics, as well as chemical weathering due to higher irradiation and oxygen levels in the atmo- sphere. This could enhance fragmentation into smaller sizes. The fact that there is no size saturation in the smallest size range implies that there may be yet more particles in size categories below our current detection limit. In addition, smaller particles are probably more likely to be picked up and transported by air masses. No matter what the cause, our results likely underestimate MP quantities as was also concluded in previous studies (15, 16, 36). This highlights the need to quantify small particles for realistic assessments of MP pollution.
Most studies currently focus on particles >200 to 300 m in size.
Abundance of fibers
All snow samples contained fibers ranging between 0.043 × 10³ and 10.2 × 10³ N liter−1 with highest concentrations in snow from Ice Floe 4 followed by snow from Bremen. While it is unknown what proportion of these were synthetic polymers, our fiber concentrations were at least four to seven orders of magnitude higher than previous reports from outdoor and indoor environments near Paris (median, 0.0009 and 0.0054 N liter−1, respectively) (36). Fiber and MP abun- dance in Dongguan were in the same order of magnitude as samples from Paris (18). This large discrepancy is likely due to methodological differences and differences in the underlying mechanisms, i.e., dry versus wet deposition. Dris et al. (19) reported five times higher MP levels after a rain event, and snow can scavenge aerosol particles up to 50 times more efficiently than rain (22). Whatever the reasons, the high abundance of fibers in remote Arctic snow is notable, whereas high levels in urban Bremen do not come as a surprise. The positive correlation between fiber and MP concentrations may indicate that they both come from similar sources. While 33% of the fibers detected near Paris were polymers, 23% of the fibers from Dongguan were made of plastic (18, 36). If 28% (the mean of these two values) of the fibers from our study were also polymers, then this would add 0.012 × 10³ to 2.86 × 10³ N liter−1 and result in a total MP load of 0.029 × 10³ to 156.86 × 10³ N liter−1. However, this assumption has to be treated with caution since the proportion of natural fibers in our samples may differ from those of more urban areas.
Polymer composition
The polymer composition of samples was very variable, even at sites which were located in close proximity, e.g., Ice Floe 4 to Ice Floe 8, that came from the same ice floe. Scavenging of particles depends on the size of snow crystals, particle size, wind speed, air humidity, and snow intensity (22, 37) to name a few of many factors that may have influenced also the polymer composition. Variable polymer composi- tions were also reported from Arctic sea ice and deep-sea sediments (15, 16). The number of polymer types found per sample was highest in Bavaria (12 types), which is not unusual given that this was also the sample with the highest MP abundance and sampled next to a country road where settled MPs may be subject to dispersion by traffic. The number of detected polymer types both per sample and for all samples was much higher in this study (19) compared with atmospheric fallout from China (4) and France (3) (18, 26). This is likely due to wet deposition scavenging effects and methodological differences, because previous results were based on the analysis of visually preselected particles and considered only particles larger than 50 m, which were also mostly fibers.
Varnish was the most frequent and among the top five most abundant polymer types. It was also detected in ice cores and deep-sea sediments albeit less frequently (15, 16). This reflects the widespread application of polymer-based varnish for protective coatings of surfaces, including vehicles, ships, wind turbines, aquaculture and buildings. The building sector accounts for ~20% of the European plastic converter demand (38). MPs may be emitted during construction on building sites, through abrasion of coated surfaces by wind and rain or when handling construction waste (39). Future research is needed to quantify the importance and pathway of this source of MPs.
Three different types of rubber were the next most frequent and the most abundant polymers. They may enter the environment as abrasion product from tires or as extremely durable synthetic rubber roofing membranes commonly used in roof construction (rubber type 3, ethylene-propylene-diene rubber). Abrasion from sealing gaskets (rubber type 1, sealing rubber), cable, and shoe soles could be further sources of rubber, some of which belong to the most common sources of MPs in Germany (39). While Arctic sea ice contained scant rubber particles, it was also found in deep-sea sediments (15, 16), where nitrile rubber was one of the most frequent and abundant polymers. As it is very resistant to a wide range of temperatures, as well as to oil, gasoline, and other chemicals, it is widely used for hoses, seals, O-rings, synthetic leather, grommets, cable jacketing, and transmission belts in offshore oil platforms and the automotive and aeronautical industry.
Polyamide (including nylon) was among the top five most frequent and abundant MPs detected. It was also reported from a household and atmospheric fallout in France (36). Polyamide is widely used in synthetic fabrics, automotive applications, fisheries, sails, toothbrushes, packaging, and carpets. It was more prevalent in European than in Arctic snow. Polyamide was, however, abundant in Atlantic and Arctic surface waters and deep-sea sediment (9, 10, 15, 16, 35, 40).
Thus, pathways other than atmospheric transport may play a more prominent role in the transport of polyamide to the Arctic.
Likewise, PE occurred only in low numbers in two ice floe samples but was the most abundant polymer type detected in Arctic sea ice and Atlantic surface waters (9, 16, 35, 40) and prevailed in most European samples, as well as in atmospheric fallout of Dongguan (18) and a French household (36). Again, mechanisms other than atmospheric transport may be more important in PE transport to the Arctic.
on August 20, 2019http://advances.sciencemag.org/Downloaded from
Health implications
The large concentrations of MPs and microfibers in snow highlight the importance of the atmosphere as a source of airborne MPs and microfibers. Through this pathway, MPs likely find their way into soil and aquatic environments and therefore also into food chains.
In populated areas, it is a common practice to remove snow from streets and transport it “away.” Our results show that these locations should be chosen wisely so as to avoid contamination of sensitive areas. Moreover, MPs in snow have fallen out of the atmosphere and could therefore be considered an indicator of aerial MP pollu- tion. This is relevant in the context of human and animal health, especially in terms of inhabited European sites, where residents may breathe in airborne MPs and fibers. However, although we know that airborne contamination of seafood during indoor food preparation and meals exceeds original MP concentrations (41), there has been unexpectedly little research about the inhalation risk of airborne MPs. It has been postulated that only the smallest-sized MP fraction is respired into the deep lung while particles exceeding a length of 5 m, with a diameter of <3 m, and with a length-to-diameter ratio of 3:1 are subject to coughing or mucociliary clearance (21) such that they end up in the gastrointestinal tract. Still, the detection of MPs and other fibers of up to 135 m in length in lung tissues, including carcinoma, challenges this notion (42, 43). MPs in pulmonary tissues may persist for a long time as they are durable in body fluids (21). Chronic inhalation of MPs, especially in combination with
adsorbed or added chemicals (17), may lead to health risks including respiratory irritation, allergic alveolitis, inflammation, fibrosis, and genotoxicity (21). Pauly et al. (42) suggest that MPs may be considered candidate agents contributing to the risk of lung cancer, especially of nonsmokers. The high MP concentrations detected in snow samples from continental Europe to the Arctic indicate significant air pollution and stress the urgent need for research on human and animal health effects focusing on airborne MPs.
The high amount of MPs present in the atmosphere as indicated by significant concentrations in snow from continental Europe to the Arctic is puzzling at first. It is known, however, that snow either takes up aerosols or forms around aerosol nuclei containing pollutants, e.g., from vehicle exhaust particles (44). In addition, dust emitted from Earth surfaces, deposition, and dispersion between atmosphere, land surface, and the aquatic realm could facilitate the transportation of MPs (18), but research is needed to verify this. One open question is also whether aquatic environments act as a source of MPs to the atmosphere, e.g., during evaporation and storm events. This could also explain the high concentrations of MPs and fibers in secluded uninhabited regions such as the Arctic. Another explanation is long- range transport by wind systems bringing anthropogenic particles from urban sites. Large dust particles are transported over distances of 3500 km from the Sahara to the North Atlantic (33). This is similar to the distance between our Arctic sites and Europe, which happens to be the most important pathway in terms of wind-driven transport
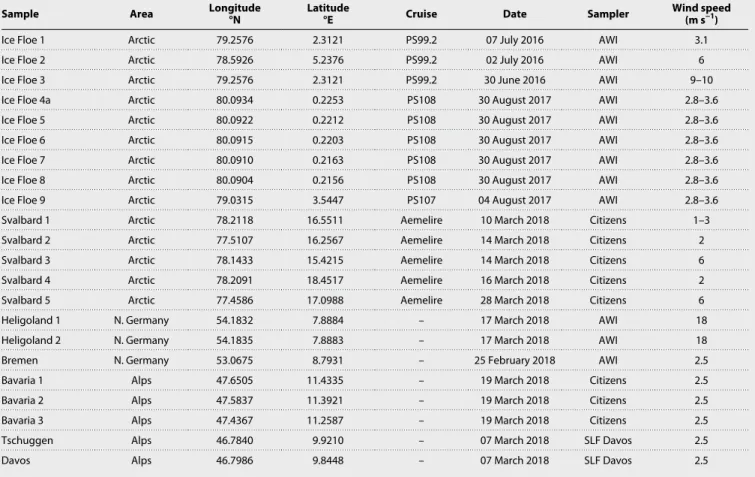
Table 1. Details of snow-sampling campaigns. AWI, Alfred-Wegener-Institut. Helmholtz-Zentrum fur Polar- und Meeresforschung; SLF Davos, WSL Institute for Snow and Avalanche Research.
Sample Area Longitude
°N Latitude
°E Cruise Date Sampler Wind speed
(m s−1)
Ice Floe 1 Arctic 79.2576 2.3121 PS99.2 07 July 2016 AWI 3.1
Ice Floe 2 Arctic 78.5926 5.2376 PS99.2 02 July 2016 AWI 6
Ice Floe 3 Arctic 79.2576 2.3121 PS99.2 30 June 2016 AWI 9–10
Ice Floe 4a Arctic 80.0934 0.2253 PS108 30 August 2017 AWI 2.8–3.6
Ice Floe 5 Arctic 80.0922 0.2212 PS108 30 August 2017 AWI 2.8–3.6
Ice Floe 6 Arctic 80.0915 0.2203 PS108 30 August 2017 AWI 2.8–3.6
Ice Floe 7 Arctic 80.0910 0.2163 PS108 30 August 2017 AWI 2.8–3.6
Ice Floe 8 Arctic 80.0904 0.2156 PS108 30 August 2017 AWI 2.8–3.6
Ice Floe 9 Arctic 79.0315 3.5447 PS107 04 August 2017 AWI 2.8–3.6
Svalbard 1 Arctic 78.2118 16.5511 Aemelire 10 March 2018 Citizens 1–3
Svalbard 2 Arctic 77.5107 16.2567 Aemelire 14 March 2018 Citizens 2
Svalbard 3 Arctic 78.1433 15.4215 Aemelire 14 March 2018 Citizens 6
Svalbard 4 Arctic 78.2091 18.4517 Aemelire 16 March 2018 Citizens 2
Svalbard 5 Arctic 77.4586 17.0988 Aemelire 28 March 2018 Citizens 6
Heligoland 1 N. Germany 54.1832 7.8884 – 17 March 2018 AWI 18
Heligoland 2 N. Germany 54.1835 7.8883 – 17 March 2018 AWI 18
Bremen N. Germany 53.0675 8.7931 – 25 February 2018 AWI 2.5
Bavaria 1 Alps 47.6505 11.4335 – 19 March 2018 Citizens 2.5
Bavaria 2 Alps 47.5837 11.3921 – 19 March 2018 Citizens 2.5
Bavaria 3 Alps 47.4367 11.2587 – 19 March 2018 Citizens 2.5
Tschuggen Alps 46.7840 9.9210 – 07 March 2018 SLF Davos 2.5
Davos Alps 46.7986 9.8448 – 07 March 2018 SLF Davos 2.5
on August 20, 2019http://advances.sciencemag.org/Downloaded from
of mercury to the Arctic. Our results highlight a hitherto neglected pathway of MPs to the Arctic Ocean, an ecosystem that is already stressed by the effects of the climate crisis.
MATERIALS AND METHODS Study sites
Between 2015 and 2017, five ice floes drifting in the Arctic Fram Strait were visited by ship-based helicopters or dinghies during three expeditions of the research icebreaker RV Polarstern (Fig. 1A and Table 1). Surface snow was sampled with a prerinsed mug, a steel spoon, or a soup ladle and transferred into containers made of PVC, PE, or glass (see table S2 for more details). In March 2018, five samples were taken at different locations on Svalbard (Fig. 1A and Table 1) by citizen scientists embarking on a land expedition by ski doo (Aemalire project). The citizens were instructed on contamination prevention and equipped with protocol forms, prerinsed 2-liter stainless steel containers (Ecotanca), a porcelain mug, a steel spoon, and a soup ladle for sampling.
In February 2018, the surface of freshly deposited snow was transferred with a spoon from parking cars in the city of Bremen into glass jars (Fig. 1B and Table 1). Only surface snow was taken, leaving behind a thin layer of snow on top of car surfaces. One month later, freshly deposited surface snow was collected with a soup ladle on the Isle of Heligoland from the backyard and next to a pedestrian path in front of the Alfred Wegener Institute campus (Fig. 1B and Table 1), avoiding soil and bottom surfaces. In the Swiss Alps, surface snow was collected with a spoon at a snowfield in the surroundings of Tschuggen and in the village of Davos (Fig. 1B). This snow had fallen 2 days before sampling (7 March 2018).
In the Bavarian Alps (Germany), citizens transferred freshly fallen surface snow with a steel spoon from three different locations into glass jars that had been prerinsed with tap water (Fig. 1B and Table 1): Sample 1 was taken next to a country lane, sample 2 was collected next to a country lane and a lake, and sample 3 was taken in a green area with nearby anthropogenic activity. All teams worked with bare hands, and the equipment was rinsed with Milli-Q water, tap water, or snow. Except for the Bavarian samples, potential sample contamination from the sealing of glass jars was minimized by a sheet of tin foil. Samples were kept frozen but defrosted during transport to Heligoland or in the laboratory.
Contamination prevention and procedural blanks
All personnel taking samples was instructed to position themselves against the wind and sample undisturbed snow in front of them with bare hands to avoid contamination. If not stated otherwise, all laboratory ware was made of glass or stainless steel and thoroughly rinsed with Milli-Q water before use. All polymer-based items, which could not be replaced by alternatives (e.g., bottle caps and filter holders) were made of polytetrafluoroethylene, a polymer that cannot be detected within the current FTIR imaging settings (25). Airborne particles were filtered by dustboxes (DB1000, G4 before filtration, HEPA-H14 final filtration, Q = 950 m3 hour−1, Möcklinghoff Lufttechnik) in laboratories for particle sorting and FTIR analyses.
All filtration steps were performed in a laminar flow cabinet (ScanLaf Fortuna, LaboGene). Cotton laboratory coats and clothes were worn to reduce contamination from synthetic textiles.
To account for possible contamination from plastic sample containers, two procedural blanks were created in the laboratory
by filling the PVC and PE containers used with Milli-Q water and stored at −20°C for 4 days to simulate the freezing and thawing process.
To assess possible contamination of the Bavarian snow samples from used tap water and the resin sealing in lids, a similar glass jar was filled with tap water and frozen by the citizen scientists. All blanks were processed in the same way as the snow samples. For the plastic containers, up to three FTIR imaging runs were performed because of low numbers found to obtain a reliable result, which represents the extent of MP contamination. No blanks were taken during field sampling. The amounts of MPs determined in the samples with available blanks were corrected by converting the quantity of MPs detected in the blank to the sample volumes (table S2). The number of particles per liter was calculated for each sample on the basis of the volume of melted snow. The polymer types, abundance, and sizes of MPs in procedural blanks are available in table S4.
Blanks from the PE container harbored 256 N liter−1 and consisted primarily of PE. The PVC flask contained 308 N liter−1, most of which was polypropylene and PVC. The glass jar that had been prerinsed with tap water contained the highest number of MP (27,243 N liter−1) with a diverse mix of polymer types, mostly PE and rubber types 1 and 3. To address the uncertainty of all results regarding possible contamination, the propagation of uncertainty was calculated (45) as described in note S1.
Analytical procedure for the detection of (MP) particles Following three overhead twists, an aliquot [10 ml: 1 ml of sample (melted snow) diluted with 9 ml of Milli-Q] of each sample was analyzed by FlowCam (Fluid Imaging Technologies, Scarborough, USA) three times to visualize and quantify particle concentrations and sizes and thereby a potential area coverage. On the basis of this assessment, a specific volume of the sample, ranging between 0.2 and 100% of the calculated volume for full area coverage, was filtered onto an aluminum oxide filter (Ø = 25 mm; pore size, 0.2 m; Anodisc, Whatman, Germany). This step is essential to avoid a particle overload of the filter, which would lead to a total absorption of subsequent measurement by FTIR radiation and error in the resulting particle counts. Despite this precaution, the membrane of eight snow samples became clogged during filtration such that it was stopped and the filtrated volume was recorded.
After drying in a desiccator for 2 days, the filter was placed onto the calcium fluoride window of an FTIR microscope, and an overview image was taken (×40 magnification). The particles on the filter were analyzed by a Hyperion 3000 FTIR microscope equipped with a focal plane array (FPA) detector with 64 × 64 detector elements and connected to a TENSOR 27 spectrometer (Bruker Optics GmbH, Germany). A visible objective (×4 magnification) and an infrared (IR) objective (×3.5 magnification) along with an IR range of 3600 to 1250 cm−1 was used for measurements performed with the software OPUS 7.5 (Bruker Optics). The measurement area of 20 × 20 FPA (14.1 by 14.1 mm) fields comprised the entire sample-filter surface and produced measurements of 400 single fields. Measurements were performed by a 3.5× IR objective in a transmission mode with 32 scans per FPA field without binning at a resolution of 8 cm−1, allowing the detection of particles down to 11 m in ~4.5 hours.
Detection of fibers
Because of the design of the particle analysis pipeline during FTIR image analysis, fibers can currently not be identified reliably with
on August 20, 2019http://advances.sciencemag.org/Downloaded from
this automated method. Still, to enable comparison with previous studies, the fibers present on each filter were counted and photo- graphed using a stereomicroscope (×8 magnification; Olympus SZX16). The total number of fibers per filter was extrapolated to 1 liter of melted snow. The total number of fibers found in the blanks (n = 83) was subtracted from the sample results. In addition, the length of fibers of suspected anthropogenic origin was measured using CellSens Micro Imaging tools (×8 to ×32 magnification;
Olympus, Germany).
Data analysis
The FTIR imaging data were automatically processed (24). Briefly, each spectrum in the measurement file was analyzed via two library searches to confirm polymer identity using an adaptable database design (25). The library can be downloaded (https://link.springer.
com/article/10.1007/s00216-018-1156-x). Each pixel identified was stored with its position, analysis quality, and, finally, assigned polymer type into a file, which was subject to image analysis based on Python 3.4 scripts and SimpleITK functions (24). This approach enabled the identification, quantification, and size determination of all polymer particles while excluding human bias (24). MP particles were assigned to size classes to reduce the complexity of the size distribution and for comparison with previous studies.
All statistical comparisons were made based on nonparametric statistics (Mann-Whitney U test, Minitab 18, Statistica 13). We tested for Spearman’s rank correlations between wind speed on the sampling day and MP quantity, as well as correlations between MP and fiber concentrations (Minitab 18; P > 0.05). The polymer composition of samples from Europe and the Arctic was compared by multivariate analyses (PERMANOVA, PRIMER-e version 6.1.16 with PERMANOVA 1.0.6) based on Bray-Curtis similarities of fourth-root transformed data of polymer types (46). The SIMPER routine of PRIMER-e was used to assess what polymer type contributed to the dissimilarity.
The annual MP and fiber fallout was calculated for the areas sampled using mean annual snowfall values for Fram Strait [200 kg m−2 (47)], Svalbard [450 kg m−2 (48)], and Davos [500 kg m−2 (49)]
as tentative estimates for MP and fiber deposition rates via snow.
Bremen and Heligoland were not included because snow fall in these regions is ephemeral. The density of melted snow samples was assumed as water density (1 kg liter−1).
SUPPLEMENTARY MATERIALS
Supplementary material for this article is available at http://advances.sciencemag.org/cgi/
content/full/5/8/eaax1157/DC1
Fig. S1. Length frequency (%) of microfibers found in Arctic and European snow.
Note S1. Calculation of propagation of uncertainty of results regarding possible contamination.
Table S1. Concentration of MPs, fibers polymer types, and other particles detected in snow samples.
Table S2. Concentration of MPs, fibers, polymer types, and other particles detected in snow samples as well as size frequency distribution and metadata.
Table S3. Number, size, and color of fibers measured in Arctic and European snow samples.
Table S4. Concentration, composition, and size of MPs detected in blank samples.
REFERENCES AND NOTES
1. R. Geyer, J. R. Jambeck, K. L. Law, Production, use, and fate of all plastics ever made.
Sci. Adv. 3, e1700782 (2017).
2. K. Silpa, L. Yao, P. Bhada-Tata, F. Van Woerden, What a Waste 2.0: A Global Snapshot of Solid Waste Management to 2050 (Urban Development, The World Bank, 2018).
3. J. R. Jambeck, R. Geyer, C. Wilcox, T. R. Siegler, M. Perryman, A. Andrady, R. Narayan, K. L. Law, Plastic waste inputs from land into the ocean. Science 347, 768–771 (2015).
4. L. Lebreton, A. Andrady, Future scenarios of global plastic waste generation and disposal.
Palgrave Commun. 5, 6 (2019).
5. M. Bergmann, M. B. Tekman, L. Gutow, Marine litter: Sea change for plastic pollution.
Nature 544, 297 (2017).
6. M. Bergmann, B. Lutz, M. B. Tekman, L. Gutow, Citizen scientists reveal: Marine litter pollutes Arctic beaches and affects wild life. Mar. Pollut. Bull. 125, 535–540 (2017).
7. R. W. Obbard, S. Sadri, Y. Q. Wong, A. A. Khitun, I. Baker, R. C. Thompson, Global warming releases microplastic legacy frozen in Arctic Sea ice. Earths Future 2, 315–320 (2014).
8. B. E. Grøsvik, T. Prokhorova, E. Eriksen, P. Krivosheya, P. A. Horneland, D. Prozorkevich, Assessment of marine litter in the Barents Sea, a part of the Joint Norwegian–Russian Ecosystem Survey. Front. Mar. Sci. 5, 72 (2018).
9. A. L. Lusher, V. Tirelli, I. O’Connor, R. Officer, Microplastics in Arctic polar waters: The first reported values of particles in surface and sub-surface samples. Sci. Rep. 5, 14947 (2015).
10. L. D. K. Kanhai, K. Gårdfeldt, O. Lyashevska, M. Hassellöv, R. C. Thompson, I. O'Connor, Microplastics in sub-surface waters of the Arctic Central Basin. Mar. Pollut. Bull. 130, 8–18 (2018).
11. M. Bergmann, N. Sandhop, I. Schewe, D. D’Hert, Observations of floating anthropogenic litter in the Barents Sea and Fram Strait, Arctic. Polar Biol. 39, 553–560 (2016).
12. A. Cózar, E. Martí, C. M. Duarte, J. García-de-Lomas, E. van Sebille, T. J. Ballatore, V. M. Eguíluz, J. I. González-Gordillo, M. L. Pedrotti, F. Echevarría, R. Troublè, X. Irigoien, The Arctic Ocean as a dead end for floating plastics in the North Atlantic branch of the Thermohaline Circulation. Sci. Adv. 3, e1600582 (2017).
13. M. B. Tekman, T. Krumpen, M. Bergmann, Marine litter on deep Arctic seafloor continues to increase and spreads to the North at the HAUSGARTEN observatory. Deep Sea Res. Part I 120, 88–99 (2017).
14. A. P. W. Barrows, S. E. Cathey, C. W. Petersen, Marine environment microfiber contamination: Global patterns and the diversity of microparticle origins. Environ. Pollut.
237, 275–284 (2018).
15. M. Bergmann, V. Wirzberger, T. Krumpen, C. Lorenz, S. Primpke, M. B. Tekman, G. Gerdts, High quantities of microplastic in Arctic deep-sea sediments from the HAUSGARTEN Observatory. Environ. Sci. Technol. 51, 11000–11010 (2017).
16. I. Peeken, S. Primpke, B. Beyer, J. Gütermann, C. Katlein, T. Krumpen, M. Bergmann, L. Hehemann, G. Gerdts, Arctic sea ice is an important temporal sink and means of transport for microplastic. Nat. Commun. 9, 1505 (2018).
17. S. Dehghani, F. Moore, R. Akhbarizadeh, Microplastic pollution in deposited urban dust, Tehran metropolis, Iran. Environ. Sci. Pollut. Res. 24, 20360–20371 (2017).
18. L. Cai, J. Wang, J. Peng, Z. Tan, Z. Zhan, X. Tan, Q. Chen, Characteristic of microplastics in the atmospheric fallout from Dongguan city, China: Preliminary research and first evidence. Environ. Sci. Pollut. Res. 24, 24928–24935 (2017).
19. R. Dris, J. Gasperi, V. Rocher, M. Saad, N. Renault, B. Tassin, Microplastic contamination in an urban area: A case study in Greater Paris. Environ. Chem. 12, 592–599 (2015).
20. L. C. Woodall, C. Gwinnett, M. Packer, R. C. Thompson, L. F. Robinson, G. L. J. Paterson, Using a forensic science approach to minimize environmental contamination and to identify microfibres in marine sediments. Mar. Pollut. Bull. 95, 40–46 (2015).
21. J. Gasperi, S. L. Wright, R. Dris, F. Collard, C. Mandin, M. Guerrouache, V. Langlois, F. J. Kelly, B. Tassin, Microplastics in air: Are we breathing it in? Curr. Opin. Environ.
Sci. Health 1, 1–5 (2018).
22. S. Zhao, Y. Yu, J. He, D. Yin, B. Wang, Below-cloud scavenging of aerosol particles by precipitation in a typical valley city, northwestern China. Atmos. Environ. 102, 70–78 (2015).
23. J. Heintzenberg, M. Rummukainen, Airborne particles in snow. J. Glaciol. 39, 239–244 (1993).
24. S. Primpke, C. Lorenz, R. Rascher-Friesenhausen, G. Gerdts, An automated approach for microplastics analysis using focal plane array (FPA) FTIR microscopy and image analysis. Anal. Methods 9, 1499–1511 (2017).
25. S. Primpke, M. Wirth, C. Lorenz, G. Gerdts, Reference database design for the automated analysis of microplastic samples based on Fourier transform infrared (FTIR) spectroscopy.
Anal. Bioanal. Chem. 410, 5131–5141 (2018).
26. R. Dris, J. Gasperi, M. Saad, C. Mirande, B. Tassin, Synthetic fibers in atmospheric fallout:
A source of microplastics in the environment? Mar. Pollut. Bull. 104, 290–293 (2016).
27. M. Uematsu, R. A. Duce, J. M. Prospero, Deposition of atmospheric mineral particles in the North Pacific Ocean. J. Atmos. Chem. 3, 123–138 (1985).
28. G. A. Sehmel, Particle resuspension from an asphalt road caused by car and truck traffic.
Atmos. Environ. 7, 291–309 (1973).
29. G. Lonati, M. Giugliano, S. Cernuschi, The role of traffic emissions from weekends’
and weekdays’ fine PM data in Milan. Atmos. Environ. 40, 5998–6011 (2006).
30. K. S. Golokhvast, Airborne biogenic particles in the snow of the cities of the russian far east as potential allergic compounds. J Immunol Res 2014, 7 (2014).
31. P. M. Outridge, R. W. Macdonald, F. Wang, G. A. Stern, A. P. Dastoor, A mass balance inventory of mercury in the Arctic Ocean. Environ. Chem. 5, 89–111 (2008).
32. S. Eckhardt, A. Stohl, S. Beirle, N. Spichtinger, P. James, C. Forster, C. Junker, T. Wagner, U. Platt, S. G. Jennings, The North Atlantic Oscillation controls air pollution transport to the Arctic. Atmos. Chem. Phys. 3, 1769–1778 (2003).
on August 20, 2019http://advances.sciencemag.org/Downloaded from
33. M. van der Does, P. Knippertz, P. Zschenderlein, R. Giles Harrison, J.-B. W. Stuut, The mysterious long-range transport of giant mineral dust particles. Sci. Adv. 4, eaau2768 (2018).
34. D.-D. Rousseau, D. Duzer, J.-L. Etienne, G. Cambon, D. Jolly, J. Ferrier, P. Schevin, Pollen record of rapidly changing air trajectories to the North Pole. J. Geophys. Res. Atmos. 109, D06116 (2004).
35. S. Morgana, L. Ghigliotti, N. Estévez-Calvar, R. Stifanese, A. Wieckzorek, T. Doyle, J. S. Christiansen, M. Faimali, F. Garaventa, Microplastics in the Arctic: A case study with sub-surface water and fish samples off Northeast Greenland. Environ. Pollut. 242, 1078–1086 (2018).
36. R. Dris, J. Gasperi, C. Mirande, C. Mandin, M. Guerrouache, V. Langlois, B. Tassin, A first overview of textile fibers, including microplastics, in indoor and outdoor environments.
Environ. Pollut. 221, 453–458 (2017).
37. L. Yuyan, F. Bo, S. Yaxing, W. Ting, Z. H. L. Zhizhong, Scavenging of atmospheric particulates by snow in Changji, China. Global NEST J. 20, 471–476 (2018).
38. PlasticsEurope, Plastics-the Facts 2018 (PlasticsEurope, 2018).
39. J. Bertling, R. Bertling, L. Hamann, Kunststoffe in der Umwelt: Mikro- und Makroplastik.
Ursachen, Mengen, Umweltschicksale, Wirkungen, Lösungsansätze, Empfehlungen, (Frauenhofer-Institut für Umwelt-, Sicherheits- und Energietechnik UMSICHT, 2018).
40. K. Enders, R. Lenz, C. A. Stedmon, T. G. Nielsen, Abundance, size and polymer composition of marine microplastics ≥ 10 m in the Atlantic Ocean and their modelled vertical distribution. Mar. Pollut. Bull. 100, 70–81 (2015).
41. A. I. Catarino, V. Macchia, W. G. Sanderson, R. C. Thompson, T. B. Henry, Low levels of microplastics (MP) in wild mussels indicate that MP ingestion by humans is minimal compared to exposure via household fibres fallout during a meal. Environ. Pollut. 237, 675–684 (2018).
42. J. L. Pauly, S. J. Stegmeier, H. A. Allaart, R. T. Cheney, P. J. Zhang, A. G. Mayer, R. J. Streck, Inhaled cellulosic and plastic fibers found in human lung tissue. Cancer Epidemiol.
Biomark. Prev. 7, 419–428 (1998).
43. J. C. Pimentel, R. Avila, A. G. Lourenço, Respiratory disease caused by synthetic fibres:
a new occupational disease. Thorax 30, 204–219 (1975).
44. Y. Nazarenko, S. Fournier, U. Kurien, R. B. Rangel-Alvarado, O. Nepotchatykh, P. Seers, P. A. Ariya, Role of snow in the fate of gaseous and particulate exhaust pollutants from gasoline-powered vehicles. Environ. Pollut. 223, 665–675 (2017).
45. M. Haave, C. Lorenz, S. Primpke, G. Gerdts, Different stories told by small and large microplastics in sediment - first report of microplastic concentrations in an urban recipient in Norway. Mar. Pollut. Bull. 141, 501–513 (2019).
46. M. J. Anderson, D. C. I. Walsh, PERMANOVA, ANOSIM, and the Mantel test in the face of heterogeneous dispersions: What null hypothesis are you testing? Ecol. Monogr. 83, 557–574 (2013).
47. J.-C. Gallet, I. Merkouriadi, G. E. Liston, C. Polashenski, S. Hudson, A. Rösel, S. Gerland, Spring snow conditions on Arctic sea ice north of Svalbard, during the Norwegian Young Sea ICE (N-ICE2015) expedition. J. Geophys. Res. Atmos. 122, 10820–10836 (2017).
48. J.-G. Winther, O. Bruland, K. Sand, S. Gerland, D. Marechal, B. Ivanov, P. Gøowacki, M. König, Snow research in Svalbard—An overview. Polar Res. 22, 125–144 (2003).
49. C. Marty, GCOS SWE data from 11 stations in Switzerland. WSL Institute for Snow and Avalanche Research SLF. doi:10.16904/15 (2017).
Acknowledgments: We gratefully acknowledge the principal scientists and crews and of RV Polarstern cruises (PS93.2, PS99.2, PS107, and PS108), as well as helicopter crews. We thank S. Flögel (GEOMAR); J. Hagemann, M. Huchler, M. Kaess, J. Lemburg, N. Lochthofen, J. Ludszuweit, J. Rapp, D. Scholz, and M. Spill (AWI); M. Schneebeli and M. Jaggi (SLF Davos);
and K. Mützel and K. Wocher (citizens) for sampling snow. Snow from Svalbard was collected within the citizen-science project Aemelire by K. Müller (RIS-ID 10992). We thank M. Egger and three anonymous reviewers whose comments improved an earlier version of the manuscript.
This publication is Eprint ID 49092 of the Alfred-Wegener-Institut Helmholtz-Zentrum für Polar- und Meeresforschung. Funding: This work was supported by the German Federal Ministry of Education and Research (Project BASEMAN—Defining the baselines and standards for microplastics analyzes in European waters; BMBF grant 03F0734A) and the PACES (Polar Regions and Coasts in a Changing Earth System) program of the Helmholtz Association and contributes to the Pollution Observatory of the Helmholtz Association–funded program FRAM (Frontiers in Arctic Marine Research). Author contributions: M.B. and G.G. designed the study.
S.M. and S.P. analyzed snow samples. S.P. and M.B.T. provided figures. G.G. and M.B. conducted statistical tests. M.B.T., J.T., and M.B. took samples. M.B. wrote the manuscript with
contributions from all coauthors. Competing interests: The authors declare that they have no competing interests. Data and materials availability: All data needed to evaluate the conclusions in the paper are present in the paper and/or the Supplementary Materials. All data was additionally stored in the Pangaea respository via https://doi.org/10.1594/
PANGAEA.901447. All the samples, analyses, publications, and ownership of data are free from legal entanglement or restriction of any sort by the various nations whose snow was sampled.
Submitted 22 February 2019 Accepted 3 July 2019 Published 14 August 2019 10.1126/sciadv.aax1157
Citation: M. Bergmann, S. Mützel, S. Primpke, M. B. Tekman, J. Trachsel, G. Gerdts, White and wonderful? Microplastics prevail in snow from the Alps to the Arctic. Sci. Adv. 5, eaax1157 (2019).
on August 20, 2019http://advances.sciencemag.org/Downloaded from
DOI: 10.1126/sciadv.aax1157 (8), eaax1157.
5 Sci Adv
ARTICLE TOOLS http://advances.sciencemag.org/content/5/8/eaax1157
MATERIALS
SUPPLEMENTARY http://advances.sciencemag.org/content/suppl/2019/08/12/5.8.eaax1157.DC1
REFERENCES
http://advances.sciencemag.org/content/5/8/eaax1157#BIBL This article cites 45 articles, 6 of which you can access for free
PERMISSIONS http://www.sciencemag.org/help/reprints-and-permissions
Terms of Service Use of this article is subject to the
registered trademark of AAAS.
is a Science Advances Association for the Advancement of Science. No claim to original U.S. Government Works. The title
York Avenue NW, Washington, DC 20005. 2017 © The Authors, some rights reserved; exclusive licensee American (ISSN 2375-2548) is published by the American Association for the Advancement of Science, 1200 New Science Advances
on August 20, 2019http://advances.sciencemag.org/Downloaded from