Research Collection
Working Paper
Does ICT Affect the Demand for Vocationally Educated Workers in Switzerland?
Author(s):
Pusterla, Filippo; Renold, Ursula Publication Date:
2020-11
Permanent Link:
https://doi.org/10.3929/ethz-b-000452743
Rights / License:
In Copyright - Non-Commercial Use Permitted
This page was generated automatically upon download from the ETH Zurich Research Collection. For more information please consult the Terms of use.
Chair of Education Systems
CES Working Paper Series
Does ICT Affect the Demand for Vocationally Educated Workers in Switzerland?
Filippo Pusterla & Ursula Renold CES Working Paper, No. 1, 2020
Does ICT Affect the Demand for
Vocationally Educated Workers in Switzerland?
*Filippo Pusterla & Ursula Renold‡ November 24, 2020
Abstract
This paper examines the effect of information and communication technologies (ICT) on the de- mand for workers in Switzerland. We compare the hypotheses that an increase in ICT leads to either upskilling or job polarization, and investigate their implications for countries with a diffuse vocational education and training (VET) system. Using data from a large employer-employee sur- vey, we create a novel measure of ICT based on the percentage of ICT workers within firms. This measure allows us to assess the impact of ICT on the educational composition of the workforce by exploiting variation over time. We find that ICT has an upskilling effect from 1996 to 2018: ICT decreases the demand for low-skilled workers while increasing the demand for high-skilled workers, especially those with a tertiary vocational education. These results strongly suggest that VET is a valid alternative to a strictly academic education, because workers with a tertiary VET degree are as good at adjusting to technological change—and sometimes even superior to—workers with a tertiary academic education.
JEL-Classification: E24, J24, O33
Keywords: labor demand, skill-biased technical change, job polarization, information and com- munication technologies, vocational education and training.
*Acknowledgments: This study is partly funded by the Swiss State Secretariat for Education, Research, and Innovation. We thank the Swiss Federal Office of Statistics for providing the data. We are grateful for helpful comments from Thomas Bolli.
‡ETH Zurich, MTEC Department, Chair of Education Systems, Leonhardstrasse 21, 8092 Zurich, Switzerland.
Corresponding address: filippo.pusterla@mtec.ethz.ch
1 Introduction
The expansion of information and communication technologies (ICT) is one of the most im- portant trends in industrialized countries. The disappearance of occupations and employment resulting from an increase in ICT-based technologies such as automation and robotics has be- come a hotly debated subject in the media and among policymakers. Researchers even try to predict which occupations will become obsolete and how large the displacement effect on employment will be (e.g., Frey & Osborne, 2017).
The debate over the influence of technological change on labor has long been dominated by the skill-biased technical change (SBTC) hypothesis, which posits that technological develop- ment favors highly skilled occupations (Katz & Murphy, 1992). SBTC, also known as upskilling, implies a shift in labor demand from low-skilled to high-skilled workers. Nonetheless, the impli- cations of this hypothesis were partially contradicted by studies from the United States (Autor et al., 2006) and the United Kingdom (Goos & Manning, 2007), both of which showed that em- ployment growth mainly occurred in both low- and high-skilled occupations while decreasing in the middle of the distribution. Goos & Manning (2007) define this phenomenon—which Autor et al. (2003) had earlier linked to the routinization of jobs—as job polarization.
Nonetheless, US studies may be biased, because they presuppose a certain educational sys- tem that does not necessarily apply to other countries. Indeed, despite a growing number of studies on labor market polarization and the routinization of jobs, evidence is scarce for the effect of technological change on labor demand in countries where most workers have a voca- tional education and training (VET) diploma or a professional education and training (PET) degree.1 Furthermore, some researchers argue that VET graduates are theoretically at a dis- advantage in adjusting to technological change (e.g., Krueger & Kumar, 2004; Hanushek et al., 2017). However, evidence of the effect of technological change on the demand for VET workers is relatively scarce, and the little research that exists is contradictory.
This study extends current knowledge about the impact of ICT on the demand for workers with VET. Our analysis draws on data from 1996 to 2018 in the Swiss Earnings Structure Survey (SESS), a biannual survey of firms, conducted in Switzerland. To capture the extent of ICT in a firm, we create a novel measure of ICT based on the percentage of ICT workers within firms.
We subdivide workers into six groups, according to their highest educational level. In addition
1We use the terms VET and PET for education programs that prepare students for labor market entry in specific occupations or trades.
to academic university graduates, high school graduates, and untrained workers, we consider workers with upper-secondary VET, workers with tertiary PET degrees (Federal Diploma of Higher Education or Advanced Federal or Diploma of Higher Education), and workers who have graduated from a University of Applied Sciences (UAS) (bachelor-granting three-year colleges teaching and conducting applied research). Analyzing six education groups allows a fine-grained analysis of differences between types of education.
To assess the effect of ICT on the demand for education, we use quantitative regression analysis. We estimate equations that explain the percentage of employees with a particular education level by the extent of ICT in the firm. To account for firms’ unobserved heterogene- ity, we apply pseudo-panel methods in our estimations. We include region*time fixed effects, which allow us to capture changes in labor supply, and also control for firm size and workers’
characteristics.
Our results suggest that ICT has an upskilling effect during the 1996–2018 period. Specifi- cally, we find evidence that ICT increases the demand for high-skilled workers while decreasing the demand for low-skilled ones. Our results further suggest that the upskilling effect is larger for firms in the manufacturing sector than for those in the service sector. For firm size, our estimates indicate some polarizing effect of ICT in large firms but an upskilling effect in small- and medium-sized ones.
As for our data, a limitation of this study needs stating from the outset. Our analysis is based on two different proxies for ICT occupations: one for 1996–2010 and the other one for 2012 onward. Although we provide evidence for the similarity of these two measures, we cannot completely rule out the possibility that the different results we find for the two periods can partly be linked to these two different proxies.
The contribution of our paper is threefold. First, we create a novel measure of ICT based on the percentage of ICT workers within firms, a measure easily transferable to other countries or different datasets. Second, we provide new evidence of the effects of ICT on the labor market in Switzerland. While most of the literature focuses on the US labor market, we contribute to the debate about the effect of ICT in a European country. Third, by focusing on a fine-grained distinction among workers’ educations, we also contribute to the literature on the adaptability of VET-educated workers to technological change (e.g., Hanushek et al., 2017). Our study shows that the expansion of ICT increases the demand not only for tertiary academic workers but also for workers with a PET degree and particularly those with a degree from a UAS. This finding
suggests that both PET and UAS tertiary degrees constitute a valid alternative to academic university education. Distinguishing among these three types of highest education level is particularly valuable for many European countries—such as Austria, Denmark, Germany, and Switzerland—where the majority of workers enter the labor market with an upper-secondary VET education (Hoeckel & Schwartz, 2010).
The remainder of this paper is structured as follows. Section 2 reviews the literature on the effect of technological change on labor market demand and presents our hypotheses. Section 3 explains the estimation strategy, and Section 4 describes the data. Section 5 presents the results of the analysis and deals with the issue of reverse causality by providing a robustness test of our main results. Section 6 investigates whether the results for the 22 years also hold for sub-periods.
Section 7 concludes.
2 Literature Review and Hypotheses
Despite a growing body of literature on the effect of ICT on labor demand, whether or not ICT decreases the demand for workers remains an unanswered question. By contrasting the concepts of job polarization and upskilling, this section reviews the literature on ICT effect on the labor market, summarizes the international evidence, and links specific findings to the Swiss labor context. We then formulate our hypotheses by considering the possible role played by firm size and industry sector.
2.1 From Skill-biased Technical Change to Job Polarization
The debate over the influence of ICT on occupational structure has long been dominated by the assumption that technological change favors highly skilled occupations (e.g., Katz & Murphy, 1992; Hansen & Birkinshaw, 2007; Goos et al., 2009). This assumption, known as the SBTC hypothesis, suggests that new technologies lead to higher productivity, especially for highly educated workers, who possess the necessary skills to use them (see Acemoglu, 2002; Hornstein et al., 2005, for a theoretical foundation of skill-biased technological change). SBTC thus posits that ICT shifts labor demand from unskilled to skilled workers.
The empirical literature confirms this positive relationship between ICT and demand for workers’ skills across countries. Autor et al. (1998) show that the SBTC hypothesis, as measured by computerization, fits several salient changes in the distribution of earnings in the US. Goldin
& Katz (2009) empirically show that this framework is successful in considering changes in the skill premium and the demand for skills in the US throughout the twentieth century.
However, as Acemoglu (1999) points out, the SBTC hypothesis is partly contradicted by the empirical observation that the employment structure in the US has become polarized, i.e., employment in low- and high-paid occupations has increased, while the percentage of medium- paid occupations has decreased. Acemoglu & Autor (2011) also show that the distribution of employment in the US across occupations "twisted" over the period 1980–2007. They point out that employment grew nearly monotonically in occupational skills during the 1980s, with the percentage of occupations below the median skill level declining, and the percentage of occu- pations above the median increasing. During the 1990s, while employment growth continued to increase in the higher part of the distribution, it also increased modestly at the bottom. In contrast, the percentage of occupations around the median skill level decreased. Acemoglu &
Autor (2011) call this pattern "job polarization." Finally, they also point out during the 2000s, the US labor market became further polarized by showing substantial growth at the bottom part of the skills distribution, while showing negative growth and no growth, respectively, in the middle and top part of the skills distribution.
Autor et al. (2015) show that the effect of ICT on the percentage of workers performing routine tasks in the manufacturing sector has weakened since the 1980s but intensified in the service sector. These findings suggest that the effect of ICT on the labor market is shifting from automation in the manufacturing sector to computerization of information processing in the service sector.
Linking job polarization to the diffusion of ICT, Autor et al. (2003) argue that this job polarization reflects the routinization of jobs—and that understanding the labor market conse- quences of technical change calls for distinguishing between skills and tasks. This distinction is crucial because workers with a given level of skills can perform different tasks, which in turn are differently affected by ICT. In their classic work, Autor et al. (2003) distinguish both between routine and non-routine tasks and between cognitive and manual tasks, finding that ICT has a negative impact on workers performing routine manual and routine cognitive tasks. In contrast, they find that ICT has a positive effect on workers conducting non-routine cognitive tasks, but no effect on workers performing non-routine manual tasks.
Following the groundbreaking work of Autor et al. (2003), many scholars have further de- veloped the task-based perspective. David & Dorn (2013) show that the expansion of service employment explains almost all the increase at the bottom of the occupational distribution.
The polarization pattern applies not only to the US but also to many European countries, as shown by Goos et al. (2009), who analyze the labor evolution in 16 European countries between 1993 and 2006. They show that the decline in the percentage of middle wage occupations in all 16 countries was accompanied by an increase in the percentage of high-wage occupations (in 13 of them) and an increase of low-wage occupations (in 11 of them). Michaels et al. (2014) test whether industry-country pairs with faster growth in ICT experienced a relatively faster growth of tertiary-educated workers. Using data from the US, Japan, and nine European countries for 1980–2004, they show that industries with faster ICT growth raise the relative demand for high- skilled workers while reducing it for middle-skilled workers. Their results are thus consistent with the notion of ICT-based polarization.
However, despite the attention given to labor market polarization, evidence from coun- tries in which the majority of workers have a VET degree—including Austria, Germany, and Switzerland—is scarce. This lack of evidence is worrisome, given the theoretical argument that VET graduates are at a disadvantage in adjusting to technological change (e.g., Krueger &
Kumar, 2004; Hanushek et al., 2017). Moreover, few empirical studies exist on the effect of technological change on VET, and their results are contradictory.
For example, recent analyses by Roy & Consoli (2018) and Rendall & Weiss (2016), inves- tigating employment polarization in Germany within the framework of task-biased technical change, come to opposing conclusions. Roy & Consoli (2018) show that regions with a high percentage of VET experienced a decline in routine jobs, suggesting occupational upskilling.
In contrast, Rendall & Weiss (2016) find that regions with high percentages of VET students have less computer adoption and less employment polarization. They argue that this relatively lower computer adoption arises because the firm-specific investment in VET prevents firms from adopting new technologies. These contradictory findings highlight the need for further investigations into the relationship between ICT and VET.
For Switzerland, the evidence is even sparser than for Germany. An exception is Oesch &
Rodriguez Menes (2011), who analyze the development of the occupational structure in Switzer- land according to changes in the wage distribution over 1990–2008. Their results suggest that labor evolution in Switzerland is more consistent with the SBTC hypothesis—i.e., upskilling—
than with the routinization hypothesis. Bolli et al. (2015), in a similar analysis—which considers both unemployment and the percentage of types of education in the workforce—show slightly more evidence of job polarization.
Beerli et al. (2017) connect the effect of SBTC to the skill mix resulting from immigration to Switzerland from 1990 to 2010. They show that ICT led to stronger employment growth at the top of the wage distribution, thereby augmenting the opportunities of high-skilled immigrants.
Their results further suggest negative employment effects for middle-skilled workers and show no evidence of employment growth among low-skilled workers. In contrast, they find that the inflow of low- and middle-skilled workers in regions with high ICT diffusion was relatively modest.
2.2 Hypotheses
We develop our research hypothesis from the theoretical framework and empirical evidence. As the literature is inconclusive as to the effect of ICT on the proportion of VET workers, we formulate two opposing hypotheses.
First, if the SBTC hypothesis holds for Switzerland, we expect ICT to decrease the per- centage of low-skilled workers, keep stable the percentage of workers with an upper-secondary general education and upper-secondary VET workers (whom we consider middle-skilled), and increase the percentage of both tertiary academic and tertiary VET workers. For the effect of ICT on labor demand, we thus formulate the following hypotheses:
H1aI: ICT decreases the demand for untrained workers.
H1aII: ICT leaves unchanged the demand for workers with an upper-secondary academic education and upper-secondary VET workers.
H1aIII: ICT increases the demand for PET, UAS, and academic university graduates.
Second, if the job polarization hypothesis holds for Switzerland, we expect ICT to increase the demand for low-skilled workers, reduce the demand for upper-secondary VET workers, and increase the demand for UAS, PET and university graduates, all of whom we consider high skilled. For the effect of ICT on labor demand, we thus formulate the following hypotheses:
H1bI: ICT increases the demand for untrained workers.
H1bII: ICT decreases the demand for workers with an upper-secondary academic education and upper-secondary VET workers.
H1bIII: ICT increases the demand for PET, UAS, and academic university graduates.
In addition to these two opposing hypotheses, we also hypothesize on the heterogeneity of the ICT effect across industries and firm sizes. For the industry sector, Stockinger (2019) finds that ICT diffusion in Germany leads to negative overall employment effects in manufacturing but to positive ones in the service industries. We therefore expect to find more evidence of upskilling or polarization in firms that operate in the service sector, rather than in the manufacturing one.
H2: The size of the ICT effect is greater in the service sector than in the manufacturing one.
The current debate on the role of ICT on the demand of skilled workers mainly focuses on heterogeneity across industries but neglects possible heterogeneity across firm size. However, from a historical perspective, studies show that productivity gains derived from technological change increase relative to the size of the firm (Katz & Margo, 2014). Given the similarity of the German and Swiss economies, we expect ICT to have a greater effect on labor demand in large firms than in small ones, due to the higher degree of division of labor. We thus hypothesize as follows:
H3: The size of the ICT effect increases with firm size.
3 Empirical Strategy
To assess the effect of ICT on the demand for workers, we use a quantitative regression anal- ysis. We estimate equations that relate the percentage of non-ICT workers with a particular educational level to the percentage of those in the firm. To avoid the mechanical effect that an increase in ICT workers has on workers’ educational composition within the firm, we exclude ICT workers from the dependent variable. By so doing, we prevent being misled by a potential situation in which ICT workers are highly represented among a specific education group (e.g., among academic-educated workers), resulting in the employment effect being driven by educa- tion itself and not by ICT. As we do not account for the effect of ICT on ICT workers, our empirical strategy provides a lower bound of the effect of ICT on labor demand.2
2Estimations including ICT workers in the percentage of workers with a particular education level provide qualitatively similar results.
Observing firms’ percentages of ICT workers and their workforce composition over time allows us to apply firm fixed effects, thereby preventing possible bias due to time-invariant unobserved firm-specific heterogeneity. As the data used in this study consists of indepen- dent, repeated cross-sections, the inclusion of firm fixed effects is not feasible. However, the pseudo-panel methods, which consider stable groups of firms with similar characteristics (e.g., geographical location, industry, firm size), rather than single firms over time, constitute a valid alternative (Deaton, 1985). In the pseudo-panel method, firm variables are replaced by their intra-group means. The necessary condition is that cells (i.e., groups of firms) are fixed over time. If this condition holds, firm fixed effects can be replaced by cell fixed effects, and the model can be estimated as a standard panel fixed effect.
To illustrate the pseudo-panel method, we start by presenting a standard panel fixed effect.
Assume that we have genuine panel data that allows us to follow firms over time. We can estimate the effect of ICT on the percentage of employees with a particular education level in a firm as follows:
yitl αi β1ICTit β2Xit γrt it (1)
where yitl is the percentage of employees with education level l in firm i at time t, who are not classified as ICT workers. ICTit is the percentage of ICT occupations in firm iat time t, and Xti is a vector of control variables. γrt is a dummy for combinations of region and year, capturing time-region specific trends. it is the error term, which is clustered at the firm level.
In genuine panel data,αi is a fixed unknown parameter.
For repeated cross-sections, Deaton (1985) suggests the use of cells for obtaining a consistent estimate ofβ with repeated cross-sections. Cellsc are groups of firms sharing certain common characteristics. Firms belong to one cell, which remains fixed for all periods. If cells are based on a large number of individual observations, we can assume that cell averages over time are fixed ( ¯αct = αc), so that a natural estimator of β yields a fixed effect estimator (sometimes called "within estimator") on the pseudo-panel. Aggregating observations at the cell level, we can thus rewrite the equation as follows:
ylctαc β1ICTct β2X¯ct γrt u¯ct c1, ...C ; t1, ..., T (2)
where ylct is the percentage of employees with education level l in cell c at time t,ICTct ct is the percentage of ICT-intensive occupations in cell c at time t, and ¯Xi is a vector of control variables averaged across cell c in time t. γrt still captures time-region specific trends. ¯uct is the error term, which now is clustered at the cell level.
The pseudo-panel approach has the additional benefit that the use of cell means averages out the measurement errors of individual firms (Antman & McKenzie, 2007). We construct cells c, which group together firms with characteristics considered similar. According to Guillerm (2017), a good selection criterion must (a) be based on firm-level characteristics that do not change over time, (b) generate enough cells to reduce measurement errors, and (c) not generate not too many cells, or else the cells will lose the necessary within-cell variability.
We construct pseudo-panel cells by grouping the firm-level observations by year, 106 regions, three firm sizes, and industry defined at the two-digit level (55 classes derived from NOGA 2002 classification for 1996–2010 and 41 classes derived from NOGA 2008 classification for 2012–
2018). We thus potentially create 17,490 cells per year for 1996–2010 and 13,038 cells per year for 2012–2018.
We obtain an unbalanced quasi-panel comprising observations of each cell c at different times. We then calculate the percentages of workers with education levell, and the average of all explanatory variables for each cell.
4 Data and Description of Variables
To estimate the effect of ICT on the demand for workers, we use the Swiss Earnings Structure Survey (SESS), which is a firm survey conducted by the Swiss Federal Office of Statistics (SFOS) every two years since 1994. The SESS covers between 16.6% (1996) and 50% (2010) of total employment in Switzerland, thus constituting the largest representative firm survey in the country. Participation in the survey is mandatory.
The SESS is a repeated cross-section of workers in Switzerland, reflecting the employment situation in October of the corresponding year. Every wave is a new stratified random sample of private and public firms with at least three full-time workers. Stratification covers firm size, two-digit industry affiliation, and geographic location. The sampling occurs at both the firm and employee levels. The SFOS selects firms from the Swiss Business and Enterprise Register.
Firms then select the employees for whom they provide the information. Firms with fewer
than 20 workers have to report information on all employees. Firms with between 20 and 50 workers can, if they wish, report information on every second employee. Firms with more than 50 workers can, if they wish, report information on every third employee. In the last two cases, firms are expected to select workers at random.
The SESS collects detailed information about workers’ and firms’ characteristics. We restrict the sample by including only those individuals aged between 18 and 65 years who work in the private sector, with full educational information. We focus on 1996–2018, as these waves contain all the information necessary for our empirical strategy. We study only private sector firms, because SESS coverage of the public sector is not complete for our time period.
At the firm level, we construct a measure of total employment based on the number of full- time equivalent (FTE) workers in the firm. We also use the number of FTEs to create a firm size classification. We classify firms as small if they employ less than 50 FTE workers, medium if they employ between 50 and 249 FTE workers, and large if they employ more than 250 FTE workers. Industry affiliation is defined according to the NOGA 2002 classification (55 classes in total) for the waves before 2010 and according to the NOGA 2008 classification (41 classes in total) for the waves after 2012. The SESS reports firms’ locations according to spatial mobility (SM) regions, which the SFOS defines as homogeneous micro-regions representing local labor markets (Schuler et al., 2005). SM regions are thus appropriate for our analysis of the labor market effect of ICT on the demand for VET-educated workers.
At the worker level, the two key variables in our analysis are ICT and education. For education, we calculate for each firm the percentage of workers according to the highest level of education achieved. We create six educational groups. "Lower" educated workers have no post-compulsory education or no officially recognized firm-internal vocational training.3 "VET"
workers have an upper-secondary VET education (either dual-VET or full-time VET school).
"High school" workers have an upper-secondary academic education. This group is relatively small, as only a few workers enter the labor force with an academic upper-secondary diploma as their highest degree (i.e., most continue to tertiary academic education). "PET" workers have a tertiary vocational degree from a Professional Education and Training College or have passed a Federal or Advanced Federal Exam. "UAS" workers have a tertiary vocational degree from a
3To this group we add, for 1996–2010, all workers classified as "others." This classification was not continued in the waves starting in 2012.
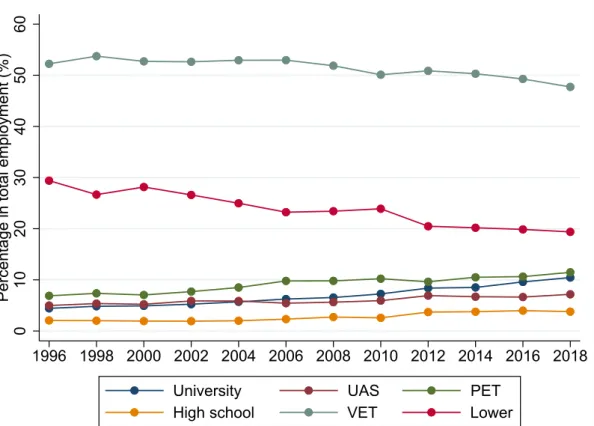
Figure 1: Educational composition over time
0102030405060Percentage in total employment (%)
1996 1998 2000 2002 2004 2006 2008 2010 2012 2014 2016 2018
University UAS PET
Highschool VET Lower
University of Applied Sciences. "Academic" workers have a tertiary academic degree from an academic university.
Figure 1 presents the evolution of workers’ education as a percentage of total employment.
This graph shows that the percentage of VET workers is the largest in the workforce and that this percentage has remained almost constant at a value around 50% from 1996 to 2018. In contrast, the percentage of Lower workers declined over time. Nevertheless, in 2018 the group of Lower workers was still the second largest, at roughly 20% of the workforce. While the remaining four groups are relatively small, each representing 10% or less of the workforce, all four show a stable or positive trend over time. Both PET and University workers almost doubled their percentage, from around 5% in 1996 to around 10% in 2018. UAS workers remain relatively constant throughout the period at around 5% of the workforce. High school workers, although showing a relatively large increase over time, remain the smallest group.
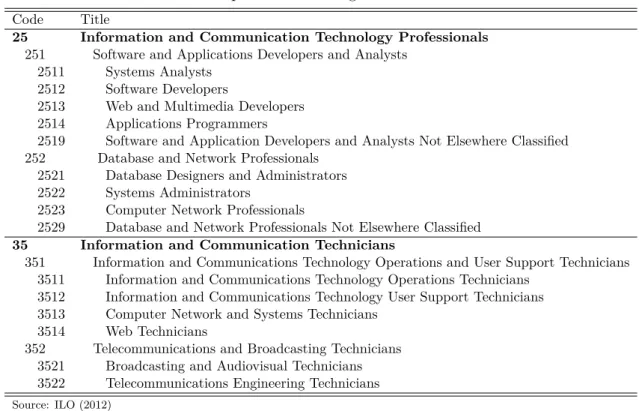
To capture the extent of ICT in a firm, we use two proxies to cover the two periods, one based on ICT occupations and the other on ICT tasks. The first proxy, which measures ICT in 2012–2018, is based on ILO (2012), which defines ICT occupations based on the ISCO-08 classifications. As Table 1 reports, ILO (2012) defines ICT workers as those working in ISCO-08 occupations "Information and Communication Technology Professionals" and "Information and
Table 1: ICT occupations according to ISCO-08 classification
Code Title
25 Information and Communication Technology Professionals 251 Software and Applications Developers and Analysts
2511 Systems Analysts 2512 Software Developers
2513 Web and Multimedia Developers 2514 Applications Programmers
2519 Software and Application Developers and Analysts Not Elsewhere Classified 252 Database and Network Professionals
2521 Database Designers and Administrators 2522 Systems Administrators
2523 Computer Network Professionals
2529 Database and Network Professionals Not Elsewhere Classified 35 Information and Communication Technicians
351 Information and Communications Technology Operations and User Support Technicians 3511 Information and Communications Technology Operations Technicians
3512 Information and Communications Technology User Support Technicians 3513 Computer Network and Systems Technicians
3514 Web Technicians
352 Telecommunications and Broadcasting Technicians 3521 Broadcasting and Audiovisual Technicians 3522 Telecommunications Engineering Technicians Source: ILO (2012)
Communication Technicians." As the SESS covers ISCO only in the waves after 2012, we use this proxy only for the second period.
As the SESS does not contain ISCO classifications before 2012, we use a different proxy for ICT for 1996–2010, based on a combination of tasks and requirement levels. Indeed, according to Cangemi et al. (2015), the main SESS criteria for classifying workers in the ISCO occupations after 2012 are the tasks and the requirement levels necessary for fulfilling a job. As tasks and the requirement levels are the antecedents of the occupation variable, we therefore use them to construct a proxy for occupations in the 1996–2010 waves.
This proxy for ICT is based on two variables: tasks and requirement levels. The first variable captures the tasks carried out by workers, grouped by fields such as "setting up, operating, and maintaining machines." While these tasks resemble the "Generalized Work Activity" in the US O*NET Program, tasks in SESS are less detailed, differentiating only among 24 activities as opposed to O*NET’s 41 (Tsacoumis & Willison, 2010). In the SESS, each person is assigned to one task. The second variable we use in constructing the proxy for 1996–2010 is the requirement level. This variable uses four categories to measure how demanding and difficult the work is. We restrict this variable by considering only workers at requirement level 4 (denoting a job involving performing the most demanding and difficult work) or level 3 (a job requiring independent and
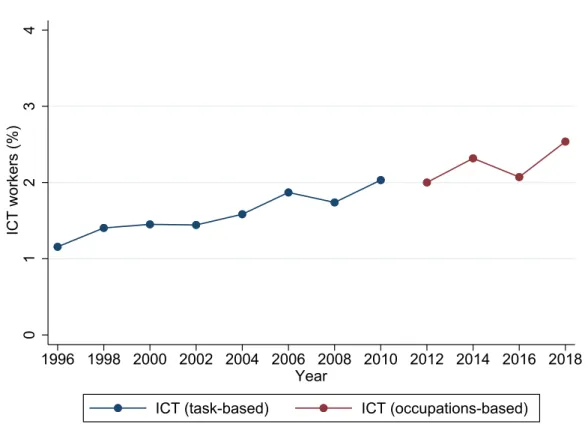
Figure 2: Percentage of ICT workers according to the two proxies
0134ICTworkers (%) 2
1996 1998 2000 2002 2004 2006 2008 2010 2012 2014 2016 2018 Year
ICT (task-based) ICT (occupations-based)
qualified work).4 As for those with level 2 (denoting a job requiring professional and technical skills) or level 1 (a job involving simple and repetitive activities), we do not consider them ICT workers.
Figure 2 reports the evolution of our two ICT proxies. It shows that the percentage of ICT workers, according to the task-based definition, measures from around 1% in 1996 to 2% in 2010. The percentage of ICT workers, according to the occupations-based measure, increases from around 2% in 2012 to 2.5% in 2018. Although theoretically these two variables are not completely comparable—the first describes ICT tasks, while the second refers to occupations—
this figure shows that our proxy for 1996–2010 is close to the percentage of ICT workers based on ICT occupations. Our procedure is further supported by Braun-Dubler et al. (2016), who also use the activities classified as "Analyzing, Programming, Operation"—based on the SESS data set—to investigate the evolution of salaries in ICT occupations. For further worker-level information, we use age, gender, part-time, and tenure.5
4According to the SESS codebook, in the waves from 2012, ISCO-08 occupations 20–26 have requirement level 4, while ISCO-08 occupations 30–35 have requirement level 3. According to the ILO (2012), ICT occupations correspond to ISCO-08 classes 25 and 35. Thus we can restrict our definition of ICT workers to those having requirement levels 3 and 4.
5SFOS imprecisely coded workers with less than one year of tenure with a missing value in the wave preceding 2004. Therefore, we cannot distinguish between workers with zero and missing values of tenure in 1996–2002.
Excluding all observations with missing value of tenure would reduce sample size significantly, because the percentage of missing values in the tenure variable lies between 5% and 10% in the waves from 1996 to 2002 but
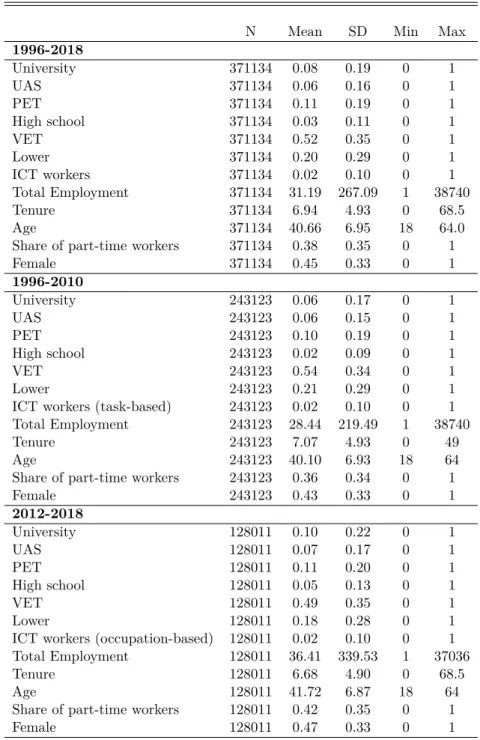
Table 2: Firm level summary statistics
N Mean SD Min Max
1996-2018
University 371134 0.08 0.19 0 1
UAS 371134 0.06 0.16 0 1
PET 371134 0.11 0.19 0 1
High school 371134 0.03 0.11 0 1
VET 371134 0.52 0.35 0 1
Lower 371134 0.20 0.29 0 1
ICT workers 371134 0.02 0.10 0 1
Total Employment 371134 31.19 267.09 1 38740
Tenure 371134 6.94 4.93 0 68.5
Age 371134 40.66 6.95 18 64.0
Share of part-time workers 371134 0.38 0.35 0 1
Female 371134 0.45 0.33 0 1
1996-2010
University 243123 0.06 0.17 0 1
UAS 243123 0.06 0.15 0 1
PET 243123 0.10 0.19 0 1
High school 243123 0.02 0.09 0 1
VET 243123 0.54 0.34 0 1
Lower 243123 0.21 0.29 0 1
ICT workers (task-based) 243123 0.02 0.10 0 1
Total Employment 243123 28.44 219.49 1 38740
Tenure 243123 7.07 4.93 0 49
Age 243123 40.10 6.93 18 64
Share of part-time workers 243123 0.36 0.34 0 1
Female 243123 0.43 0.33 0 1
2012-2018
University 128011 0.10 0.22 0 1
UAS 128011 0.07 0.17 0 1
PET 128011 0.11 0.20 0 1
High school 128011 0.05 0.13 0 1
VET 128011 0.49 0.35 0 1
Lower 128011 0.18 0.28 0 1
ICT workers (occupation-based) 128011 0.02 0.10 0 1
Total Employment 128011 36.41 339.53 1 37036
Tenure 128011 6.68 4.90 0 68.5
Age 128011 41.72 6.87 18 64
Share of part-time workers 128011 0.42 0.35 0 1
Female 128011 0.47 0.33 0 1
We collapse the firm-level data of 11,575,341 workers and aggregate waves in a data set of 243,123 and 128,011 observations for 1996–2010 and 2012—2018, respectively. Table 2 reports the firm-level summary statistics of the main variables used for the empirical analysis both for the entire period and for both subperiods.
from 2004 is less than 0.4%. To avoid losing a considerable percentage of workers, we correct this variable by adopting a consistent (albeit imperfect) definition of tenure—by recoding all missing values to zero in all waves.
5 Estimation Results
This section presents the results of our estimation procedure, which aims at identifying the effect of ICT on the proportion of workers grouped by their highest education level. We start by presenting the results for the pseudo-panel method. We then present the result for a generalized method of moments (GMM), which deals with potential problems of reverse causality of the fixed effects estimations.
5.1 OLS with Fixed Effect
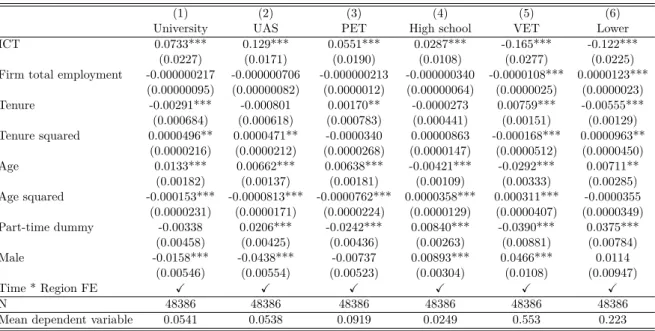
Table 3 reports the results for 1996–2018. Columns (1) to (6) use as a dependent variable the percentage of the six educational groups in this paper: University, UAS, PET, High school, VET, and Lower workers. All estimations include time*region fixed effects and control for total employment in the firm, firm averages of tenure and age, and the percentage of part-time and female workers. The coefficients of interest are those in the first row of the table, which reports the effect of the percentage of ICT workers with a given education.
The coefficient for ICT in column (1) is positive and statistically significant. The coeffi- cient of 0.0733 means that a 1% higher percentage of ICT workers increases the percentage of
Table 3: Pseudo-panel FE estimation
(1) (2) (3) (4) (5) (6)
University UAS PET High school VET Lower
ICT 0.0733*** 0.129*** 0.0551*** 0.0287*** -0.165*** -0.122***
(0.0227) (0.0171) (0.0190) (0.0108) (0.0277) (0.0225) Firm total employment -0.000000217 -0.000000706 -0.000000213 -0.000000340 -0.0000108*** 0.0000123***
(0.00000095) (0.00000082) (0.0000012) (0.00000064) (0.0000025) (0.0000023)
Tenure -0.00291*** -0.000801 0.00170** -0.0000273 0.00759*** -0.00555***
(0.000684) (0.000618) (0.000783) (0.000441) (0.00151) (0.00129) Tenure squared 0.0000496** 0.0000471** -0.0000340 0.00000863 -0.000168*** 0.0000963**
(0.0000216) (0.0000212) (0.0000268) (0.0000147) (0.0000512) (0.0000450)
Age 0.0133*** 0.00662*** 0.00638*** -0.00421*** -0.0292*** 0.00711**
(0.00182) (0.00137) (0.00181) (0.00109) (0.00333) (0.00285) Age squared -0.000153*** -0.0000813*** -0.0000762*** 0.0000358*** 0.000311*** -0.0000355
(0.0000231) (0.0000171) (0.0000224) (0.0000129) (0.0000407) (0.0000349) Part-time dummy -0.00338 0.0206*** -0.0242*** 0.00840*** -0.0390*** 0.0375***
(0.00458) (0.00425) (0.00436) (0.00263) (0.00881) (0.00784)
Male -0.0158*** -0.0438*** -0.00737 0.00893*** 0.0466*** 0.0114
(0.00546) (0.00554) (0.00523) (0.00304) (0.0108) (0.00947)
Time * Region FE X X X X X X
N 48386 48386 48386 48386 48386 48386
Mean dependent variable 0.0541 0.0538 0.0919 0.0249 0.553 0.223
Notes: The table shows OLS coefficients of fixed effects estimates of a firm pseudo-panel with cells defined based on region, industry, and firm size. Standard errors in parentheses are clustered at the cell level. N reports the number of pseudo-panel cells that contain at least one firm.
The main explanatory variable measures the cell percentage of ICT workers according to ICT tasks (1996–2010) or ICT occupations (2012–
2018). Estimates further control for region*time fixed effects and cell averages of total employment, tenure, age, part-time status, and gender.
Each column shows the results for a different dependent variable measuring the percentage of workers with a particular education within the cell. * p<0.10, ** p<0.05, *** p<0.01.
university workers by about 0.07% on average. Considering that the average percentage of ICT workers is 2% and that the average percentage of University workers is 5%, this finding implies that an increase in the percentage of ICT workers of 10% (from 2% to 2.2%), increases in the percentage of University workers of about 0.7% (from 4% to 4.7%).
The coefficient in column (2) suggests that the effect ofICT is even larger for UAS workers.
A test of pairwise equality suggests that the coefficient for UAS is statistically different from that of University. The coefficient for ICT in column (3), which is also positive and statistically significant, is smaller for PET workers that for University or UAS workers. The coefficient of ICT in column (4) is also positive and statistically different from zero but smaller than the previous ones. This coefficient suggests a smaller average effect for workers with high school as the highest level of education. In contrast, the ICT coefficients in columns (5) and (6) indicate that for Lower workers, and especially for VET workers, an increase in ICT reduces their employment.
Together the values for ICT suggest patterns more in line with the upskilling hypothesis (H1a) than with the job polarization hypothesis (H1b). Indeed, we observe that ICT increases the demand of workers monotonically along the education distribution. Specifically, we find support for our hypothesis that ICT decreases the demand for untrained workers (H1aI) while increasing the demand for PET, UAS, and University workers (H1aIII). The effect on the demand for middle-educated workers is more nuanced. On one hand, ICT decreases the demand for upper-secondary VET workers, although this decrease is less pronounced than that for Lower workers. On the other hand, ICT has a small but positive effect on the demand for High school workers. Our results thus only partly support hypothesis H1aII, which says that ICT leaves unchanged the demand for workers with an upper-secondary academic education and upper- secondary VET workers.
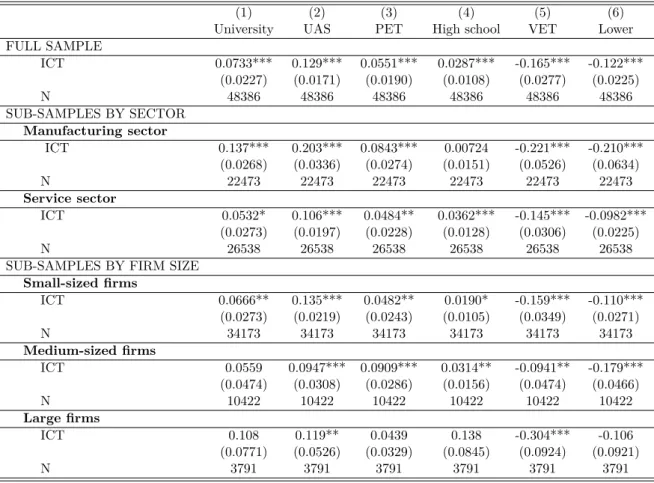
In Section 2.2, by formulating our hypotheses, we differentiated our expectations for the intensity of the upskilling or polarizing effect across sectors and firm size. We now present our results from using subsamples of firm characteristics. Table 4 reports the coefficients of ICT for the different subsamples. In the first line, we report the ICT coefficients for the full sample, which represents our baseline. In the subsequent rows, we report theICT coefficients estimated on subsamples by sector and firm size. To facilitate the comparison across subsamples, we report the coefficient forICT and the number of cells having firms with those characteristics. The full tables, which include the coefficients for all regressors, appear in Appendix A.1.
Table 4: Pseudo-panel FE estimations: sub-samples
(1) (2) (3) (4) (5) (6)
University UAS PET High school VET Lower
FULL SAMPLE
ICT 0.0733*** 0.129*** 0.0551*** 0.0287*** -0.165*** -0.122***
(0.0227) (0.0171) (0.0190) (0.0108) (0.0277) (0.0225)
N 48386 48386 48386 48386 48386 48386
SUB-SAMPLES BY SECTOR Manufacturing sector
ICT 0.137*** 0.203*** 0.0843*** 0.00724 -0.221*** -0.210***
(0.0268) (0.0336) (0.0274) (0.0151) (0.0526) (0.0634)
N 22473 22473 22473 22473 22473 22473
Service sector
ICT 0.0532* 0.106*** 0.0484** 0.0362*** -0.145*** -0.0982***
(0.0273) (0.0197) (0.0228) (0.0128) (0.0306) (0.0225)
N 26538 26538 26538 26538 26538 26538
SUB-SAMPLES BY FIRM SIZE Small-sized firms
ICT 0.0666** 0.135*** 0.0482** 0.0190* -0.159*** -0.110***
(0.0273) (0.0219) (0.0243) (0.0105) (0.0349) (0.0271)
N 34173 34173 34173 34173 34173 34173
Medium-sized firms
ICT 0.0559 0.0947*** 0.0909*** 0.0314** -0.0941** -0.179***
(0.0474) (0.0308) (0.0286) (0.0156) (0.0474) (0.0466)
N 10422 10422 10422 10422 10422 10422
Large firms
ICT 0.108 0.119** 0.0439 0.138 -0.304*** -0.106
(0.0771) (0.0526) (0.0329) (0.0845) (0.0924) (0.0921)
N 3791 3791 3791 3791 3791 3791
Notes: The table shows OLS coefficients of fixed effects estimates of a firm pseudo-panel with cells defined based on region, indu- stry, and firm size. Standard errors in parentheses are clustered at the cell level. N reports the number of pseudo-panel cells that contain at least one firm. The main explanatory variable measures the cell percentage of ICT workers according to ICT tasks (1996–2010) or ICT occupations (2012–2018). Estimates further control for region*time fixed effects and cell averages of total employment, tenure, age, part-time status, and gender. Each column shows the results for a different dependent variable measu- ring the percentage of workers with a particular education within the cell. * p<0.10, ** p<0.05, *** p<0.01.
We focus first on the estimations by sector. By comparing theICT coefficients with the one for the full sample, we observe that our measures ofICT suggest an upskilling effect for both the manufacturing and service sectors, with the size of the effects larger in the manufacturing sector. Thus our estimations cannot confirm our hypothesis that the size of the upskilling or polarizing effect of ICT is greater in the service sector (H2).
We focus now on the estimation by firm size reported in the lower part of Table 4. The results show that the effects of ICT on the demand of workers with different education levels differ strongly across firm size. We observe generally larger effects in large firms than in medium or small ones. In the small and medium firms, the patterns are consistent with the upskilling hypothesis, while in large firms the results are mixed. Our hypotheses that the size of the upskilling or polarizing effect of ICT is greater in large firms than in small or medium ones (H3) is thus not confirmed.
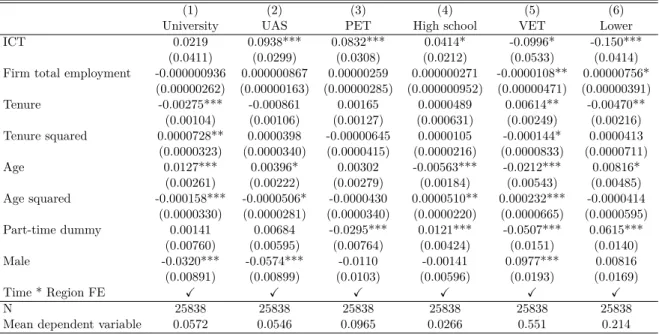
5.2 GMM Estimation
To deal with potential problems of reverse causality in our fixed effects estimations, we use a GMM estimation. Tables 5 reports the result of the GMM for 1996–2018. Compared to the pseudo-panel FE estimates presented earlier, the GMM additionally accounts for potential reverse causality by instrumenting variables by the corresponding lagged values and differences (Arellano & Bond, 1991).
The GMM estimates suggest a positive but statistically insignificant coefficient for ICT on the demand for University workers. In contrast, the coefficients for UAS and PET workers are positive and statistically different from zero. The coefficient for UAS is slightly lower than that for the fixed effect estimation in Table 3, while that for PET is higher. Similarly, the coefficient for High school workers is higher in the GMM estimates than in the fixed effect estimation.
The effect of ICT on the demand of VET workers is negative and statistically significant, albeit smaller than in the fixed effect estimations. Finally, the size of the ICT coefficient for VET workers is very close to that in the fixed effect estimation. Overall, the GMM estimations confirm the upskilling pattern previously observed.
Table 5: GMM estimations
(1) (2) (3) (4) (5) (6)
University UAS PET High school VET Lower
ICT 0.0219 0.0938*** 0.0832*** 0.0414* -0.0996* -0.150***
(0.0411) (0.0299) (0.0308) (0.0212) (0.0533) (0.0414) Firm total employment -0.000000936 0.000000867 0.00000259 0.000000271 -0.0000108** 0.00000756*
(0.00000262) (0.00000163) (0.00000285) (0.000000952) (0.00000471) (0.00000391)
Tenure -0.00275*** -0.000861 0.00165 0.0000489 0.00614** -0.00470**
(0.00104) (0.00106) (0.00127) (0.000631) (0.00249) (0.00216) Tenure squared 0.0000728** 0.0000398 -0.00000645 0.0000105 -0.000144* 0.0000413 (0.0000323) (0.0000340) (0.0000415) (0.0000216) (0.0000833) (0.0000711)
Age 0.0127*** 0.00396* 0.00302 -0.00563*** -0.0212*** 0.00816*
(0.00261) (0.00222) (0.00279) (0.00184) (0.00543) (0.00485) Age squared -0.000158*** -0.0000506* -0.0000430 0.0000510** 0.000232*** -0.0000414
(0.0000330) (0.0000281) (0.0000340) (0.0000220) (0.0000665) (0.0000595) Part-time dummy 0.00141 0.00684 -0.0295*** 0.0121*** -0.0507*** 0.0615***
(0.00760) (0.00595) (0.00764) (0.00424) (0.0151) (0.0140)
Male -0.0320*** -0.0574*** -0.0110 -0.00141 0.0977*** 0.00816
(0.00891) (0.00899) (0.0103) (0.00596) (0.0193) (0.0169)
Time * Region FE X X X X X X
N 25838 25838 25838 25838 25838 25838
Mean dependent variable 0.0572 0.0546 0.0965 0.0266 0.551 0.214
Notes: The table shows the GMM estimates of a firm pseudo-panel with cells defined according to region, industry, and firm size. Stan- dard errors in parentheses are clustered at the cell level. N reports the number of pseudo-panel cells that contain at least one firm. The main explanatory variable measures the cell percentage of ICT workers according to ICT tasks (1996–2010) or according to ICT occupa- tions (2012–2018). Estimates further control for region*time fixed effects and cell averages of total employment, tenure, age, part-time status and gender. Each column shows the results for a different dependent variable measuring the percentage of workers with a particu- lar education within the cell. * p<0.10, ** p<0.05, *** p<0.01.
6 Robustness Check
This section deals with the issue of having two proxies for ICT occupations, one for 1996–2010 and the second one for 2012–2018. Although Section 4 discusses the methodological concepts motivating the use of these variables and argues for the compatibility of these two measures, the question remains whether the effect of ICT on the demand for labor might depend on the way the ICT variable is defined. Therefore, as a robustness check, we separately present the results for the 1996–2010 and 2012–2018.
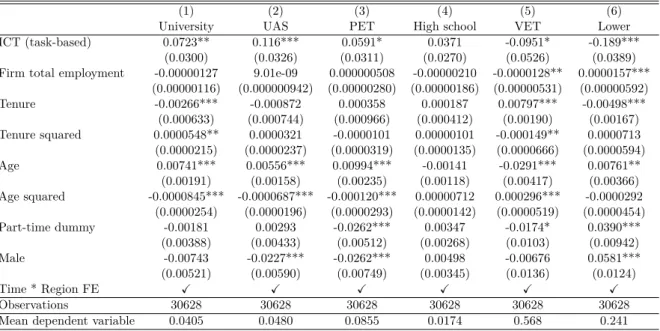
6.1 Fixed Effect Estimates for Separate Time Periods
Tables 6 and 7 report the results based on the pseudo-panel procedure for the periods 1996–
2010 and 2012–2018, respectively. As with the full sample, columns (1) to (6) use as dependent variables the percentages of the six educational groups that this paper uses.
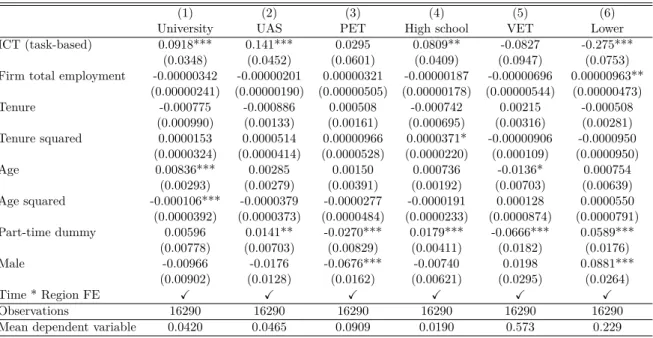
The coefficients forICT in column (1) for 1996–2010 are positive and statistically significant and very close to those observed for the entire period, whereas the coefficients for 2012–2018 are positive but not statistically different from zero. The coefficients in columns (2) are positive and statistically significant for both periods. The effect is larger in 1996–2010 than in 2012–2018 For both periods the effect ofICT is thus larger for UAS workers than for University ones. The
Table 6: Pseudo-panel FE estimations: 1996–2010
(1) (2) (3) (4) (5) (6)
University UAS PET High school VET Lower
ICT (task-based) 0.0723** 0.116*** 0.0591* 0.0371 -0.0951* -0.189***
(0.0300) (0.0326) (0.0311) (0.0270) (0.0526) (0.0389) Firm total employment -0.00000127 9.01e-09 0.000000508 -0.00000210 -0.0000128** 0.0000157***
(0.00000116) (0.000000942) (0.00000280) (0.00000186) (0.00000531) (0.00000592)
Tenure -0.00266*** -0.000872 0.000358 0.000187 0.00797*** -0.00498***
(0.000633) (0.000744) (0.000966) (0.000412) (0.00190) (0.00167) Tenure squared 0.0000548** 0.0000321 -0.0000101 0.00000101 -0.000149** 0.0000713 (0.0000215) (0.0000237) (0.0000319) (0.0000135) (0.0000666) (0.0000594)
Age 0.00741*** 0.00556*** 0.00994*** -0.00141 -0.0291*** 0.00761**
(0.00191) (0.00158) (0.00235) (0.00118) (0.00417) (0.00366) Age squared -0.0000845*** -0.0000687*** -0.000120*** 0.00000712 0.000296*** -0.0000292
(0.0000254) (0.0000196) (0.0000293) (0.0000142) (0.0000519) (0.0000454)
Part-time dummy -0.00181 0.00293 -0.0262*** 0.00347 -0.0174* 0.0390***
(0.00388) (0.00433) (0.00512) (0.00268) (0.0103) (0.00942)
Male -0.00743 -0.0227*** -0.0262*** 0.00498 -0.00676 0.0581***
(0.00521) (0.00590) (0.00749) (0.00345) (0.0136) (0.0124)
Time * Region FE X X X X X X
Observations 30628 30628 30628 30628 30628 30628
Mean dependent variable 0.0405 0.0480 0.0855 0.0174 0.568 0.241
Notes: The table shows OLS coefficients of fixed effects estimates of a firm pseudo-panel with cells defined based on region, industry, and firm size. Standard errors in parentheses are clustered at the cell level. N reports the number of pseudo-panel cells that contain at least one firm.
The main explanatory variable measures the cell percentage of ICT workers according to ICT tasks. Estimates further control for region*time fixed effects and cell averages of total employment, tenure, age, part-time status and gender. Each column shows the results for a different de- pendent variable measuring the percentage of workers with a particular education within the cell. * p<0.10, ** p<0.05, *** p<0.01.
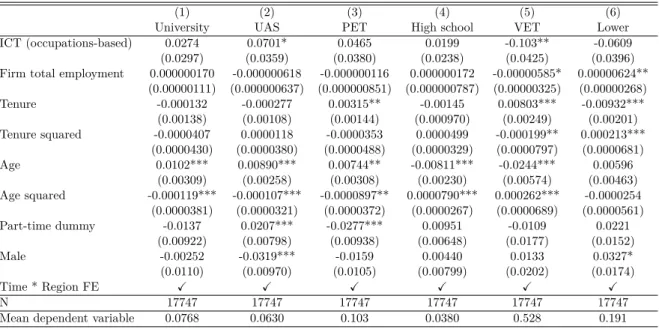
Table 7: Pseudo-panel FE estimations: 2012–2018
(1) (2) (3) (4) (5) (6)
University UAS PET High school VET Lower
ICT (occupations-based) 0.0274 0.0701* 0.0465 0.0199 -0.103** -0.0609
(0.0297) (0.0359) (0.0380) (0.0238) (0.0425) (0.0396) Firm total employment 0.000000170 -0.000000618 -0.000000116 0.000000172 -0.00000585* 0.00000624**
(0.00000111) (0.000000637) (0.000000851) (0.000000787) (0.00000325) (0.00000268)
Tenure -0.000132 -0.000277 0.00315** -0.00145 0.00803*** -0.00932***
(0.00138) (0.00108) (0.00144) (0.000970) (0.00249) (0.00201) Tenure squared -0.0000407 0.0000118 -0.0000353 0.0000499 -0.000199** 0.000213***
(0.0000430) (0.0000380) (0.0000488) (0.0000329) (0.0000797) (0.0000681)
Age 0.0102*** 0.00890*** 0.00744** -0.00811*** -0.0244*** 0.00596
(0.00309) (0.00258) (0.00308) (0.00230) (0.00574) (0.00463) Age squared -0.000119*** -0.000107*** -0.0000897** 0.0000790*** 0.000262*** -0.0000254
(0.0000381) (0.0000321) (0.0000372) (0.0000267) (0.0000689) (0.0000561)
Part-time dummy -0.0137 0.0207*** -0.0277*** 0.00951 -0.0109 0.0221
(0.00922) (0.00798) (0.00938) (0.00648) (0.0177) (0.0152)
Male -0.00252 -0.0319*** -0.0159 0.00440 0.0133 0.0327*
(0.0110) (0.00970) (0.0105) (0.00799) (0.0202) (0.0174)
Time * Region FE X X X X X X
N 17747 17747 17747 17747 17747 17747
Mean dependent variable 0.0768 0.0630 0.103 0.0380 0.528 0.191
Notes: The table shows OLS coefficients of fixed effects estimates of a firm pseudo-panel with cells defined based on region, industry, and firm size. Standard errors in parentheses are clustered at the cell level. N reports the number of pseudo-panel cells that contain at least one firm.
The main explanatory variable measures the cell percentage of ICT workers according to ICT occupations. Estimates further control for re- gion*time fixed effects and cell averages of total employment, tenure, age, part-time status, and gender. Each column shows the results for a different dependent variable measuring the percentage of workers with a particular education within the cell. * p<0.10, ** p<0.05, *** p<0.01.
coefficients for ICT in columns (3) are very similar and close to those for the entire period, even though the one for 2012–2018 is not statistically significant.
The coefficients of ICT in column (4) are in both samples positive but not statistically different from zero. However, the size of the coefficients is similar to that observed in column (4) of Table 3. The ICT coefficients in column (5) are negative and statistically significant for both samples, and confirm the negative effect of ICT on the demand for VET workers observed for the entire sample. Finally, theICT coefficients in columns (6) indicate for Lower workers a negative effect, which is larger—and statistically significant—for 1996–2010, but not statistically different from zero for 2012–2018.
Together, the comparison of the values for ICT across the two periods suggests similar patterns for some education groups, while different effects for others. The effect on the demand for workers with UAS, PET, High school, or VET as the highest level of education is similar in both periods. In contrast, the effect of ICT on the demand for University workers or Lower workers differs across the two periods. Nevertheless, the patterns for both periods are more in line with the upskilling hypothesis (H1a) than with the job polarization hypothesis (H1b).