www.giga-hamburg.de/workingpapers
GIGA Working Papers serve to disseminate the research results of work in progress prior to publicaton to encourage the exchange of ideas and academic debate. Inclusion of a paper in the Working Papers series does not constitute publication and should not limit publication in any other venue. Copyright remains with the authors.
GIGA Research Programme:
Socio-Economic Challenges in the Context of Globalization
___________________________
Explaining the Diffusion of Renewable Energy Technology
in Developing Countries Birte Pohl and Peter Mulder
No 217 March 2013
Edited by the
GIGA German Institute of Global and Area Studies Leibniz‐Institut für Globale und Regionale Studien
The GIGA Working Papers series serves to disseminate the research results of work in progress prior to publication in order to encourage the exchange of ideas and academic debate. An objective of the series is to get the findings out quickly, even if the presenta‐
tions are less than fully polished. Inclusion of a paper in the GIGA Working Papers series does not constitute publication and should not limit publication in any other venue. Copy‐
right remains with the authors. When working papers are eventually accepted by or pub‐
lished in a journal or book, the correct citation reference and, if possible, the corresponding link will then be included on the GIGA Working Papers website at
<www.giga‐hamburg.de/workingpapers>.
GIGA research unit responsible for this issue: “Socio‐Economic Challenges in the Context of Globalisation”
Copyright for this issue: © Birte Pohl and Peter Mulder
WP Coordination and English‐language Copy Editing: Errol Bailey Editorial Assistance and Production: Silvia Bücke
All GIGA Working Papers are available online and free of charge on the website
<www.giga‐hamburg.de/workingpapers>.
For any requests please contact:
E‐mail: <workingpapers@giga‐hamburg.de>
The GIGA German Institute of Global and Area Studies cannot be held responsible for errors or any consequences arising from the use of information contained in this Working Paper; the views and opinions expressed are solely those of the author or authors and do not necessarily reflect those of the Institute.
GIGA German Institute of Global and Area Studies Leibniz‐Institut für Globale und Regionale Studien Neuer Jungfernstieg 21
20354 Hamburg Germany
E‐mail: <info@giga‐hamburg.de>
Website: <www.giga‐hamburg.de>
217/2013 GIGA Working Papers
Explaining the Diffusion of Renewable Energy Technology
in Developing Countries
Abstract
In this paper we study the diffusion of non‐hydro renewable energy (NHRE) technologies for electricity generation across 108 developing countries between 1980 and 2010. We use two‐stage estimation methods to identify the determinants behind the choice of whether or not to adopt NHRE as well as about the amount of electricity to produce from renew‐
able energy sources. We find that NHRE diffusion accelerates with the implementation of economic and regulatory instruments, higher per capita income and schooling levels, and stable, democratic regimes. In contrast, increasing openness and aid, institutional and stra‐
tegic policy support programs, growth of electricity consumption, and high fossil fuel production appear to delay NHRE diffusion. Furthermore, we find that a diverse energy mix increases the probability of NHRE adoption. Finally, we find weak support for a posi‐
tive influence of the Kyoto Protocol on NHRE diffusion and no evidence for any influence resulting from financial sector development.
Keywords: renewable energy technologies, developing countries, electricity, technology diffusion, sample selection
JEL codes: O13, 014, Q42, Q48
Dr. Birte Pohl
is a research fellow at the GIGA Institute of African Affairs. She is a member of GIGA Re‐
search Programme 3.
Contact: <birte.pohl@giga‐hamburg.de>
Website: <http://staff.en.giga‐hamburg.de/pohl>
Dr. Peter Mulder
is an assistant professor in the Department of Spatial Economics, VU University Amster‐
dam, Netherlands.
Contact: <p.mulder@vu.nl>
Website: <www.petermulder.net/>
Renewable Energy Technology in Developing Countries
Birte Pohl and Peter Mulder
Article Outline 1 Introduction
2 Data, Background and Stylized Facts 3 Methodology
4 Baseline Results 5 Extended Results 6 Conclusion Bibliography Appendix
1 Introduction
The growth of global carbon emissions is nowadays largely driven by the increasing volume coming from within developing countries (IEA 2010). Consequently, in 2008 the aggregate ener‐
gy‐related CO2 emissions of developing countries surpassed those of industrialized and transi‐
tion countries for the first time in history (IEA 2010). The positive growth prospects for emerging economies make this trend likely to continue for the foreseeable future, especially given that – particularly in the initial stages of development – the demand for energy increases as the econo‐
my grows (Chow et al. 2003; Jakob, Haller and Marschinski 2012). Curbing the future increase of carbon emissions from developing countries is, therefore, indispensable to the achievement of ambitious climate targets (IPCC 2011).
6 Birte Pohl and Peter Mulder: Explaining the Diffusion of Renewable Energy Technology in Developing Countries
WP 217/2013 GIGA Working Papers
Currently, the electricity sector constitutes a major source of energy‐related CO2 emissions, accounting for 41 percent of global CO2 emissions (IEA 2010). This reality clearly makes the re‐
duction of emissions from electricity generation an essential ingredient in any climate change mitigation strategies (IPCC 2011; GEA 2012). Alongside increasing energy efficiency, the rapid diffusion of renewable energy technologies (RET) is considered to be the second – though equally most effective – option for reducing carbon emissions while simultaneously meeting humanity’s ongoing need for energy provision (GEA 2012). The widespread adoption of RET – including hy‐
droelectric power, geothermal, solar, biomass and wind– would not only help to avoid the nega‐
tive environmental and social effects associated with conventional (i.e., fossil fuel) energies, but also has the potential to create substantial additional socioeconomic benefits – such as, for exam‐
ple, reducing local air pollution and safety risks, increasing energy access and improving energy security (Martinot et al. 2002; GEA 2012; IPCC 2011; Owen 2006).
The research and development in RET is primarily done in industrialized countries (Dechezleprêtre et al. 2011; Popp et al. 2011). The key challenge for developing countries is, there‐
fore, to secure the international transfer of these climate‐friendly technologies. The adoption of RET in developing countries not only slows down global carbon emissions in the short term but also offers them the opportunity to “leapfrog” over developed countries, as a result of environ‐
mentally benign power production technologies being harnessed before a lock‐in into conven‐
tional energy resources occurs (Popp 2011; Watson and Sauter 2011). Nevertheless, it is common knowledge that many governments and firms still continue to invest in old technologies even though the new ones are more cost‐effective, which underlines that the diffusion of energy tech‐
nologies is at least as equally costly and difficult as is their invention (Del Río González 2009;
Jaffe and Stavins 1994; Jaffe et al. 2002; Popp et al. 2011). Against this backdrop, we thus study the adoption and diffusion of RET for electricity generation in developing countries.
The main contribution of this paper to the literature is twofold:
First, although investments in energy‐saving or environmentally friendly technologies have received considerable attention in the field of environmental and energy economics,1 to date few studies have focused specifically on the diffusion of RET, and these studies consider almost ex‐
clusively Organisation for Economic Co‐operation and Development (OECD) economies. For ex‐
ample, Johnstone et al. (2010) use patent counts in a cross‐section of 25 OECD countries to show that public policies encourage innovation in RET. Also using patent‐based data, Popp et al. (2011) find that increased knowledge has a robust, albeit small, effect on renewable energy investments across 26 OECD countries. In contrast, we model and evaluate the adoption of RET across 108 developing countries between 1980 and 2010, assessing a wide range of potential drivers of, and barriers to, RET diffusion. As such, our study is related to recent work by Brunnschweiler (2010), who presents evidence of financial sector development having a positive effect on renewable en‐
ergy development, with special attention given to non‐OECD countries. Our study is different however, in that: we explicitly model the decision about whether or not to adopt RET; we focus
1 See Popp et al. (2010) for an excellent overview of this literature.
on non‐hydro power; and we consider the potential role of additional possible drivers of RET adoption – including specific energy policies, the energy mix, trade and the official development assistance (ODA) provided.
Second, we first propose and then use an econometric approach to deal with two methodo‐
logical problems in this area of study that have been somewhat overlooked so far. The main problem is the large number of zero‐valued observations included in our dependent variable, be‐
cause many countries do not yet, or have only recently begun to, invest in (non‐hydro) renewable electricity production. Moreover, we might have a potential sample selection problem – the zero‐
valued observations may reflect either no investment in RET or the fact that off‐grid electricity production is not included in the available data, and thus may differ systematically from the pos‐
itive values of the potential outcome.2 We deal with these two methodological issues by using two‐stage estimation methods, in which we explicitly model the choice of whether or not to adopt RET as well as the decision about the amount of electricity to produce from renewable en‐
ergy sources. To this end, we employ both the two‐part model (2PM) of Duan et al. (1984) and Heckman’s (1979) two‐step selection model (TSM).
We find that the diffusion of non‐hydro renewable energy (NHRE) technologies for electricity generation accelerates with the implementation of economic and regulatory instruments, higher per capita income and schooling levels and with stable, democratic regimes. In contrast, increas‐
ing trade intensity, higher levels of foreign direct investment (FDI) and ODA, institutional and strategic policy support programs, growth in electricity consumption and a high level of fossil fuel production appear to delay the diffusion of NHRE. Furthermore, we find that a large share of hydropower lowers the probability of NHRE being adopted but nevertheless stimulates the amount of NHRE electricity produced, while the opposite is true when there is a diverse energy mix. Finally, we find weak support for a positive influence of the Kyoto Protocol on NHRE diffu‐
sion and no evidence at all for any influence resulting from financial sector development.
The remainder of this paper is organized as follows: In Section 2 we present some stylized facts regarding the role of RET in global electricity production, and we discuss our data in rela‐
tion to the existing literature dealing with the factors that determine technological adoption. In Section 3 we introduce and specify our empirical methodology. Section 4 presents the baseline results of our analysis. In Section 5 we provide additional results, with special attention given to the general drivers of technology adoption and to the role of the energy mix. Section 6 summa‐
rizes and concludes by offering some suggestions for possible future research in this field.
2 Data, Background and Stylized Facts
As a measure of RET adoption – our dependent variable – we use electricity generation measured in the amount of kilowatt‐hours (kWh) per capita obtained from the following renewable re‐
2 Off‐grid electricity production from renewable sources is potentially important, given the installation of isolated photovoltaic (PV) of mini‐hydro systems in remote rural areas.
8 Birte Pohl and Peter Mulder: Explaining the Diffusion of Renewable Energy Technology in Developing Countries
WP 217/2013 GIGA Working Papers
sources: biomass, geothermal, solar, and wind. We exclude hydroelectric power generation from our definition, because large hydropower projects are increasingly viewed as being unsustainable sources of power generation due to their often serious negative environmental and social exter‐
nalities.3 Also, we exclude (traditional) biomass because of its negative impact on agricultural (food) production, as demonstrated by the rising price of grain as well as of other foodstuffs. We use data on electricity generation from non‐hydroelectric sources provided by the United States Energy Information Administration (EIA) for the period 1980–2010. While the EIA data can be considered to be comprehensive, electricity generation may be underestimated, as off‐grid activi‐
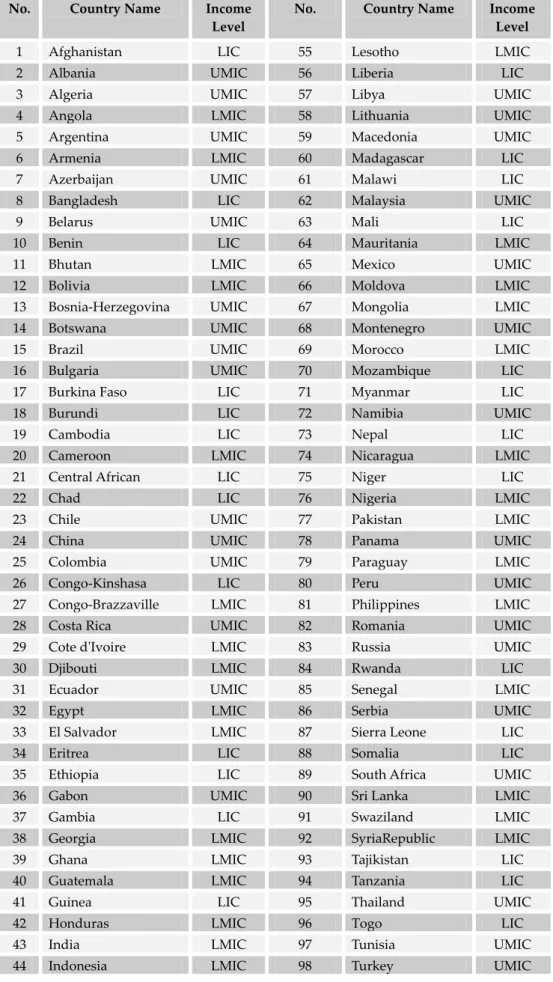
ties do not seem to be included in the data. We use data for 108 developing countries (see Ap‐
pendix, Table A1).
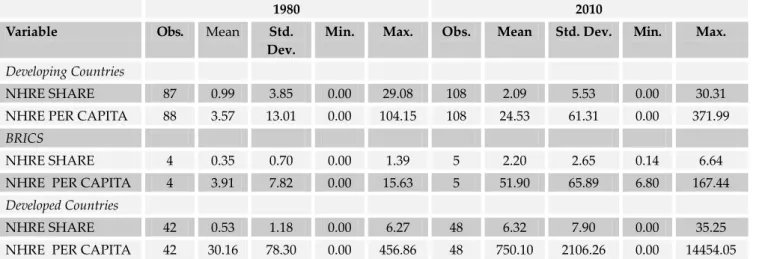
Table 1: Summary Statistics on Non‐Hydroelectric Renewable Electricity (NHRE) Generation
1980 2010
Variable Obs. Mean Std.
Dev.
Min. Max. Obs. Mean Std. Dev. Min. Max.
Developing Countries
NHRE SHARE 87 0.99 3.85 0.00 29.08 108 2.09 5.53 0.00 30.31
NHRE PER CAPITA 88 3.57 13.01 0.00 104.15 108 24.53 61.31 0.00 371.99
BRICS
NHRE SHARE 4 0.35 0.70 0.00 1.39 5 2.20 2.65 0.14 6.64
NHRE PER CAPITA 4 3.91 7.82 0.00 15.63 5 51.90 65.89 6.80 167.44
Developed Countries
NHRE SHARE 42 0.53 1.18 0.00 6.27 48 6.32 7.90 0.00 35.25
NHRE PER CAPITA 42 30.16 78.30 0.00 456.86 48 750.10 2106.26 0.00 14454.05
* Developing Countries’ Statistics including the BRICS countries.
Source: Authors’ calculations based on EIA (2012).
According to the 2012 report Global Energy Assessment – Toward a Sustainable Future, the contribu‐
tion of RET (including hydropower) to the world’s electricity generation in 2010 was roughly 3,800 terawatt‐hours (TWh), equivalent to about 19 percent of total global electricity consump‐
tion. Renewable power capacity additions now represent more than one‐third of all global power capacity additions (GEA 2012). Based on our data, Table 1 presents key statistics regarding the growth of NHRE between 1980 and 2010. It is evident that the share of NHRE in total electricity production in developing countries is small but rapidly increasing: since 1980 it has more than doubled, and now comprises over 2 percent. Moreover, Table 1 shows that while Brazil, Russia, India, China and South Africa (BRICS) initially lagged behind they are now leading the group of developing countries. Figures 1 and 2 below illustrate that NHRE, especially during the last dec‐
ade, has experienced high annual growth rates, particularly in the BRICS countries. Finally, both
3 Unfortunately, our cross‐country dataset does not allow one to consistently distinguish between large and small hydropower projects.
the relatively high shares and growth rates of NHRE in developed countries demonstrate that the RET adoption process is, as previously noted, (still) being led by rich countries.
Figure 1: Share of NHRE in Total Electricity Production in Industrialized Countries, Developing Countries and BRICS, 1980–2010
Source: Authors’ calculations based on EIA (2012).
To identify the factors and barriers that may affect RET adoption, we make use of insights from both the broader economic literature as well as from the environmental and energy economics literature.4 One of the main stylized facts regarding technological change is that new technologies often initially complement older technologies, and only subsequently – and often slowly – re‐
place older technologies (see, for example, Dosi 1997; Gruebler et al. 1999; Mokyr 1990; Rosen‐
berg 1982; Ruttan 2001; Stoneman 2002; Young 1993). The gradual nature of this technology diffu‐
sion can be explained from the fact that technologies differ not only in terms of their productivity (vertical dimension), but also with respect to other qualities (horizontal dimension). Consequent‐
ly, agents face returns to diversity in that they explicitly attach value to using both new and old technologies at the same time.
4 For a review of the broader economic literature see, for example, Keller (2004) or Comin and Hobijn (2004). For a re‐
view of the technology adoption research in environmental and energy economics to date, see Popp et al. (2010).
10 Birte Pohl and Peter Mulder: Explaining the Diffusion of Renewable Energy Technology in Developing Countries
WP 217/2013 GIGA Working Papers
Figure 2: NHRE Per Capita Production (Measured in kWh) in Industrialized Countries, Developing Countries and BRICS, 1980–2010
Source: Authors’ calculations based on EIA (2012).
As regards the vertical dimension, broad historical evidence shows that new technologies tend to be initially inferior to more mature technologies due to the fact that they temporarily reduce ex‐
pertise and, thereby, capital productivity. This leads to the gradual adoption of new technologies, and results in the coexistence of old and new technologies – with the productivity of the new technology increasing over time through learning (see, for example, Arrow 1962; Clarke et al.
2006; David 1975; Isoarda and Soriab 2001; Jovanovich and Lach 1989; OECD/IEA 2000; Parente 1994). In our analysis we capture this feature in a stylized way by controlling for the level of hu‐
man capital, measured through secondary enrollment rates – therein assuming that the speed of learning for certain technologies is positively related to a more educated labor force in general.
Data is taken from the World Bank’s World Development Indicators (WDI).
The horizontal dimension of technological change refers to the fact that technologies differ in terms of required inputs (types of fuels or raw materials), plant location, plant size or managerial and organizational skills. A good example of this can be found in the electricity sector, where hy‐
dropower, unlike thermal power, is characterized by relatively high fixed costs but low variable costs (Von der Fehr and Sandsbråten 1997). These kind of considerations lead to a mix of interde‐
pendent and thus complementary technologies, with agents continually investing in the im‐
provement of distinct pieces of the whole technological puzzle – instead of replacing the whole thing at once (see, for example, Antonelli 1993; Colombo and Mosconi 1995; Jovanovic and Stoly‐
arov 2000;Milgrom et al. 1991; Mulder et al. 2003).
This “love of variety” may affect RET adoption for other reasons besides the return to tech‐
nical diversity. For example, a dominant share being held by a competing technology can signal that underlying vested interests of particular subgroups exist in the economy, who may engage in efforts intended to keep the old technology in place – as (large‐scale) RET adoption would re‐
duce their expertise and rents (see, for example, Canton et al. 2002; Krusell and Ríos‐Rull 1996;
Mokyr 1992). To capture these mechanisms, we control our regressions for the diversity of a country’s energy mix according to:
1 (1)
where is the share of each source of energy type in country in year . The index takes a value of zero if a country produces its energy from only one source of energy, and converges to one the more diversified a country is. We include data in the index about energy production from coal, gas, nuclear and hydropower in quadrillion British thermal units (BTU), again taken from the EIA. We relate each source of energy to the total amount of energy produced from them, and exclude the shares of non‐hydropower energy sources – in order to rule out any potential en‐
dogeneity problems.
Evidently, (changes in) the energy mix used for power production can influence NHRE diffu‐
sion in several different ways. First, if countries already make extensive use of nuclear power or hydropower, their relatively low carbon intensity is likely to diminish the incentives for investing in RET (Popp et al. 2011). Since the use of nuclear power is almost exclusively limited to devel‐
oped countries, we control for this mechanism through the inclusion of a country’s share of hy‐
dropower. Data is taken from the aforementioned EIA database. Second, on the basis of the as‐
sumption that energy markets function well, the actual energy mix reflects the relative costs of the competing energy sources, which obviously affects the attractiveness of RET. Unfortunately, country‐specific prices for electricity produced from different sources are not available. For many developing countries no data on electricity prices is available, while for a relatively small sub‐
sample of them the only available data is overall electricity prices – which are clearly endoge‐
nous, since they include the price of renewable electricity production (ibid.). Instead, we include in our regressions the per capita production of coal and natural gas, assuming that they influence relative energy prices. Data is again taken from the EIA, and measured in quadrillion BTUs per 1 million people. Clearly, the local abundance of any energy resource endowment will drive down its domestic price. In addition, non‐renewable resource abundance is expected to slow down the adoption of RET by reducing concerns about energy security and by undermining support for stringent emission reduction policies (ibid.).
Despite the absence of any binding agreements on reducing carbon emissions, developing countries are increasingly implementing policies to promote the adoption of RET. According to the IEA/IRENA Global Renewable and Energy Policies and Measures Database in late 2012, be‐
tween 1980 and 2010 27 developing countries implemented such policies in the electricity sector.
These included the use of economic and regulatory instruments (auditing, codes and standards), policy support (institutional creation, strategic planning), as well as voluntary approaches and
12 Birte Pohl and Peter Mulder: Explaining the Diffusion of Renewable Energy Technology in Developing Countries
WP 217/2013 GIGA Working Papers
support for information and education. The latter are less common policy practices in developing countries, with most attention going to economic instruments such as direct investments (e.g. in infrastructure), fiscal and financial incentives and market‐based initiatives – like allowances for greenhouse gas (GHG) emissions or green certificates. In many cases, more than one of each type of policy has been implemented over time, while the renewable energy policies target biomass, geothermal, solar and wind – as well as the inclusion of multiple renewable energy sources.
The question of which type(s) of environmental regulation will have a measurable impact on technological change in support of more environmentally friendly production is empirically open (Del Río González 2009). In our regressions we first examine the effects of RET policy measures using an aggregate RET policy variable (RE policy), based on the IEA/ IRENA Global Renewable and Energy Policies and Measures database. This dummy variable takes a value of one if a coun‐
try has implemented any of the above‐described policies, measured from the first year of imple‐
mentation onward; otherwise, it takes a value of zero. Second, we consider the most important policy measures in our country sample independently, in other words economic and regulatory instruments and policy support. Finally, we control for the potential impact of the Kyoto Protocol by including a time dummy from 1998 onward (given its adoption in late 1997).
In addition, we consider in our regression analyses the role of trade and FDI. In general, in‐
creasing trade linkages are expected to accelerate knowledge diffusion – via high‐tech imports, joint ventures or increasing international competition (see, for example, Alcalá and Ciccone 2004;
Coe and Helpman 1995; Comin and Hobijn 2004; Del Río González 2009). However, in the case of a highly regulated production factor like energy, trade might also induce countries to “race to the bottom” – whereby a country weakens regulations and/or decreases energy prices in order to ex‐
ploit its comparative advantages (Copeland and Taylor 2004). Hence, the extent to which trade and FDI facilitate the international transfer of RET is expected to depend on a variety of local characteristics – including physical and human capital endowments, capital–skill complementari‐
ties, environmental stringency and (cultural) distance from the trading partner. We measure trade intensity as the sum of exports and imports of goods and services as a percentage of the gross domestic product (GDP), and FDI in terms of FDI net inflows as a percentage of GDP – with data taken from the WDI.
Due to the relatively high upfront costs of most RET, having access to finance is considered to be an important prerequisite for their adoption (Brunnschweiler 2010). In addition, we expect that ODA stimulates RET adoption, given the fact that one of the core areas of the ODA strategy for energy efficiency has for a long time been the push for the introduction of renewable energy usage (Martin 1996). To account for the role of access to capital, we include in our analyses the degree of local financial sector development, measured by the ratio of deposit money bank assets to central bank assets (ASSETS) – which reflects the importance of commercial banks as com‐
pared to central banks. We control per country for net ODA, as a percentage of gross national in‐
come (GNI). In both cases data is taken from the WDI.
Finally, RET are expected to increase with higher levels of economic development, because, among other things, the latter implies more private and public financial resources, increasing en‐
vironmental awareness and growing electricity demand (Del Río González 2009; Plassmann and Khanna 2006; Popp et al. 2011). We therefore add to our control variables GDP per capita and growth of per capita electricity consumption, with the latter foreseen to capture expectations about future electricity demand. Data is taken from the WDI, with GDP measured in constant 2005 USD.
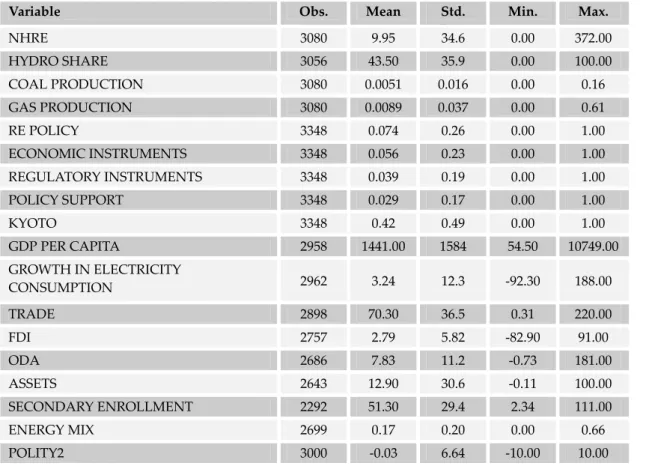
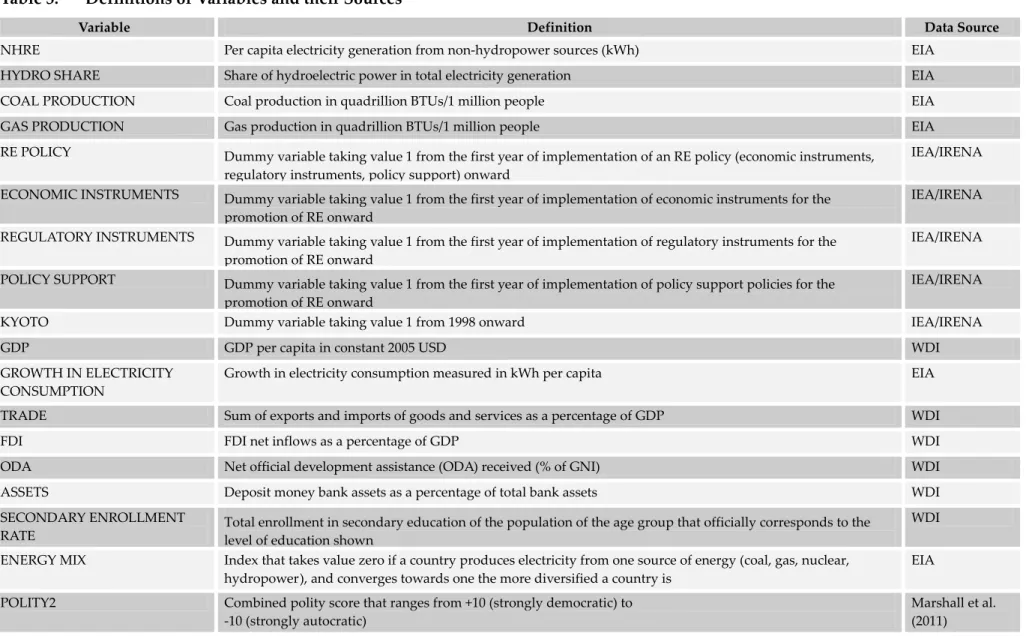
Table 2 presents the descriptive statistics of the variables used in our study, while Table 3 summa‐
rizes the definitions of and sources for these variables.
Table 2: Summary Statistics, 1980–2010
Variable Obs. Mean Std.
D
Min. Max.
NHRE 3080 9.95 34.6 0.00 372.00
HYDRO SHARE 3056 43.50 35.9 0.00 100.00
COAL PRODUCTION 3080 0.0051 0.016 0.00 0.16
GAS PRODUCTION 3080 0.0089 0.037 0.00 0.61
RE POLICY 3348 0.074 0.26 0.00 1.00
ECONOMIC INSTRUMENTS 3348 0.056 0.23 0.00 1.00
REGULATORY INSTRUMENTS 3348 0.039 0.19 0.00 1.00
POLICY SUPPORT 3348 0.029 0.17 0.00 1.00
KYOTO 3348 0.42 0.49 0.00 1.00
GDP PER CAPITA 2958 1441.00 1584 54.50 10749.00
GROWTH IN ELECTRICITY
CONSUMPTION 2962 3.24 12.3 ‐92.30 188.00
TRADE 2898 70.30 36.5 0.31 220.00
FDI 2757 2.79 5.82 ‐82.90 91.00
ODA 2686 7.83 11.2 ‐0.73 181.00
ASSETS 2643 12.90 30.6 ‐0.11 100.00
SECONDARY ENROLLMENT 2292 51.30 29.4 2.34 111.00
ENERGY MIX 2699 0.17 0.20 0.00 0.66
POLITY2 3000 ‐0.03 6.64 ‐10.00 10.00
Source: Authors’ calculations based on data as summarized in Table 3.
Table 3: Definitions of Variables and their Sources
Variable Definition Data Source
NHRE Per capita electricity generation from non‐hydropower sources (kWh) EIA
HYDRO SHARE Share of hydroelectric power in total electricity generation EIA
COAL PRODUCTION Coal production in quadrillion BTUs/1 million people EIA
GAS PRODUCTION Gas production in quadrillion BTUs/1 million people EIA
RE POLICY Dummy variable taking value 1 from the first year of implementation of an RE policy (economic instruments, regulatory instruments, policy support) onward
IEA/IRENA
ECONOMIC INSTRUMENTS Dummy variable taking value 1 from the first year of implementation of economic instruments for the promotion of RE onward
IEA/IRENA
REGULATORY INSTRUMENTS Dummy variable taking value 1 from the first year of implementation of regulatory instruments for the promotion of RE onward
IEA/IRENA
POLICY SUPPORT Dummy variable taking value 1 from the first year of implementation of policy support policies for the promotion of RE onward
IEA/IRENA
KYOTO Dummy variable taking value 1 from 1998 onward IEA/IRENA
GDP GDP per capita in constant 2005 USD WDI
GROWTH IN ELECTRICITY CONSUMPTION
Growth in electricity consumption measured in kWh per capita EIA
TRADE Sum of exports and imports of goods and services as a percentage of GDP WDI
FDI FDI net inflows as a percentage of GDP WDI
ODA Net official development assistance (ODA) received (% of GNI) WDI
ASSETS Deposit money bank assets as a percentage of total bank assets WDI
SECONDARY ENROLLMENT
RATE Total enrollment in secondary education of the population of the age group that officially corresponds to the level of education shown
WDI
ENERGY MIX Index that takes value zero if a country produces electricity from one source of energy (coal, gas, nuclear, hydropower), and converges towards one the more diversified a country is
EIA
POLITY2 Combined polity score that ranges from +10 (strongly democratic) to
‐10 (strongly autocratic)
Marshall et al.
(2011) Source: Authors’ calculations.
Methodology
As noted, our dependent variable (NHRE per capita) features two important and interrelated characteristics. First, about 71 percent of the observations of our dependent variable are zero‐
valued, because a large proportion of countries did not invest in NHRE in certain years – often these were the early years, although sometimes they cover the whole sample period. Second, our dependent variable is heavily right‐skewed (skewness: 5.83) and has considerable non‐normal kurtosis (kurtosis: 45.42). Taking logs reduces the skewness (‐1.19) and the kurtosis (4.89), and yields a dependent variable which is more normally distributed – this also, however, reduces the number of included observations considerably, because of the large number of zero‐values.
To resolve these methodological issues, one possibility would be to follow an ad hoc ap‐
proach and to limit estimation to non‐zero‐valued observations, or to arbitrarily add a small posi‐
tive constant to the dependent variable – methods that have all been commonly used in the trade literature (cf. Linders and de Groot 2006). Instead, though, we have decided to apply a methodo‐
logical strategy that is designed to deal with a large percentage of zero‐valued observations. In this context, model selection very much depends on the kind of zeros appearing in our dataset.
Frondel and Vance (2012) distinguish between exogenous censoring, true zeros and missing data.
In the case of exogenous censoring, the dependent variable can be negative in principle but is on‐
ly observed at zero or positive values. True zeros can be defined as actual outcomes that are fully observed and that can be characterized as corner solutions. Potential zero observations may arise because of missing data, and refer to latent variables that are only partially observed (Dow and Norton 2003). We may assume that the zero‐valued observations of our dependent variable are true zeros, but we cannot rule out the possibility that some zero‐valued observations are missing observations for the potential outcome, caused by the fact that off‐grid electricity production is not included in the data. If these missing observations differ systematically from the positive val‐
ues of the potential outcome, a sample selection problem has to be addressed (Ibid.).
For these reasons, we apply a two‐stage estimation method, using both the two‐part model (2PM) of Duan et al. (1984) and the two‐step selection model (TSM) of Heckman (1979).5 The 2PM allows for different mechanisms that generate both zero‐valued observations and positive out‐
comes. The methodology herein consists of estimating a first equation for the sample of zero‐
valued and positive outcomes and a second equation for the subset of positive observations (Dow and Norton 2003). In our case, the underlying assumption of the 2PM is that the decision to invest in NHRE and the amount of NHRE produced are independent of each other. Equation 2 denotes the probability (PR) of a positive outcome of the dependent variable NHRE:
∗ 1 0 Φ (2)
where j denotes the country (j=1‐108) and t the time period (t=1‐30). The dummy variable NHRE*
equals one if the outcome variable NHRE is larger than zero, and zero otherwise. The vector of
5 The Tobit model is the standard estimation method used in the case of exogenous censoring (Frondel and Vance 2012). An important underlying assumption of this censored regression model is that the same probability mecha‐
nism generates both the zero‐valued observations and the positive outcomes of the data.
16 Birte Pohl and Peter Mulder: Explaining the Diffusion of Renewable Energy Technology in Developing Countries
WP 217/2013 GIGA Working Papers
control variables is given by , while is the disturbance term and Φ the standard normal dis‐
tribution. In Equation 2 we use the log of NHRE as the dependent variable. The mean outcome, conditional on being positive, is defined as:
ln NHRE (3)
with an error term and 0.
In contrast to the 2PM, the TSM assumes that the decision to adopt NHRE and the amount of NHRE produced are not independent from each other. This assumption is valid in the case of sample selection and combines a first‐stage selection model and a second‐stage outcome regres‐
sion. The TSM is also a probit estimator of having a positive outcome, and determines whether a country produces electricity from NHRE or not (see Equation 2). The outcome regression is an OLS estimator for positive observations, identifying how much electricity a country produces from non‐hydroelectric sources:
ln 0, β . (4)
In Equation 4, represents the inverse Mills’ ratio coefficient, while denotes the inverse Mills’
ratio that gives the probability that an observation is included in the sample. It is calculated for each observation in the sample (Heckman 1979; Dow and Norton 2003) according to:
/Φ (5)
with and Φ as before. By including the inverse Mills’ ratio in the outcome equation the sample selection problem is solved.
In order to discriminate between the two methods, it is important to consider the distinction between the actual and potential outcomes of a variable (Dow and Norton 2003). The 2PM would be the preferred estimator if we were primarily interested in the determinants of actual rather than potential investments in NHRE and assumed no sample selection problem – in other words, if we assumed that zero‐valued observations are true zeros and not missing data. The underlying reason is that in this case the interpretation of the TSM results tends to be complex since the TSM addresses the sample selection problem of potential outcomes (Ibid.). However, as previously ar‐
gued, since we indeed expect a possible sample selection bias in our data, the TSM appears to be the appropriate one to use. The TSM is in principle also identified if the same regressors appear in the selection and outcome equation, due to the fact that the inverse Mills’ ratio introduces non‐
linearity in the functional form of the selection equation. However, the latter may cause the re‐
sults to suffer from multicollinearity, implying large standard errors as well as a skewed t‐
statistic for the inverse Mills’ ratio. Since the latter is commonly used to determine the appropri‐
ate model (Leung and Yu 1996), this may impede satisfactory discrimination between the TSM and the 2PM.
To overcome this problem, in the context of our study an exclusion restriction that determines the probability of adopting NHRE, but not the decision about how much NHRE to produce, is warranted. To this end, we use POLITY2 from the annual Polity IV time‐s, a widely used com‐
bined polity score that ranges from +10 (strongly democratic) to ‐10 (strongly autocratic). In very general terms, democracy is determined in terms of the presence (or not) of institutions as well as
of procedures that enable citizens to express their preferences about policies and leaders, the ex‐
istence of institutional limitations on the power of the executive and the guarantee of political participation (Marshall et al. 2011). Our use of this index is based on the idea that a stable, demo‐
cratic regime, sustained by high quality institutions, is positively correlated with a business‐
friendly environment and confidence in the enforcement and sustainment of (environmental) regulations and policies.6 The literature has suggested various mechanisms that might explain this positive association, including the observations that political liberalization often enhances both economic liberalization and financial stability and that more open political systems allow policy‐
makers to better balance the interests of different groups in society, including private investors (De Haan et al. 2006; De Vanssay and Spindler 1994; Feng 2001; Pastor 1995; Seldadyo et al. 2007).
In this way a healthy institutional and business environment is clearly likely to increase the probability of RET being adopted, because it stimulates investment in general while at the same time not influencing the decision about how much electricity to produce from RET – the latter de‐
pends more on specific market conditions (see Section 2). This argument is supported by our da‐
ta: the pairwise correlation between POLITY2 and the dummy for NHRE adoption is 0.36, while it is 0.16 between POLITY2 and the amount of NHRE produced. At the same time, the latter de‐
mands the careful comparison of results obtained from the various models. As will be elaborated upon in Section 4, it is reassuring that the main findings of our analysis are very robust across the use of the 2PM and the TSM, and with the exclusion restriction.
4 Baseline Results
In this section we present the results of the estimations of our 2PM and TSM models, which were carried out by following the methodology outlined in the previous section. For all specifications, we not only show the estimated coefficients but also the implied average marginal effects. In the probit model, marginal effects measure the effect of a one‐unit change in the explanatory varia‐
bles on the probability that a country adopts NHRE when all other control variables are set at their means. In contrast, the coefficients of the linear specification – the outcome equation with the amount of NHRE produced (in logs) as the dependent variable – cannot be simply interpret‐
ed as marginal effects in a two‐stage model. Frondel and Vance (2010) show that the marginal ef‐
fects of the actual outcome of the 2PM include the estimation results of both the probit as well as the linear specification. In a similar vein, Sigelman and Zeng (1999) argue that the effect of the explanatory variables is a compound of the effect on the selection and the outcome equation of the TSM when these variables appear in both equations. Hence, in order to identify the marginal effects as well as their level of significance in the log‐linear part of both the 2PM and the TSM, we predict our dependent variable based on two parts. The first takes into account the decision to
6 Please note that we, unfortunately, could not make use of the World Bank’s Doing Business data, since it has only been available as of 2004, and its rankings are thus only available for recent years.
18 Birte Pohl and Peter Mulder: Explaining the Diffusion of Renewable Energy Technology in Developing Countries
WP 217/2013 GIGA Working Papers
adopt NHRE, while the second is the conditional expectation. The standard errors in the margin‐
al effects are calculated by using bootstrap errors.
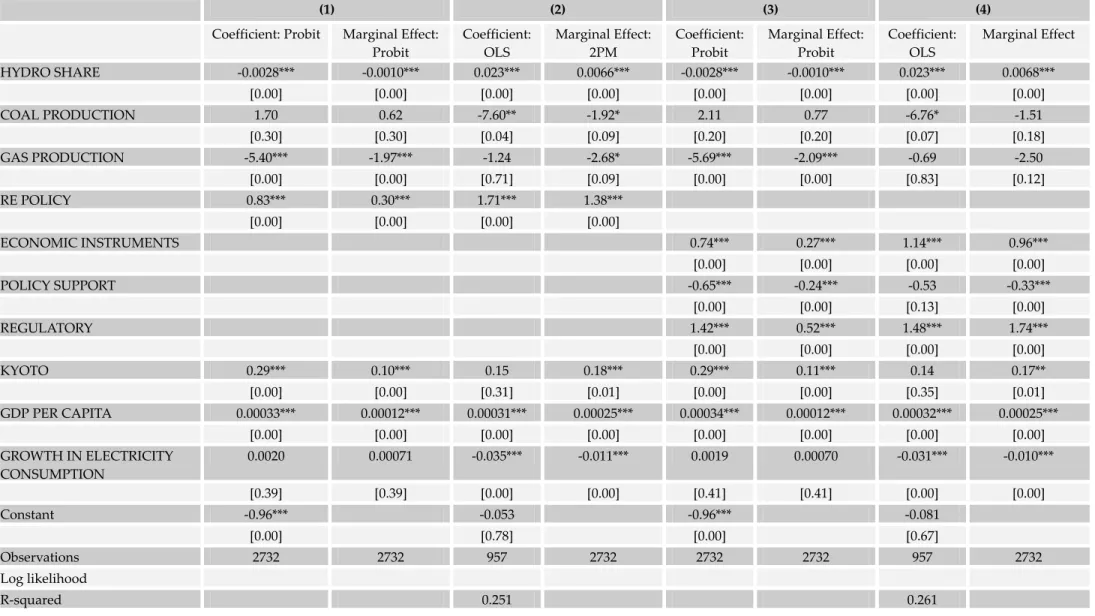
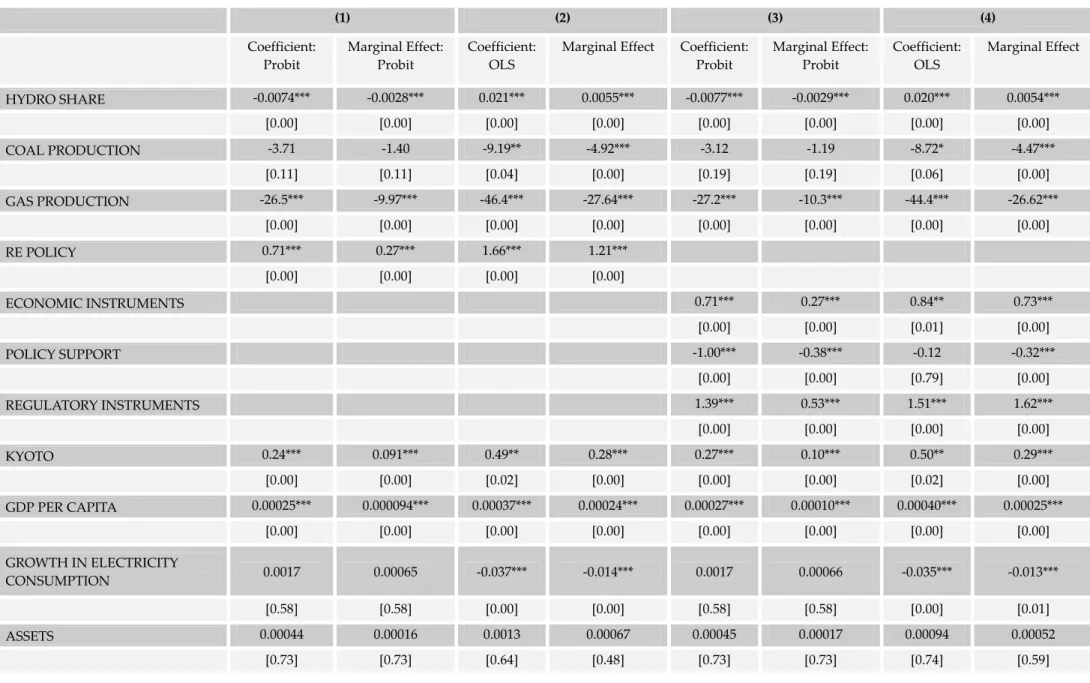
Table 3 presents pooled regression results for the probit and linear specification of the 2PM.7 From columns 1 and 3 in Table 3 it can be seen that the probability of NHRE adoption decreases in a statistically significantly manner with an increase in the share of hydropower and higher per cap‐
ita gas production, confirming our hypothesis that the relatively low carbon intensity of these coun‐
tries is indeed likely to diminish the incentives for investing in RET (Popp et al. 2011). In contrast, the probability of NHRE adoption increases in a statistically significantly manner with a higher per capita income and with renewable energy policies in place. As regards the latter, the probability of investment in NHRE production has been about 0.1 points higher since the adoption of the Kyoto Protocol in late 1997 and 0.3 points higher for countries with RE policies as compared to those countries without (p<0.01). When we specify these RE policies (column 3), we find that countries that have implemented economic or regulatory instruments show a 0.27 and 0.52 points higher probability to invest in NHRE production respectively. Remarkably, the variable “policy support”
has a negative marginal effect on the adoption decision. This suggests that, in contrast to the use of economic or regulatory instruments, giving attention to institutional creation and strategic plan‐
ning has a counterproductive effect on the diffusion of RET – we will return to this issue below. Fi‐
nally, the results show that the adoption decision is neither affected by per capita coal production nor by growth in per capita electricity consumption. The latter suggests that expectations about fu‐
ture electricity demand apparently do not underlie the decision to adopt RET.
As compared to the probit model, the linear specification in Table 3 (columns 2 and 4) com‐
prises a relatively small number of observations – confirming that still only a limited number of countries produce renewable grid electricity from non‐hydro sources.8 In sum, we find a positive and statistically significant marginal effect for the impact of the share of hydropower on the amount of NHRE produced: a 1 percent increase in the share of hydropower implies about a 0.7 percent increase in NHRE production. In contrast, the relationship between the level of fossil fuel production and NHRE production is negative, although the effect becomes largely statistically insignificant in the second specification (column 4). A cautious conclusion may be that hydro‐
power acts as a complement to NHRE once the latter has been adopted, while fossil fuel technol‐
ogies act as substitutes for NHRE.
7 We refrain from accounting for unobserved heterogeneity by using a fixed effects estimator, because of the methodo‐
logical problems associated with this – such as the incidental parameters problem or the issue of perfect prediction of the selection variable (see Cameron and Trivedi 2005). By using a palatable number of country‐specific control varia‐
bles, as well as explanatory variables related to the (renewable) energy sector, we expect the capture of most of the het‐
erogeneity across countries. We also tested for the joint relevance of year effects, but they are not significant in our specifications. Hence, our results are not driven by factors that affect NHRE production in all countries over time in an equal way. We tested the sensitivity of our findings by excluding the more developed BRICS countries.
8 The OLS estimates and the marginal effects of the linear model rest upon divergent samples – the first are based on a subsample of countries investing in RET, the latter are based on the complete sample (as we have to account for the decision to adopt RET). This is also the case for the TSM, as presented later in this section; see Frondel and Vance (2010) for a discussion of this.
In addition, with the exception of the role of the Kyoto Protocol, we find that the effect of re‐
newable energy policies on the amount of NHRE produced is largely consistent with the effect of these policies on the decision to adopt RET: the use of economic and regulatory instruments posi‐
tively influences the amount of NHRE produced, while the opposite is again true for policy sup‐
port (institutional creation and strategic planning). More precisely, countries with renewable en‐
ergy policies produce on average about 1.4 percent more NHRE than do countries without such policies, whereby the effect of regulatory instruments appears to be stronger than that of economic instruments. In contrast to the adoption decision, the Kyoto Protocol appears to have thus far played only a minor role in the choice about the amount of NHRE to produce. However, similar to the adoption decision, higher per capita income also stimulates the amount of NHRE pro‐
duced, although the effect is small. In contrast to the probit estimation, in the linear model we find that growth in per capita electricity consumption has statistically significant negative mar‐
ginal effects on the amount of NHRE produced. This finding is similar to that of Popp et al.
(2011), who also found growth in electricity consumption to have a negative – although not statis‐
tically significant – effect on the presence of different non‐hydropower sources of renewable en‐
ergy. Apparently, if future electricity demand is expected to increase considerably, countries tend to focus on alternatives to non‐hydro sources for the production of their electricity.
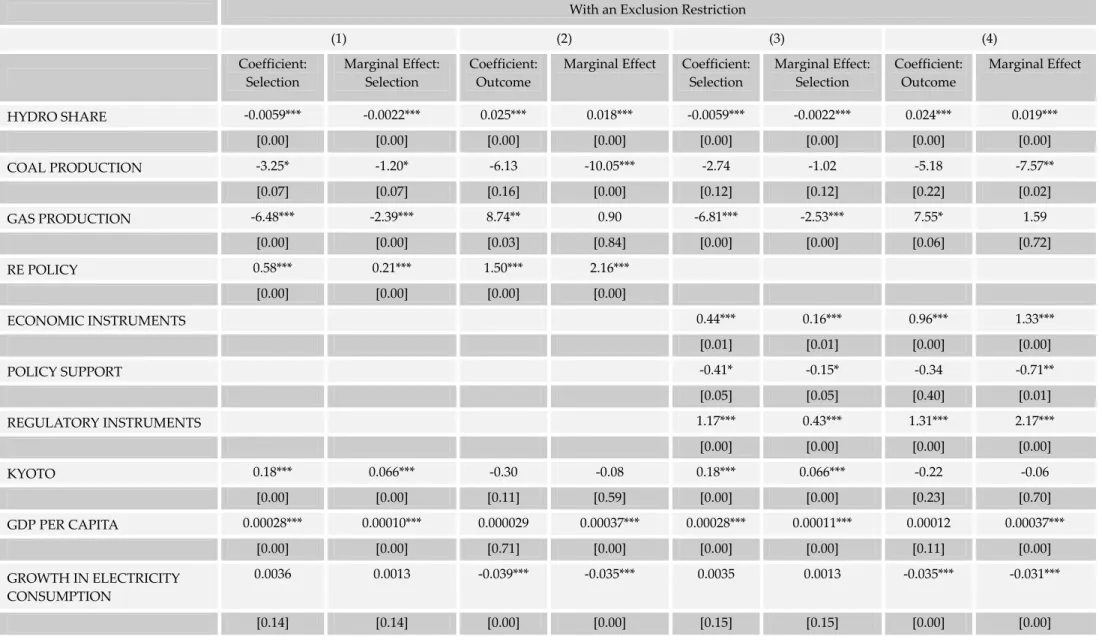
Next, in Table 4, we present the results of using the TSM, first without an exclusion restriction (Table 4a) and then with an exclusion restriction (Table 4b). Before discussing the regression re‐
sults in more detail we should make a few general observations about the model results. First, we refrain from presenting the results of the selection equation as they are identical to those of the probit models presented in Table 3. Second, in the model without an exclusion restriction the dif‐
ferences between coefficients and marginal effects – both in terms of their magnitude and statisti‐
cal significance – underscore the importance of taking into account the decision about whether or not to adopt NHRE when interpreting the results of the outcome equation. Third, the high condi‐
tion numbers of the regressors in both specifications of the TSM without an exclusion restriction (Table 4a) indicate that the results of this particular model type are likely to suffer from a multi‐
collinearity problem, thus yielding unstable estimates.9 To reduce this problem, we base our model identification not only on the non‐linearity of the inverse Mills’ ratio but also define an ex‐
clusion restriction by including the variable POLITY2, as discussed in the previous section (Table 4b).
Finally, it should be noted that in the specification without an exclusion restriction (Table 4a), the t‐
statistic of the inverse Mills’ ratio (lambda) – which is generally used to discriminate between the 2PM and the TSM – is significantly negative in the first specification (column 1), and insignificant in the second one (column 2). As regards the first specification, this suggests a sample selection problem as unobservable factors that reduce the probability of NHRE being adopted also seem to reduce the amount of NHRE produced.
9 In both specifications of the TSM without an exclusion restriction (columns 1 and 2) the condition numbers are be‐
tween 44 and 50, and therefore far above the threshold of 20 suggested by Leung and Yu (1996).
Table 4: Regression Results of the 2PM
(1) (2) (3) (4)
Coefficient: Probit Marginal Effect:
Probit
Coefficient:
OLS
Marginal Effect:
2PM
Coefficient:
Probit
Marginal Effect:
Probit
Coefficient:
OLS
Marginal Effect
HYDRO SHARE ‐0.0028*** ‐0.0010*** 0.023*** 0.0066*** ‐0.0028*** ‐0.0010*** 0.023*** 0.0068***
[0.00] [0.00] [0.00] [0.00] [0.00] [0.00] [0.00] [0.00]
COAL PRODUCTION 1.70 0.62 ‐7.60** ‐1.92* 2.11 0.77 ‐6.76* ‐1.51
[0.30] [0.30] [0.04] [0.09] [0.20] [0.20] [0.07] [0.18]
GAS PRODUCTION ‐5.40*** ‐1.97*** ‐1.24 ‐2.68* ‐5.69*** ‐2.09*** ‐0.69 ‐2.50
[0.00] [0.00] [0.71] [0.09] [0.00] [0.00] [0.83] [0.12]
RE POLICY 0.83*** 0.30*** 1.71*** 1.38***
[0.00] [0.00] [0.00] [0.00]
ECONOMIC INSTRUMENTS 0.74*** 0.27*** 1.14*** 0.96***
[0.00] [0.00] [0.00] [0.00]
POLICY SUPPORT ‐0.65*** ‐0.24*** ‐0.53 ‐0.33***
[0.00] [0.00] [0.13] [0.00]
REGULATORY 1.42*** 0.52*** 1.48*** 1.74***
[0.00] [0.00] [0.00] [0.00]
KYOTO 0.29*** 0.10*** 0.15 0.18*** 0.29*** 0.11*** 0.14 0.17**
[0.00] [0.00] [0.31] [0.01] [0.00] [0.00] [0.35] [0.01]
GDP PER CAPITA 0.00033*** 0.00012*** 0.00031*** 0.00025*** 0.00034*** 0.00012*** 0.00032*** 0.00025***
[0.00] [0.00] [0.00] [0.00] [0.00] [0.00] [0.00] [0.00]
GROWTH IN ELECTRICITY CONSUMPTION
0.0020 0.00071 ‐0.035*** ‐0.011*** 0.0019 0.00070 ‐0.031*** ‐0.010***
[0.39] [0.39] [0.00] [0.00] [0.41] [0.41] [0.00] [0.00]
Constant ‐0.96*** ‐0.053 ‐0.96*** ‐0.081
[0.00] [0.78] [0.00] [0.67]
Observations 2732 2732 957 2732 2732 2732 957 2732
Log likelihood
R‐squared 0.251 0.261
p‐values in brackets; * p<0.10, ** p<0.05, *** p<0.01 Source: Authors’ own calculations.
For these reasons, we focus our discussion on the results of the model with an exclusion re‐
striction, as presented in Table 4b. In general, the marginal effects of the TSM outcome equation are largely similar to those of the 2PM OLS specification presented in Table 3.10 In short, the TSM estimation results also suggest that the probability of NHRE being adopted increases as the im‐
portance of other clean energy resources (hydropower and natural gas) decreases, with the im‐
plementation of RE policies other than policy support and with higher per capita income. In ad‐
dition, the positive and statistically significant results for the exclusion variable POLITY2 support the hypothesis that the probability of NHRE being adopted is higher in stable democratic re‐
gimes, being sustained by high quality institutions. As regards the decision about how much electricity to produce from non‐hydro renewable energy sources, the TSM results also largely confirm our earlier findings: the amount of NHRE produced is positively related to the share of hydropower, to per capita income, to the implementation of RE policies other than policy support and to the Kyoto protocol (again with a stronger effect of regulatory instruments than of econom‐
ic instruments); it is negatively related to growth in electricity consumption. In contrast to the 2PM, our TSM results confirm a statistically significant negative relationship between per capita coal production and NHRE production – suggesting that coal abundance decreases the attrac‐
tiveness of the NHRE alternative, for example by (a combination of) raising the relative costs of NHRE, lowering energy security concerns and undermining support for stringent emission re‐
duction policies.
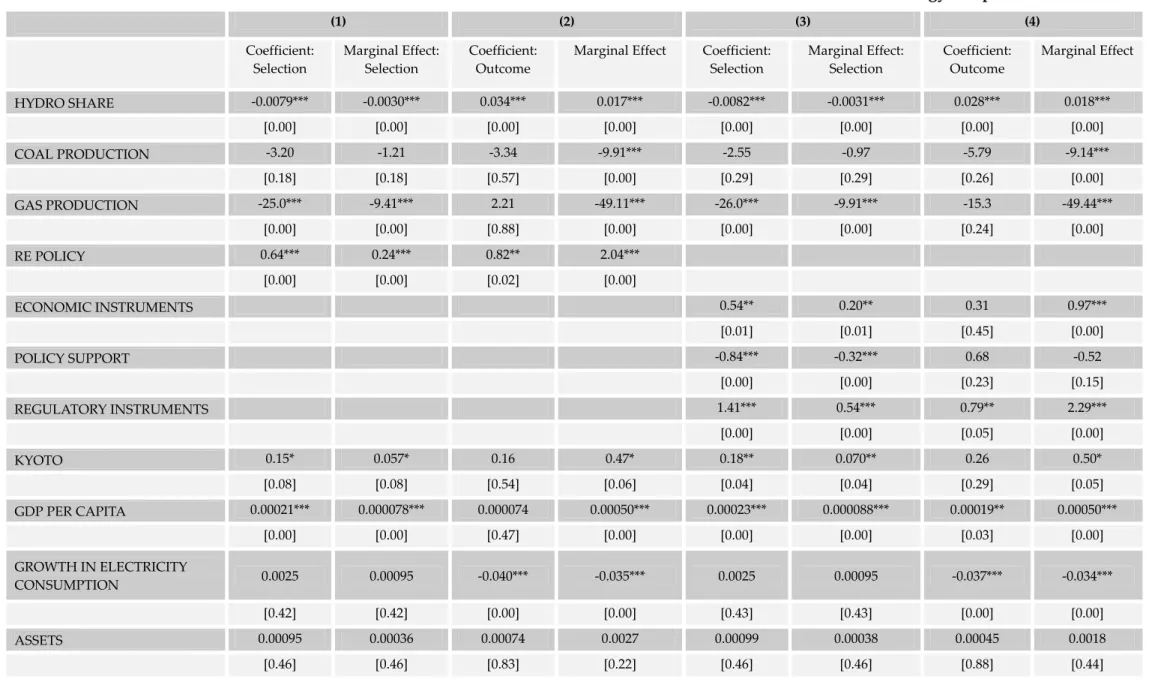
In Section 2 we revealed that within the group of developing nations the BRICS countries fea‐
ture particularly high annual growth rates for NHRE, and especially so during the last decade. It may therefore be the case that our results are driven primarily by developments in the BRICS countries. To control for this potential bias, we have re‐estimated our 2PM and TSM models for a sample that excludes these countries. The results from this exercise are presented in Tables A2 and A3 in the Appendix, and show that, in general, our findings appear to be very robust even with the exclusion of the BRICS countries. In both models the main difference is that their exclu‐
sion considerably strengthens the negative impact of fossil fuel abundance on NHRE diffusion.
10 Note that the marginal effects of the 2PM should be interpreted as the impact on the actual outcome, while in con‐
trast the marginal effects of the TSM relate to the potential outcome of our dependent variable.