Prospects for renewable energy in South Africa
Mobilizing the private sector
Anna Pegels
Bonn 2009
Pegels, Anna: Prospects for renewable energy in South Africa : mobilizing the private sector / Anna Pegels. – Bonn : DIE, 2009. – (Discussion Paper / Deutsches Institut für Entwicklungspolitik ; 23/2009)
ISBN: 978-3-88985-473-5
Dr. Anna Pegels, economist, is a research fellow at the German Development Institute/Deutsches Institut für Entwicklungspolitik (DIE). Her research focuses on economic aspects of climate change mitigation, in particular the transition to clean energy in developing countries.
E-mail: anna.pegels@die-gdi.de
© Deutsches Institut für Entwicklungspolitik gGmbH Tulpenfeld 6, 53113 Bonn
℡ +49 (0)228 94927-0 +49 (0)228 94927-130 E-mail: die@die-gdi.de http://www.die-gdi.de
Abbreviations
1 The challenge 3
2 South Africa in the face of climate change 5
3 South Africa’s contribution to climate change 7
4 The electricity sector 9
4.1 Structure of the South African electricity sector 9
4.2 Barriers to renewable energy 11
5 Promoting private-sector involvement in renewable energy 14
5.1 National measures 15
5.1.1 Renewable energy support schemes worldwide: an overview 15
5.1.2 The South African status quo 16
5.2 Further gaps and possible solutions 21
5.2.1 Creating public awareness and acceptance 23
5.2.2 Making use of international mechanisms 23
6 Conclusions 29
Bibliography 31
Box 1: Adverse incentives created by CDM rules – the case of HFC-23 24
Figures
Figure 1: Global energy-related emissions 1980–2030 4
Figure 2: Climate change impacts in North, East, South, West and Central Africa 6 Figure 3: Change in African agricultural yields by 2050 7 Figure 4: Uneven distribution of household expenditures – Lorenz curve for
South Africa, 1995 and 2005 8
Figure 5: South African mitigation options 2003–2050, Long-Term Mitigation
Scenario 9
Figure 6: Energy mix in South Africa 10
Figure 7: Renewable energy projects, lending cycle 12
Figure 8: Annual Solar Radiation South Africa 13
Figure 9: Global investments in renewable energy (2004–2008) 15
Figure 10: Geographical distribution of CDM projects 19
Tables
Table 1: Tariff schedule 2008–2013 in ZAR c/kWh (EUR c/kWh) 17
Table 2: Annual REFIT degression 18
Table 3: Revised REFIT rates 18
Table 4: External costs of electricity generation from coal (1999 Rand c/kWh) 20
ANC African National Congress
BMU Bundesministerium für Umwelt Naturschutz und Reaktorsicherheit
(Federal Ministry for the Environment, Nature Conservation and Nuclear Safety) CAIT Climate Analysis Indicators Tool
CDM Clean Development Mechanism CSP concentrating solar power
DEAT South African Department of Environmental Affairs and Tourism DLR Deutsches Zentrum für Luft- und Raumfahrt
DME South African Department of Minerals and Energy DNA Designated National Authority
GDP gross domestic product
HFC hydrofluorocarbon
IEA International Energy Agency
IPCC Intergovernmental Panel on Climate Change LTMS Long-Term Mitigation Scenario
MW megawatt
NAMAs nationally appropriate mitigation actions Nersa National Energy Regulator of South Africa ODA official development assistance
PV solar photovoltaic
REFIT Renewable Energy Feed-In Tariff SABS South African Bureau of Standards
SD-PAMs Sustainable Development Policies and Measures UNDP United Nations Development Programme UNEP United Nations Environment Programme
UNFCCC United Nations Framework Convention on Climate Change
USD US dollar
US EIA U. S. Energy Information Administration
WBGU Wissenschaftlicher Beirat der Bundesregierung Globale Umweltveränderungen (German Advisory Council on Global Change)
WRI World Resources Institute
ZAR South African rand
Summary
The challenge of transforming entire economies is enormous, especially if a country is as fos- sil-fuel-based and emission-intensive as South Africa. However, as it is already facing climate change impacts in an increasingly carbon-constrained world, South Africa must drastically reduce its greenhouse gas emission intensity soon.
The South African electricity sector is a vital part of the economy and at the same time con- tributes most to the emission problem. Transforming this sector is therefore urgently needed, but will be difficult. First steps have been taken to enhance energy efficiency and promote renewable energy, but they have failed to have any large-scale effects.
The two major barriers to investments in renewable energy technologies are based in the South African energy innovation system and its inherent power structures and in the econom- ics of renewable energy technologies. The innovation system is dominated by the state-owned Eskom (electricity) and Sasol (fuel) enterprises. Both companies have their core competencies in fossil fuel technologies. Capacity in renewable energy is lacking at every stage of the tech- nology cycle, from research and development to installation and maintenance.
The obstacles inherent in the economics of renewable energy technologies are cost and risk, two of the main factors in investment planning. As most technologies are in early stages of development, they have not yet realized their full cost degression potential and continue to entail a higher risk than established technologies.
To overcome these barriers, the South African government has introduced several renewable energy support measures, such as a renewable energy feed-in tariff (REFIT). While a promis- ing scheme in theory, the South African REFIT has a crucial flaw: Eskom is the monopsonis- tic buyer of electricity produced from renewable energy and is responsible for distributing it to consumers. However, Eskom is not obliged to buy that electricity. This runs counter to the investment security the REFIT scheme was intended to give renewable energy producers.
As a result, effective achievement on the ground continues to fall well short of the goals set in policy papers. While external financing, covering the additional costs for capacity-building and such policy measures as the REFIT, may be one part of the solution, the political will to reform the existing power structures in the electricity sector and to invest in the creation of a renewable energy market must form the other part.
1 The challenge
Climate change is one of this century’s most serious problems. The Fourth Assessment Report of the Intergovernmental Panel on Climate Change (IPCC) points to human activ- ity as one of the major causes of global warming. Business as usual may lead to a disas- trous transformation of the planet, and recent scientific findings emphasize the growing urgency of reducing greenhouse gas emissions (Meinshausen et al. 2009).
The parties to the climate negotiation process under the UN Framework Convention on Climate Change (UNFCCC) are struggling to find an agreement that may prevent danger- ous climate change. Yet the emission reduction proposals on the negotiating table are not strong enough to ensure that global warming stays at less than 2°C above the pre- industrial level. This rise is internationally recognized as the limit to manageable global warming. Anything more than this will increase the damage to the global ecosystem and the risk of abrupt and large-scale climate discontinuities, also known as tipping points.
Rapid and substantial emission reductions are vital, and they require a global structural change, mainly in the energy sector.
Most past emissions have stemmed from the energy sector in high-income countries. Less than 25 per cent of cumulated emissions have been caused by developing countries (Stern 2007, 175).1 However, the situation is changing. In recent years, the developing countries’
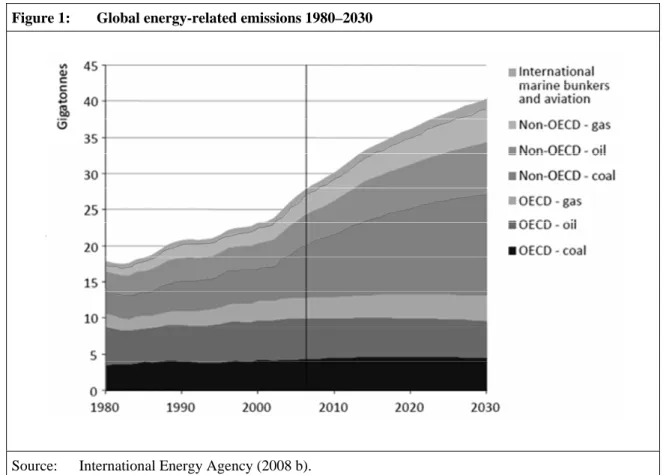
share of global emissions has been rising, and in 2000 they already accounted for about 55 per cent of yearly global greenhouse gas emissions (WRI 2009).2 High economic growth in some of these countries has led to quickly rising energy demand. As this demand has been satisfied mostly by fossil fuels, emissions have also been rising. Estimates predict a continuation of this trend unless the energy sector, and especially electricity generation, is converted to using low-carbon technology. In a business-as-usual scenario put forward by the International Energy Agency (IEA) global energy-related emissions will rise by 45 per cent between 2006 and 2030 (IEA 2008b, 11). Almost all of this increase (97 per cent) is expected to occur in non-OECD countries, mostly due to greater use of coal.
If these emission patterns prevail, they may lead to a temperature increase of up to 6°C (Schneider 2009, 1104; IEA 2008b, 11). Climate change of this magnitude would be catastrophic. Hundreds of millions of people, mainly in the developing world, might be exposed to water stress, hunger, and extreme weather events of unprecedented magnitude and frequency. Some 30 per cent of global coastal wetlands might be lost, and about half of known plant and animal species might be in danger of extinction (Schneider 2009, 1105; IPCC 2007b). Business as usual is not, therefore, an option.
At the same time, the lack of access to energy and the consequent restrictions to develop- ment remain major challenges in developing countries. About 1.3 billion people still live without electricity, mainly in Africa and South Asia (World Bank 2009a). Enhanced en- ergy access is essential if global poverty is to be reduced, but in the past it has always been
1 Stern (2007) defines the group of developing countries as equivalent to Non-Annex I parties to the Kyoto Protocol.
2 To achieve comparability, developing countries in the following are defined as Non-Annex I parties to the Kyoto Protocol.
linked to rising emissions. The challenge therefore lies in decoupling energy and green- house gas emissions so that more widespread energy use and decreasing emissions can be achieved simultaneously. The deployment of low-carbon technologies3 in developed and developing countries on a massive scale must be part of the solution.
As many investments in low-carbon technologies are long-term in nature (e.g. energy in- frastructure), they affect the climate over decades. The path leading to more climate- friendly development through the deployment of these technologies must therefore be de- termined as early as possible. Otherwise, a high-emission development path may be locked in for several decades, making a temperature rise of less than 2°C highly improb- able.
Funding for these massive investments may come from public as well as private sources.
However, from the total needed it is obvious that public funding alone will not be enough.
The United Nations Framework Convention on Climate Change (UNFCCC) estimates an additional annual requirement of USD 200 to 210 billion for mitigation in 2030. While public resources fall short of the total requirement, private investment may make a major contribution to meeting the challenge in the coming decades. According to the UNFCCC, 1.1 to 1.7 per cent of global private investment would meet estimated additional needs in 2030 (UNFCCC 2008, 19). Public finance has an important role to play in facilitating and
3 As this paper focuses on renewable energy, the use of the term “low-carbon technologies” seems appro- priate. However, the deployment of technologies that reduce the emission of greenhouse gases other than CO2 is also important.
Figure 1: Global energy-related emissions 1980–2030
Source: International Energy Agency (2008 b).
leveraging these private financial flows. It may also fill the financing gap arising from the credit crunch during the current financial crisis. Some economic stimulus packages have included measures to encourage “clean” investment (Höhne et al. 2009, 5). The Chinese and South Korean packages stand out in this respect, with green investments representing 34 per cent and 78 per cent of the total stimulus, respectively (UNEP 2009, 2).
However, public financial support alone will not be enough to mobilize the amount of private investment needed. International as well as national policies will be needed to set appropriate frameworks and create incentives for private investment in clean technologies.
These frameworks may differ according to the respective conditions, needs and potentials of countries. With account taken of best-practice cases and lessons learned from other countries or regions, each country must develop its own low-carbon development path.
This paper seeks to analyse South Africa’s options for a low-carbon development path by examining the prospects for renewable energy. It is arranged as follows. Section 2 dis- cusses the impact of climate change on South Africa and thus its motivation to join in the global effort to reduce greenhouse gas emissions. Section 3 lays the foundations for the analysis by illustrating the structure and sources of South African emissions. Section 4 focuses on electricity generation as the sector accounting for the largest share of total CO2 emissions. Section 5 explores and evaluates measures to reduce emissions in the electricity sector through the promotion of renewable energy, with particular emphasis on measures to promote private investment in renewable energy. A discussion of the need for further action and recommended solutions complete the analysis. Section 6 concludes.
2 South Africa in the face of climate change
Africa is regarded by the United Nations as one of the continents most vulnerable to the impacts of climate change as a consequence of its high dependency on agriculture, the water stress from which it already suffers and its weak adaptive capacity (IPCC 2007b, 435). The likely impacts are numerous (see Figure 2).
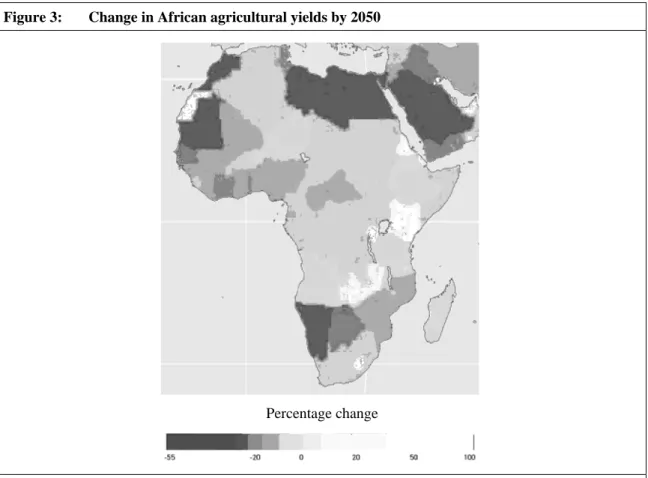
However, the impacts of climate change differ in the various African regions. In South Africa, water supply is a particularly vulnerable area with respect to climate change. Even without climate change, South Africa might utilise most of its surface water resources within a few decades (DEAT 2005). Climate change is likely to intensify water scarcity, increase demand for water and lead to a deterioration of water quality. Desertification may thus be exacerbated. This is already a widespread problem in the country, much of South Africa being arid and subject to droughts and floods (DEAT 2005). Agricultural output, which needs to increase to meet the needs of a growing population, can be expected to decline unless corrective measures are taken (see Figure 3).
The above figure depicts the projected percentage change in African yields of 11 major crops between present and 2050. Yield losses of up to 20 per cent can be expected in South Africa.
As a consequence of the expected decrease in river flows, the areas suited for the coun- try’s fauna and flora may shrink to about half of their current size, resulting in huge losses of biodiversity. This may in turn affect tourism, which contributes as much as 10 per cent of South African GDP, the potential economic loss thus being considerable (Turpie et al.
2002, iii). Climate change can further be expected to have an adverse effect on health in South Africa. The higher temperatures may cause an increase in the occurrence of skin rashes, dehydration and death due to heat strokes. Moreover, temperature rises and changes in rainfall patterns will enlarge the breeding grounds for such diseases as malaria and bilharzia, leading to a higher proportion of deaths, higher treatment costs and a greater loss of earnings (DEAT 2005).
In addition, the adaptive capacity of large sections of the South African population is low.
According to the United Nations Development Programme, 43 per cent of the population still live on less than USD 2 per day (UNDP 2008, 34). The majority of the poor live in rural areas and rely on agricultural incomes (Mbuli 2008, 4), which are sensitive to changes in weather patterns likely to occur as a result of global warming. The low saving capacity of poor households and the frequent lack of access to financial services mean limited financial reserves for use in the event of a bad harvest. If households are forced to sell income-earning assets to survive a bad year, they can fall into extreme poverty.
These households typically cause low per capita greenhouse gas emissions. It is thus ironic that the sections of the population most likely to be adversely affected by climate change are the ones that contribute least to global warming.
Figure 2: Climate change impacts in North, East, South, West and Central Africa
Source: IPCC (2007b, 451).
3 South Africa’s contribution to climate change
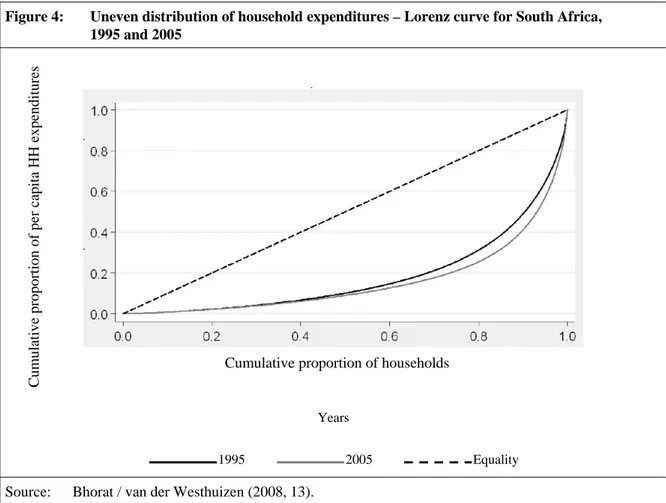
South Africa is already being affected by global climate change, and the impacts will in- tensify in the coming decades. However, it is also a contributor to global greenhouse gas emissions. In 2005, it was responsible for about 1.1 per cent of global emissions and about 40 per cent of emissions in sub-Saharan Africa (WRI 2009). At an average of 8.8 tonnes CO2e per person in 2000, the per capita emission rate was above the global average of 6.7 tonnes and almost twice as high as the sub-Saharan average of 4.5 tonnes. It almost equalled the average per capita emissions of 10.2 tonnes in the European Union. The va- lidity of average values is, however, limited. As in many developing countries, the distri- bution of available income and thus household expenditures is highly uneven in South Africa (see Figure 4). It is likely that expenditures on energy and thus emissions intensity follow a similar distribution pattern.
Figure 3: Change in African agricultural yields by 2050
Percentage change
Source: World Bank (2009 b): 145.
Note: The figure shows a world map detail. Depicted are changes in yields of wheat, rice, maize, millet, field peas, sugar beet, sweet potato, soybeans, groundnuts, sunflower and rapeseed given current agricultural practices and crop varieties. Values are the mean of three emission scenarios across five global climate models, assuming no CO2 fertilization.
As incomes rise and the South African government continues its attempts to provide uni- versal access to electricity, emissions intensity is expected to increase, at least if the cur- rent carbon intensity of electricity production is maintained. At about 850g CO2/kWh, the South African average is nearly twice as high as in the industrialized countries. CO2 con- sequently accounts for the largest proportion of total greenhouse gas emissions in the country (about 80 per cent), and it stems mainly from electricity production (WRI 2009).
Reasons for this high emissions intensity are discussed in the analysis of the South African electricity sector in Section 4.
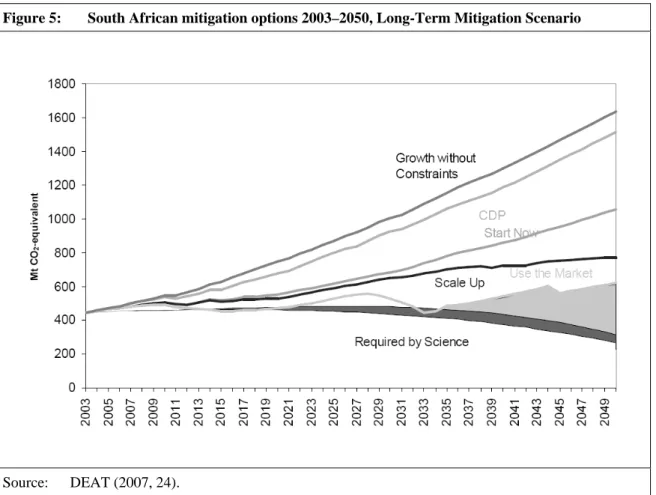
South Africa reacted to the emissions intensity by producing two Long-Term Mitigation Scenarios (LTMS) in 2007 (DEAT 2007). They show possible emission pathways from 2003 to 2050, one being a business-as-usual scenario without any constraints on the growth of emissions, the other a mitigation scenario. The “growth-without-constraints”
scenario is dismissed as being neither robust nor plausible (DEAT 2007, 12). The mitiga- tion scenario aims at reducing South African emissions by 30 to 40 per cent between 2003 and 2050. For this scenario, four options with different levels of ambition are identified:
Start Now, Scale Up, Use the Market and Reach for the Goal (see Figure 5).
The last and most ambitious option, “Reach for the Goal”, depicted as a grey wedge in Figure 5, combines the mitigation efforts of the other three options and adds the use of yet unknown technologies and behavioural change. Only this scenario achieves the envisaged emission reductions of 30 to 40 per cent from the 2003 level. However, as it involves new technologies and attempts to steer behaviour, it entails a high level of uncertainty.
Figure 4: Uneven distribution of household expenditures – Lorenz curve for South Africa,
1995 and 2005
Source: Bhorat / van der Westhuizen (2008, 13).
Cumulative proportion of households
Cumulative proportion of per capita HH expenditures
Years
1995 2005 Equality
As the electricity sector is the largest source of emissions in South Africa, all mitigation options involve changes in that sector. Fundamental changes require a careful analysis of existing conditions.
4 The electricity sector
4.1 Structure of the South African electricity sector
The sector is dominated by Eskom, a state-owned enterprise. Eskom not only produces almost all of South African electricity (95 per cent), but also owns and operates the na- tional transmission system (Bredell 2008, 1). Only about 2 per cent of South African elec- tricity is produced by private companies (US EIA 2008).
The primary energy source used in electricity production is coal (86 per cent), followed by nuclear energy (5 per cent) and various other sources, including renewable energies such as hydro power (see Figure 6). The coal used is easily accessible and of poor quality, re- sulting in a low input cost. At nearly 50 billion tonnes, South Africa has the world’s sixth largest recoverable coal reserves. It will not therefore be due to a lack of coal that an en- ergy shift takes place (US EIA 2008).
Eskom is operating at nearly full capacity: peak demand is currently about 36 GW, matched by an installed capacity of nearly 40 GW, giving a narrow reserve margin of
Figure 5: South African mitigation options 2003–2050, Long-Term Mitigation Scenario
Source: DEAT (2007, 24).
Note: CDP depicts the development of emissions under current development plans.
about 10 per cent (DME 2008). This tense situation resulted in South Africa experiencing serious power shortages in early 2008, their economic impact estimated at between USD 253 and 282 million USD (US EIA 2008).
The shortages were caused by rising demand and inadequate investment in additional sup- ply. Until the mid-1990s, Eskom had excess supply capacity. However, in 1994 only 36 per cent of South African households had access to electricity (Eskom s.a.). In the course of mass electrification programmes, this situation has changed. In 2004, 72 per cent of households were electrified, and the government wants to achieve universal access by 2012 (Eskom s.a.). In addition, stable economic growth and industrialization have led to rising electricity consumption. In the future, demand for electricity is expected to increase by 4 per cent per year, leading to a doubling of total demand and so an additional require- ment of 40 GW by 2025.
To meet this challenge, the Department of Minerals and Energy and Eskom jointly re- leased a policy document entitled “National response to South Africa's electricity short- age” in 2008. The plan includes such supply-side interventions as a 2400 MW generation capacity expansion programme involving two new coal-fired power stations, the return to service of three stations mothballed in the 1990s and the exploration of co-generation and renewable energy options (DME 2008, 7). On the demand side, the aim of the “Power Conservation Programme” is to reduce demand by means of power quota allocations combined with penalties and positive incentives. In the medium to long term, Eskom’s aim is to reduce demand by about 3000 MW by 2012 and a further 5000 MW by 2025 by encouraging a behavioural change in its customers. The savings are to be achieved inter alia through the increased installation of solar water heaters and use of energy-efficient light bulbs. These programmes are, however, making slow progress. One reason for this is
Figure 6: Energy mix in South Africa
Source: US EIA (2008).
0 5 10 15 20 25 30 35
coal nuclear hy droelec tric pumped-
storage
conventional hydro
gas
GW
a lack of the skilled personnel needed for the testing and installation of solar water heaters.
Another reason may lie in the programme’s lack of funding, which is related to the high annual losses incurred by Eskom. In 2008 it made a record loss of ZAR 9.7 billion.
The adjustment of the power tariff regime to reflect the actual cost of electricity provision will help to ease Eskom’s tense financial situation. It will also create incentives for en- ergy-saving. In 2008, Eskom applied for a 60 per cent electricity tariff increase, and the National Energy Regulator of South Africa (Nersa) eventually allowed a 27.5 per cent rise, approving a further 31.3 per cent rise in 2009. In spite of this increase, the price of electricity in South Africa is among the lowest in the world.
The South African electricity sector therefore faces three problems. The first is electricity undersupply, resulting in a narrow reserve margin and power shortages. Given a projected doubling in demand within the next 15 years, the pressure to increase electricity supply and/or reduce demand is immense. Eskom estimates it will need ZAR 300 billion over the next decade for the extension of power infrastructure. At the same time, Eskom is dra- matically underfunded. The third problematic aspect is the high emission intensity of the South African economy, especially the electricity sector, and the resulting environmental damage.
The promotion of renewable energy technologies can provide a solution to the electricity supply and emission intensity aspects of the South African energy challenge. However, in spite of a high resource potential, there has so far been little progress in the deployment of renewables. The obstacles to the large-scale dissemination of renewable energy in South Africa are numerous, but not impossible to overcome.
4.2 Barriers to renewable energy
While there are some natural barriers, such as the limits to biomass use, and specific tech- nology needs, such as waterless cooling systems owing to the scarcity of water, the main barriers are to be found in the South African energy innovation system and in the econom- ics of renewable energy technologies.
The South African innovation system is characterized by a high path dependency. Having its roots in the apartheid period, when independence from external energy supplies was a political necessity, energy research has centred on fossil fuel technologies. As coal is an abundant source of energy in South Africa, both electricity and fuel are produced from coal. The two main energy providers, Eskom (electricity) and Sasol (fuel), are responsible for the bulk of investment in energy research and development. At the same time, they are almost monopsonistic employers of university graduates in the relevant fields. These pat- terns have led to an extreme bias in innovative capacity towards fossil fuel innovation.
Renewable energy technologies, on the other hand, lack the capacity basis at all levels of education. As monopolistic energy providers, both Eskom and Sasol wield considerable power. They use their influence to protect those of the energy market’s features suited to their core competencies. Fostering a favourable environment for renewable energy provid- ers is certainly not part of this strategy.
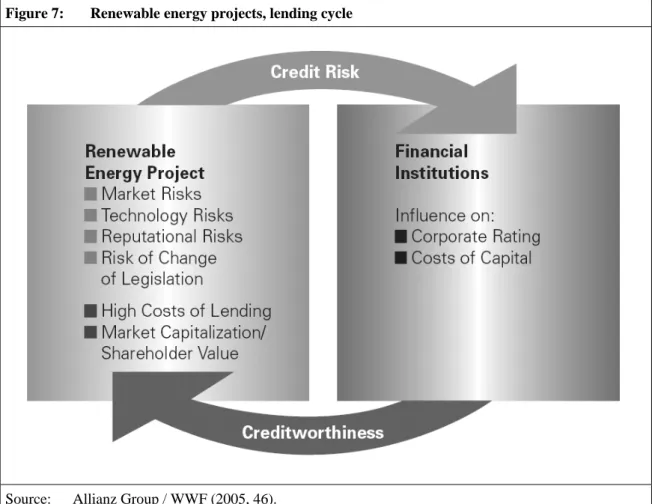
The economic barriers to the deployment of renewable energy in South Africa can be di- vided into risk and cost factors. Figure 7 depicts the typical risk assessment and lending cycle of renewable energy projects.
Typically, the market for renewable energy technologies is quite young. Its lack of matu- rity leads to higher volatility and thus to greater risk. If these technologies are politically supported by schemes such as a feed-in tariff, as is the case in South Africa, it is uncertain whether a change of legislation will alter the economics of a given project. This adds to the market risk, as feed-in tariffs are an instrument of market creation. For example, the alteration of the Spanish feed-in tariff in 2008 led to a significant fall in solar technology market growth rates. As most renewable energy technologies are still in their infancy, they entail an additional technology risk. There are only a few concentrated solar power facili- ties in operation worldwide. The challenges this technology would face under South Afri- can conditions are still unknown. The enterprise making the first move, only to see its pro- ject fail, may face not only economic but also reputational risks. The financial institutions will factor all these risks into their credit conditions, which will raise the cost of lending.
In addition, a lack of competition among South African financial institutions may have led to reluctance to explore new fields of lending activity in the past. As there is consequently a lack of experience with renewable energy projects, it is difficult for project developers to obtain funding on the private capital market.
Figure 7: Renewable energy projects, lending cycle
Source: Allianz Group / WWF (2005, 46).
In addition to the higher risk they entail, the competitive cost of renewable energy tech- nologies is a very significant barrier in South Africa. The average price of electricity was ZAR 0.198 per kWh in 2007/2008, but since the increases in 2008 and 2009 it has been ZAR 0.3314 per kWh (Nersa 2008a, 1). This price is approximately equivalent to EUR 0.03/kWh, compared to average European prices for households in 2008 being around EUR 0.12/kWh (European Commission 2009). The cost of producing electricity from wind is about EUR 0.05/kWh, depending on the resource quality of the site (IEA 2008a, 3). This makes wind energy almost competitive with conventional energy in Europe, where conditions are favourable and fossil fuels are comparatively expensive. However, this is not the case in South Africa. Here, the consumer price of about EUR 0.03/kWh is not sufficient to make wind energy commercially attractive, especially as South Africa does not have wind speeds comparable with sites in northern Europe.
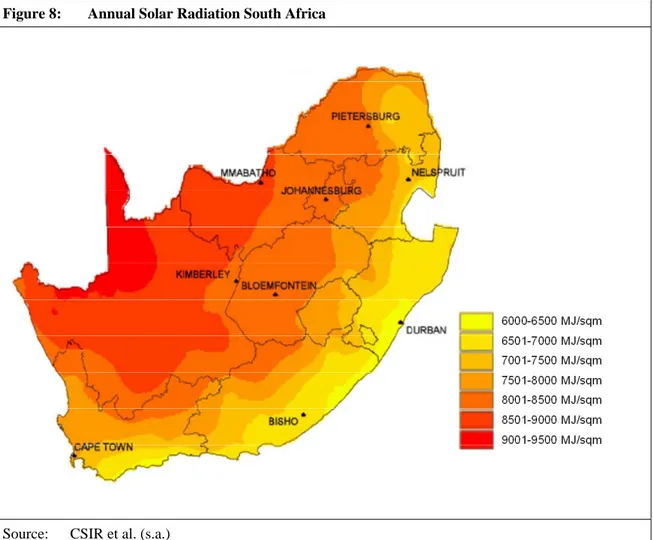
The renewable resource with the greatest potential in South Africa is solar energy. There are two main technologies for producing electricity from solar radiation: concentrating solar power (CSP), also known as solar thermal energy, and solar photovoltaics (PV). CSP technology uses mirrors to concentrate the thermal energy of the sun and heat a transfer fluid. The heat energy is then used to produce steam, with which electricity is generated in conventional turbines. Photovoltaic panels normally use silicon to convert the solar radia- tion directly into electricity. Figure 8 shows South Africa’s solar energy potential as the annual direct and diffuse solar radiation received on a level surface.
Figure 8: Annual Solar Radiation South Africa
Source: CSIR et al. (s.a.)
The total area of high radiation in South Africa amounts to approximately 194,000 km2, including the Northern Cape, one of the best solar resource areas in the world (Eskom 2002). If the electricity production per square kilometre of mirror surface in a solar thermal power station is 30.2 MW and only 1 per cent of the area of high radiation is available for solar power generation, then generation potential is already about 64 GW (du Marchie van Voorthuysen 2006, 6; Eskom 2002). A mere 1.25 per cent of the area of high radiation could thus meet projected South African electricity demand in 2025 (80 GW). This would, how- ever, require large investments in transmission lines from the areas of high radiation to the main electricity consumer centres. The South African national energy regulator Nersa can direct the utilities to build these transmission lines, but as financial resources are scarce, there must be a thorough assessment as to where new lines are necessary and reasonable.
The current levelized cost of producing electricity from CSP plants is about EUR 0.13/kWh in desert climates (DLR 2005, 131). This comparatively high cost is due to the high initial investments in solar-thermal power stations. Nonetheless, CSP is the cheapest option for producing electricity from solar energy. It is suitable for large-scale plants and provides base load, as the heat produced can be stored more easily and cheaply than, for example, electricity from solar photovoltaic systems. However, CSP technology is still at an early stage of commercialization. The cost reduction potential has not yet been fully explored: the German Aerospace Centre (Deutsches Zentrum für Luft- und Raumfahrt) estimates a cost reduction down to EUR 0.05/kWh at a global total installed capacity of 40 GW achieved between 2020 and 2025 (DLR 2005, 10).
It thus becomes clear why renewable energy has not yet been exploited on a large scale in South Africa. None of the technologies can compete with coal-fired power stations gener- ating electricity at EUR 0.03/kWh.
Besides the abundant coal reserves, there is a second reason for the low price of electric- ity. Most South African power stations were built in the 1970s and 1980s, when exchange rates were favourable. In the meantime, they have been fully depreciated, and coal input is one of the largest cost factors. While this is now an obstacle to renewable energy, it may be a supportive factor in the future. Investment in a new utility must not be compared to today’s electricity production cost, but to the cost of alternative new investments. As these will require new capital input, the price of electricity will rise in the future. Eskom’s ap- plications for higher tariffs in 2008 and 2009 to finance investment in new power stations document this trend. Over the next three years, Nersa projects annual tariff increases of 20 to 25 per cent (Nersa 2008a, 2). However, the higher prices are already attracting public opposition since they are perceived as a threat to the goal of poverty reduction. The politi- cal success of South Africa’s African National Congress (ANC) party is closely linked to and dependent on success in reducing poverty. Given the power shortages and the under- funding of Eskom, it is doubtful that there will be enough funds available or the political will to invest public money in comparatively expensive and risky renewable energy tech- nologies. It is therefore vital to promote private-sector participation.
5 Promoting private-sector involvement in renewable energy
While rising electricity prices will improve the competitive position of renewable energy technologies in the future, these technologies will still need considerable support if they
are to be deployed on a commercial, large-scale basis. This support is needed as soon as possible, since investment cycles are comparatively long in the energy sector. Investments in fossil-fuel-powered stations undertaken today lock these technologies in for decades to come. The South African government has acknowledged this and consequently taken measures to support private investment in renewable energy and other clean technologies.
In some of these measures, it has emulated successful examples in other countries.
5.1 National measures
5.1.1 Renewable energy support schemes worldwide: an overview
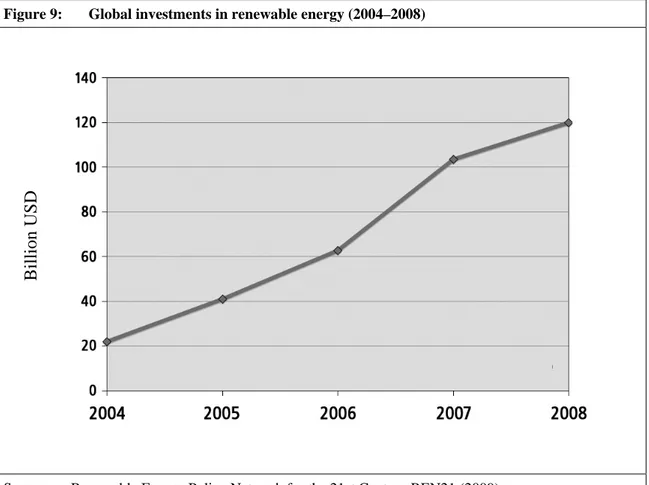
By 2009, at least 73 countries had renewable energy policy targets, with no fewer than 64 hav- ing specific support schemes in place. As Figure 9 shows, the enhanced policy actions and the concerns about energy security and climate change issues are reflected in private investments.
The most common and probably most effective policy instruments used in support of re- newable energy technologies are feed-in tariffs (Mendonça 2007, 8). First applied success- fully in Germany, the scheme has spread to more than 40 countries.4 The idea behind a feed-in tariff is to guarantee producers fixed tariffs for power from renewable energy
4 Renewable Energy Policy Network for the 21st Century REN21 (2009, 26).
Figure 9: Global investments in renewable energy (2004–2008)
Source: Renewable Energy Policy Network for the 21st Century REN21 (2009).
Billion USD
sources over a certain period of time, in most schemes 10 to 20 years. This creates a basis for long-term investment planning, since revenues are known and guaranteed in advance.
The tariffs are usually differentiated according to the renewable energy technology sup- ported. They exceed the normal electricity price paid by consumers and ideally enable the investor to cover his costs and earn a reasonable return on his investment. The additional costs due to the higher tariffs are passed on to all power consumers in the form of a pre- mium per kilowatt hour. In some schemes, tariffs are adjusted over time to prevent consum- ers from paying unnecessarily high prices and to allow for technology learning curves.
However, these adjustments must be predictable if investment certainty is to be maintained.
Renewable energy technologies are also supported by quota models in some countries, nota- bly the UK and Sweden (Mendonça 2007, 9). In the quota model it is not the tariff that is fixed but the quantity of power that must be generated from renewable energy sources or the share of renewables in total capacity. The market then determines the price. However, quota sys- tems appear to be less effective than feed-in tariffs. They do not allow for price differentiation for different technologies, as there is only one price for power produced from renewable sources. This promotes least-cost technologies and project sites and so brings costs down quickly, but it also inhibits the development and commercialization of such earlier-stage tech- nologies as offshore wind and solar thermal energy. Furthermore, as the price is determined by the market, there is no certainty for investors about future prices. If there are few actors in the market, price fluctuations may be high. This results in additional risk, which is priced at a pre- mium by the private sector and acts as an unnecessary obstacle to investment.
Other support schemes include tax incentives or subsidies for particular technologies, such as solar photovoltaics. In addition to raising the revenues from renewable energies, the cost of competing fossil fuel technologies needs to be increased if renewables are to be- come more competitive. This can be done through carbon taxes, cap-and-trade systems or other ways of internalizing the external costs caused by fossil fuel technologies. Further- more, the implicit or explicit subsidization of fossil fuels must be reviewed, even if this is strongly opposed by both powerful interest groups and the general public.
5.1.2 The South African status quo 5.1.2.1 Renewable Energy White Paper
In 2003 the South African Department of Minerals and Energy (DME) published a White Paper on renewable energy. This document supplements the DME White Paper on Energy Policy of 1998 and presents the South African government’s vision, policy principles, strategic goals and objectives in the promotion and introduction of renewable energy (DME 2003, vii).
In the document the DME sets a target of a 10,000 GWh renewable energy contribution to final energy consumption by 2013 (DME 2003, vii). However, this target is cumulative, starting in 2003, and so equivalent to an average of 1000 GWh/year (DME RED 2009, 12).
As the principal energy sources, the White Paper refers to biomass, wind, solar and small- scale hydro. It focuses on larger and economically viable projects rather than small-scale
electrification programmes, even though electrification is seen as an especially pressing issue in rural areas.
To achieve the renewable energy target, the government is committed to strengthening competition in the electricity market. It is seeking to create an enabling environment for independent power producers that use renewable energy sources. It is also committed to developing a Strategy on Renewable Energy which will “translate the goals, objectives and deliverables set out herein into a practical implementation plan” (DME 2003, xiii).
This overarching strategy has yet to be drafted, however.
The White Paper specifies a policy review process after five years to see whether the tar- gets, objectives and deliverables are being met. This process started in 2008, but has made little progress to date. The revised White Paper on Renewable Energy is expected to be published in late March 2010.
The Long-Term Mitigation Scenario (LTMS) energy model assumes a renewable electric- ity share of 15 per cent in 2020 and 27 per cent by 2030 (Hughes et al. 2007, 37). How- ever, it is unclear if and how this share needed for the LTMS will be reached, as South Africa has made little progress towards achieving its 10,000 GWh target in the first half of the period (DME RED 2009, 12). To date, only about 3 per cent (296 GWh) has been in- stalled (DME RED 2009, 13).
Although little has actually been achieved so far and no overarching renewable energy strategy has been established, a number of policy actions expected to augment renewable energy deployment in the coming years are planned or have already been implemented.
They are discussed in the following.
5.1.2.2 Renewable Energy Feed-In Tariff (REFIT)
The policy instrument most recently introduced in South Africa in support of renewable energy technologies is the Renewable Energy Feed-In Tariff (REFIT).
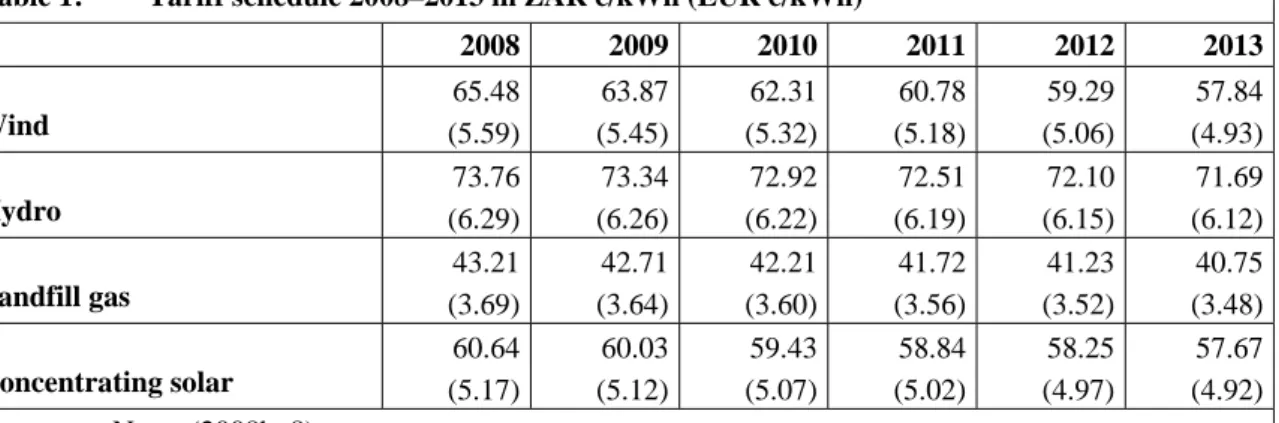
When the scheme first emerged, Nersa planned for rather low tariff rates subject to annual degression (Tables 1 and 2). With rates guaranteed for fifteen years, the time span for in- vestment planning was short compared to the capital life spans of renewable energy in-
Table 1: Tariff schedule 2008–2013 in ZAR c/kWh (EUR c/kWh)
2008 2009 2010 2011 2012 2013
Wind
65.48 (5.59)
63.87 (5.45)
62.31 (5.32)
60.78 (5.18)
59.29 (5.06)
57.84 (4.93) Hydro
73.76 (6.29)
73.34 (6.26)
72.92 (6.22)
72.51 (6.19)
72.10 (6.15)
71.69 (6.12) Landfill gas
43.21 (3.69)
42.71 (3.64)
42.21 (3.60)
41.72 (3.56)
41.23 (3.52)
40.75 (3.48) Concentrating solar
60.64 (5.17)
60.03 (5.12)
59.43 (5.07)
58.84 (5.02)
58.25 (4.97)
57.67 (4.92) Source: Nersa (2008b, 8).
Note: Exchange rate used is ZAR 1 = EUR 0.0853 (24 April 2009)
vestments of 25 to 30 years assumed in Nersa’s initial calculation (Energy for Sustainable Development Ltd., Palmer Development Group 2008, 7–13).
Nersa then invited and received a number of comments from stakeholders and the public in the form of submissions and public hearings. After deliberations in early 2009, the final decision on tariffs and contract length was taken in March 2009.
The initial phase of the adjusted REFIT includes four technologies with the following tariffs.
The tariffs are guaranteed for 20 years without degression. Six months after the REFIT launch Nersa plans to include other renewable energy technologies, such as biomass and solar photovoltaics. Each technology will be eligible for a different tariff, since the costs differ in each case. The differentiated tariff system is to allow licensees to recover the full cost of the licensed activities plus a reasonable return. The REFIT design will be reviewed annually for the first five years and every three years thereafter to avoid a lock-in of in- adequate tariffs. Adjusted tariffs will apply only to new projects. Investors can thus plan their investments on a long-term basis.
The changes to the REFIT design are substantial. While the initial design was greeted with scepticism, the new tariff rates were well received by investors and environmental organi- zations on their introduction. However, the REFIT has one crucial flaw: only the monopo- listic electricity supplier Eskom is allowed to buy the electricity produced from renewable energy sources, although it is not obliged to do so. This makes for considerable uncer- tainty among renewable energy project developers and so removes reliability of profits as the most important incentive of the feed-in tariff scheme. Reliable profits have, however, been the basis of the scheme’s success in other countries. The REFIT in its current form is therefore unlikely to have the intended positive effect on private investment activity.
Table 2: Annual REFIT degression
Rate Degression (%)
Wind 2.45
Hydro 0.57
Landfill gas 1.16
Concentrating solar 1.00
Source: Nersa (2008b, 8).
Table 3: Revised REFIT rates
ZAR c/kWh (EUR c/kWh)
Wind 125 (10.66)
Hydro 94 (8.02)
Landfill gas 90 (7.68)
Concentrating solar 210 (17.91)
Source: Nersa (2009, 28).
The effects of feed-in tariffs on the consumer price level of electricity are indirect and diffi- cult to estimate. They depend on the tariff level, but also on the success it has in promoting investment in renewable energies. The higher the amount of “green” electricity fed into the grid, the more expensive the tariff system and the stronger the impact on electricity prices paid by the consumer. The German renewable energy law is estimated to have caused a price increase of about 12 per cent between 2002 and 2006 (BMU 2007, 13). This moderate in- crease may be due to the already comparatively high price of electricity in Germany. The situation may differ in South Africa, depending on the actual success of the REFIT. This may be another obstacle to the success of the South African REFIT scheme. Public support may wane as consumers start to feel the price increase caused by the support for renewable energy.
Before the introduction of the REFIT, there were earlier, but basically unsuccessful at- tempts to stimulate greenhouse gas mitigation projects in South Africa.
5.1.2.3 Tax exemption for Clean Development Mechanism revenues
The Clean Development Mechanism (CDM) is one of the flexible mechanisms for which the Kyoto Protocol provides. It allows developers of low carbon projects in developing countries to generate carbon credits and sell them in the carbon market, thus obtaining additional financial resources. To promote clean investments, the South African govern- ment has introduced a tax exemption for CDM revenues. This measure is also aimed at improving South Africa’s attractiveness for CDM projects. To date, the majority of CDM projects are situated in China and India (see Figure 10).
Of the 4869 projects in the 2009 CDM pipeline, South Africa has managed to attract only 29.5 The reasons for this rather poor performance are manifold, and tax exemption is unlikely to be the solution. Not only does the private sector lack the capacity to deal with
5 UNEP Risoe Centre CDM/JI Pipeline Analysis and Database, May 1st 2009.
Figure 10: Geographical distribution of CDM projects
Source: UNEP Risoe Centre (2009)
China 36%
India 26%
Braz il 7%
South Africa 1%
Others 26%
Mex ico 4%
the complex CDM regulations, but an extensive national approval procedure also has to be completed. For definitive approval by the Designated National Authority (DNA), projects must meet various social, economic and environmental requirements from a list of criteria for sustainable development. This approval procedure slows the project planning process and so increases costs for project developers. Besides the sustainability criteria, an envi- ronmental impact assessment may be required for various project types.
However, the potential for CDM projects in South Africa is large. The high emissions from the use of coal mean there is potential for major reductions, and the levels of techno- logical and economic development are comparatively high. Coupled with its abundant renewable energy resources, South Africa provides a favourable project development and investment climate. In 2006 PricewaterhouseCoopers estimated that at least ZAR 5.8 bil- lion (about EUR 530 million) could be earned by 2012 from the sale of CDM credits gen- erated in South Africa (Fakir / Nicol 2008, 25). The DNA is attempting to tackle the ca- pacity problem by holding a series of CDM promotion and capacity-building workshops.
5.1.2.4 Carbon Tax vs. Cap and Trade
While the aim of a feed-in tariff is to encourage investments in renewable energy, a carbon tax or cap and trade system seeks to discourage investments in fossil fuel technologies.
Carbon taxes lead to a direct increase in the cost of producing electricity. If this increase is passed on to consumers, the price of electricity to households and to industry is affected.
As a principal goal of South Africa’s policy has long been universal access to electricity, with particular emphasis on the poor and rural areas, a policy trade-off may occur. Any suspicion of a conflict with such a high priority policy aim may make it difficult to “sell” a carbon tax to voters. This is especially true at times of financial and economic crisis, cli- mate change being regarded by the public as a problem to be solved by the countries that are historically responsible. It may be politically more acceptable to introduce a levy on local air pollution, which will have a side-effect on greenhouse gas emissions, but focus on the benefits to local health. According to findings of a study by Spalding-Fecher and Matibe (2003), however, the external costs caused by air pollution in South Africa are considerably lower than those due to greenhouse gas emissions (see Table 4).
From an economic point of view, it is therefore more important to endogenize the external costs of greenhouse gas emissions than the costs of local air pollution. However, it is un-
Table 4: External costs of electricity generation from coal (1999 Rand c/kWh) Per unit of coal-fired power produced
Low Central High
Air pollution and health 0.5 0.7 0.9
Climate change 1.0 4.3 9.8
Total 1.5 5.0 10.7
Source: Spalding-Fecher / Matibe (2003, 727).
Note: The estimate excludes the benefits of electrification from the avoidance of the indoor use of dangerous fuels.
clear whether a carbon tax would have the desired steering effect on emissions in South Africa. Eskom’s de facto monopoly would simply allow it to pass the full costs on to the consumer, there being no incentive to change fuel use to cleaner energy. The only effect on emissions would then come from electricity savings on the demand side due to the higher price level.
For that reason and because a tax directly increases the price of fossil fuel use, South Afri- can companies and the public oppose a carbon tax. Despite this, Environment Minister van Schalkwyk announced a ZAR 0.02/kWh levy on non-renewable electricity in 2008. The levy had already been included in the 2008 budget, and its introduction was scheduled for September 2008, but was eventually deferred until mid-2009. It was then included in the 31.3 per cent electricity price increase permitted by Nersa, which left Eskom with an aver- age net price increase of 24.08 per cent.
The generation of revenues is one of the advantages of a carbon levy. These revenues may be used to cushion the impact of the levy on the poor. This can be done by reducing other taxes that affect the poor in particular, such as value-added tax on essential foodstuffs, or by subsidizing the electricity tariff for the poor (Winkler 2009, 81). Even though South Africa’s environmental tax revenues are not earmarked, the price increase to poor house- holds was restricted to 15 per cent by Nersa.
In spite of the opposition to higher electricity prices, the Long-Term Mitigation Scenario (LTMS) entails the introduction of fiscal measures to reduce carbon emissions. The miti- gation option “Use the Market” proposed in the LTMS includes an escalating tax on greenhouse gas emissions, rising from ZAR 100 per tonne of CO2eq in 2008 to ZAR 750 in 2040. This would translate into a tax of ZAR 0.102/kWh in 2008 and ZAR 0.765/kWh in 2040, assuming that 1.02 tonnes of CO2 is emitted during the coal-based production of 1 MWh electricity. This demonstrates the gap between the mitigation scenarios, the most optimistic still not reaching the “required-by-science” emission limit, and political reality, where the introduction of a ZAR 0.02/kWh carbon levy is already proving to be problem- atic.
An alternative approach to reducing greenhouse gas emissions is the adoption of a cap- and-trade system. This system is already established in the European Union and may be adapted to the South African context. It is uncertain, however, whether the South African financial sector can handle the technicalities of a carbon trading system and, even more important, if there will be enough local participants to sustain it. With Eskom, Sasol and a few mining companies responsible for the bulk of South African emissions, the number of actors may be too small to ensure a functioning market.
5.2 Further gaps and possible solutions
The attempts of the South African and other developing countries’ governments to en- courage private investment in clean technologies already look promising. However, the gap between policy statements and actual implementation is wide in most countries. This has also been true of South Africa. The introduction of the REFIT and the recent tariff rises – induced not by environmental concerns but by pure financial necessity – may indi- cate a change of trend. However, these actions will not suffice to reduce South Africa’s
emissions by 30 to 40 per cent from the 2003 level by 2050 as envisaged by the Long- Term Mitigation Scenario (LTMS).
On a strategic level, the LTMS has clearly revealed the gap between the level of mitiga- tion required by science and the planning capability. The most ambitious scenario based on concrete action proposals narrows the mitigation gap by only 76 per cent. One quarter of the required effort therefore still needs to be made with technologies that are not yet on the market and through behavioural change, a somewhat vague concept. This strategic deficiency will have to be addressed. Policy measures other than a CO2 tax, such as stan- dards or regulations, may be explored in further strategic planning. However, when new regulatory or policy measures are introduced, they must be coherent with existing policies.
Various arms of the government must coordinate their activities to avoid conflicting ap- proaches, such as a feed-in tariff and a competitive bidding process for electricity provi- sion. This has not always been the case in the past.
Further strategic planning is thus undeniably required. However, even the best mitigation scenario is futile if it fails to induce actions on the ground. There is a serious need for a step- by-step implementation plan for the most ambitious of the concrete LTMS mitigation op- tions. This option, Use the Market, includes subsidies for solar water heaters, a technology which is very cost-efficient and should indeed be deployed on a large scale. As part of the demand-side management programme, Eskom has attempted to encourage the introduction of solar water heaters. However, actual progress towards the achievement of the ambitious target (installation of a million solar water heaters within three years) is slow. Testing and installation capacity is proving to be one of the major bottlenecks. All solar water heaters installed under the Eskom programme have to pass a test conducted by the South African Bureau of Standards (SABS). As only one test rig is available, testing is too slow to meet demand. Another bottleneck is installation capacity, there being few qualified personnel for the professional installation of the heaters. The lack of local capacity is a problem that per- sists at every educational level of the South African renewable energy sector and has an even greater impact on the deployment of such sophisticated technologies as concentrated solar power. Any large-scale introduction would require building innovative capacity in South Africa to enable the development of country-specific technological solutions, e.g.
water-saving technologies for concentrated solar power (Edkins et al. 2009, 3).
Even the REFIT, an established renewable energy support measure, faces difficulties. The more renewable capacity is built, the higher the additional costs to consumers. As electric- ity prices are already rising steeply, any additional burden on consumers may not be ac- cepted. The REFIT may thus be practicable for only small quantities of electricity gener- ated; a political reality that may reduce the whole scheme to an absurdity. The lack of de- mand certainty is a further major obstacle to the scheme’s success. To remove this obsta- cle, either Eskom must be forced to buy electricity produced from renewable energy sources, or other entities must be allowed to act as purchasers.
The trade-off between the need for a higher electricity price and the government’s com- mitment to providing cheap electricity access, especially for the poor, certainly poses a major challenge. Such obstacles must be addressed carefully and in a comprehensive and yet detailed manner. They require significant human and financial resources during the planning and the implementation phase. Capacity- and awareness-building at all levels is vital to the removal of this obstacle, as is the search for new funding sources.
Most of the barriers to renewable energy deployment in South Africa, such as the addi- tional financial burden on consumers caused by the REFIT, high investment costs for grid extension, the need for additional education and research and risk cover for early-stage technologies, can be overcome with external funding. One of the aims of the international climate change negotiations is to establish mechanisms for the financial and technological support of mitigation measures in developing countries. Many valuable schemes already exist as options in the negotiation documents, the most promising being discussed in Sec- tion 5.2.2 below. These mechanisms must be put into effect at the critical negotiations to be held in Copenhagen in 2009.
5.2.1 Creating public awareness and acceptance
In many developing countries, the public’s general awareness of environmental issues is rather low. This is especially true of the poorer sections of the population, where, under- standably, the issues of daily life are of greater concern than, say, the impacts of climate change expected to occur in several decades to come. However, renewable energies may also provide solutions to the problems arising in the daily lives of the poor. For example, they can be used to supply electricity to remote rural areas. As connecting these areas to the national grid can be prohibitively expensive, off-grid renewable energy technologies may offer viable solutions. Governments may also point to further positive side-effects of renewable energy, such as improved health through reduced air pollution, job creation in growing markets and greater energy security.
Besides running its own awareness campaigns, the state may encourage the involvement of civil society organizations in increasing awareness of environmental issues and benefits of renewable energy. This may enhance public support for policies aimed at a switch in energy sources.
It is evident, however, that gaining public support for costly renewable energy schemes is a challenging task in developing countries. The first policy aim in most of these countries is development, and particularly poverty reduction. Any conflicting aim will be rejected by the public, and politicians who do not bear this in mind are hardly likely to be re- elected. One of the main obstacles to greenhouse gas mitigation policies is thus the as- sumed cost to society. That cost ties up financial resources which cannot then be used to alleviate poverty. It would, moreover, be borne at national level, while the benefits would accrue globally. This creates a disincentive for national governments to implement mitiga- tion policies. It is therefore of the utmost importance for environmental goals to be aligned with development goals or, where this is not possible, at least to neutralize the negative short term effects of environmental policies. This requires careful planning and in many cases additional financial resources, which is too much for developing countries on their own.
5.2.2 Making use of international mechanisms
It is generally agreed at the United Nations’ climate change negotiations that developed countries must bear the incremental cost of mitigation measures taken by developing coun- tries. To this end, a multitude of international mechanisms and funding instruments have emerged in recent years. They are administered both under the auspices of the UN Frame-
work Convention on Climate Change (UNFCCC) and on a bi- or multilateral basis. Some of the funding schemes are specifically aimed at supporting clean technology research and de- ployment. Most of them seek to leverage private investments, either by using the carbon market or by providing grants and concessional loans for clean technology projects.
5.2.2.1 Policy and sectoral Clean Development Mechanism
The CDM, one of the market-based Kyoto mechanisms, has been heavily criticized for the high transaction costs caused by its project-by-project approach. Lengthy approval proce- dures increase the complexity of the CDM and so reduce its attractiveness. These costs and the actual project investment costs occur ex ante, while the revenues from CDM cer- tificates are generated ex post. The CDM thus exacerbates the initial investment problem rather than alleviating it. Other CDM rules have even been criticized in the past for creat- ing adverse incentives that result in rising total greenhouse gas emissions (see Box 1).
Given these and other deficiencies, various attempts are being made to reform the CDM.
The sectoral and policy CDMs are among the most promising approaches to supporting the transformation of the energy sector.
The sectoral CDM suggests that mitigation activities should be scaled up to cover whole economic or geographic sectors. One of the cost factors in CDM projects is the definition of an emissions baseline. This baseline is a scenario giving a reasonable representation of the greenhouse gas emissions that would occur within the project boundary if that project was not implemented. This definition has to be made afresh for each new project. To re- duce these transaction costs, two new concepts for defining a sectoral emissions baseline are currently under discussion. One is a multi-project approach involving a standardized baseline for similar types of projects in a given sector. Credits would be granted to private entities whose emissions fell below that baseline. Once a multi-project baseline had been approved, the costs incurred for new projects would be lower since project developers would not need to develop their own baselines. One disadvantage of the multi-project ap- proach is that, as not all entities in the sector would be required to participate, overall emissions in the sector concerned could theoretically rise. In addition, free-riding might
Box 1: Adverse incentives created by CDM rules – the case of HFC-23
The greenhouse gas HFC-23 is a by-product of the refrigerant HCFC-22, which is used in the manufacture of air conditioning equipment. It has an enormous global warming potential: one tonne of HFC-23 has the same effect as 14,800 tonnes of CO2 (IPCC 2007a, 212). As the CDM grants carbon credits according to global warming potential avoided, projects that reduce hydro- fluorocarbons generate large numbers of CDM certificates. In addition, the elimination of HFC- 23 is highly cost-efficient. This profitability creates incentives to increase investment in facilities producing HCFC-22, even though this greenhouse gas has a global warming potential of 1,810 CO2e. In addition to a potentially increased total emission of greenhouse gases, HFC-23 projects rarely generate sustainable development benefits and do not contribute to the economic trans- formation of developing countries towards low-carbon growth. Renewable energy projects would be more suitable in this respect; however, they reduce CO2 and thus generate fewer carbon credits. In addition, they usually require high initial investments. As a consequence, they are much less favourable under current CDM rules. By September 2009, HFC projects have received 56 per cent of CDM credits issued; renewable energy projects only 12 per cent.