Research Collection
Journal Article
Characterization of the distribution of internal motions in the basic pancreatic trypsin inhibitor using a large number of internal NMR probes
Author(s):
Wagner, Gerhard Publication Date:
1983
Permanent Link:
https://doi.org/10.3929/ethz-b-000423007
Originally published in:
Quarterly Reviews of Biophysics 16(1), http://doi.org/10.1017/S0033583500004911
Rights / License:
In Copyright - Non-Commercial Use Permitted
This page was generated automatically upon download from the ETH Zurich Research Collection. For more information please consult the Terms of use.
ETH Library
Printed in Great Britain
Characterization of the distribution of internal motions in the basic pancreatic trypsin inhibitor using a large number of internal N M R probes
GERHARD WAGNER
Institut fur Molekularbiologie und Biophysik, Eidgenbssische Technische Hochschule ETH-H6nggerberg, CH-8093 Zurich, Switzerland
I. INTRODUCTION 2 II. DETECTION OF FLUCTUATIONS BY NMR PROBES 4
(1) Levels of information 5 (2) Parameters of fluctuations 5
(3) Necessary conditions for probe recording 6 (4) Distribution of fluctuations 7
III. T H E O R I E S FOR RATE PROCESSES 8 IV. E X C H A N G E OF LABILE P R O T O N S II
(1) Individual assignments of 58 labile protons 12 (2) Solvent accessibility in solution and in the crystal
structure 14
(3) Measurements of exchange rates in NMR spectra 19
(4) Mechanism of exchange of internal amide protons 19
(a) EXt process 19 (b) EX2 process 20
(c) Experimental distinction of EXY and EX2 in BPTI 20
(d) Selection of the dominant mechanism in a distribution of fluctuations 22
(e) The intrinsic exchange rate k2 22
• Q R B I
(5) Change of experimental conditions 23
(a) Change of mechanism with pH and tempera- ture 24
(b) Variation of temperature 25 (c) Variation of pressure 26
(d) Variation of charge distribution 29 (6) Mechanistic aspects 32
(a) Solvent penetration 33 (b) Cooperative unfolding 35 (c) Partial unfolding 36
(rf) Correlation with protein stability 38
(c) Comparison of molecular dynamics calcu- lations 39
V. ROTATIONAL MOTIONS OF AROMATIC SIDE
CHAINS 40
(1) Individual assignments 41 (2) Detection of motions 41 (3) 1800 flips 41
(4) Location of slowly rotating rings 42 (5) Mechanism of ring rotation 42
(a) Opening model 43
(b) Evaluation of data on the basis of Kramer's theory 44
(c) Significance of kinetic parameters 45 (6) Computer simulations of ring flips in BPTI 46 (7) Change of experimental conditions 48
(a) Variation of temperature 48 (b) Variation of pressure 49
(c) Variation of charge distribution 49 (d) Local modifications of the protein 50 (8) Mechanistic aspects 50
VI. SUMMARY 51 VII. REFERENCES 52
I. I N T R O D U C T I O N
Proteins have a large variety of biological functions. For a large class of proteins the primary task is to react efficiently with other macromolecules or low molecular weight substances. In many cases these reactions involve motions and rearrangements of large protein moieties. Often the initial and final state, and perhaps an intermediate
one are known from X-ray crystallography. Very little is known, however, in most cases about the actual motions which are involved.
Motions in small, non reacting proteins may be considered as model processes for reactions in larger systems. Moreover, internal motions are also certainly important for initiation of protein reactions or for degradation of proteins. It is therefore not surprising that internal motions in proteins per se have attracted much interest in enzymology, crystallography, spectroscopy and theory (see for example Austin etal. 1975; Careri, Fasella & Gratton, 1975; Wiithrich, 1976; Gurd&
Rothgeb, 1979; Frauenfelder, Petsko & Tsernoglou, 1979; Artymiuk et al. 1979; Huber, 1979; Wiithrich & Wagner, 1979 a; Karplus &
McCammon, 1981a; Woodward, Simon & Tiichsen, 1982).
In this paper we summarize studies on internal motions in the basic pancreatic trypsin inhibitor (BPTI) using labile protons and aromatic side chains as internal NMR probes. BPTI has been chosen for these studies since it is available in large quantities, it has a low molecular weight (6500) but nevertheless has all the properties of a globular protein. Moreover, a very accurate crystal structure is available (Deisenhofer & Steigemann, 1975). The protein consists of a single polypeptide chain with three disulphide bonds. The regular secondary structures are a short 310-helix at the iV-terminus, an antiparallel /?-sheet involving the residues 16 to 35 which has a short third strand added by hydrogen bonds connecting the residues 21 and 45, and a short a-helix between the residues 47-56. A feature of particular interest is the enclosure of four water molecules with denned hydrogen bonds to polar groups of the polypeptide strand (Deisenhofer & Steigemann, 1975). Denaturation and folding of the protein have been studied extensively (Vincent, Chicheportiche &
Lazdunski, 1971; Masson & Wiithrich, 1973; Creighton, 1978;
Privalov, 1979; Wiithrich et al. 19806; Jullien & Baldwin, 1981;
Roder, 1981). In aqueous solution the denaturation temperature is above 900 between pH 3 and 8 (Privalov, 1979). At more extreme conditions of pH BPTI can be denatured by heat at lower tempera- tures. In the long term, however, irreversible denaturation occurs under these conditions, probably due to disulphide crosslinking and hydrolysis at high and low pH values, respectively. When studying internal motions in this globular protein we mainly concentrated on conditions far from denaturation so that essentially only fluctuations of the folded protein are examined. This does not exclude that denaturation-like fluctuations might also occur under these con- ditions. However, in this case they should be considered as a property of the dynamic protein conformation which can be described as a
dynamic ensemble of rapidly interconverting structural species (Wagner & Wvithrich, 19796).
A structure as complex as a protein has many degrees of freedom, the number of which can be roughly estimated by the number of torsional angles. The state of lowest Gibbs free energy, G, could be characterized by a certain set of torsional angles {<p°, \]f°, £|'°}. A fluctuation of the protein structure involves a transient change in this set of torsional angles. Due to the many degrees of freedom a large number of fluctuations have to be expected; different in the lifetime, the frequency of occurrence or the size of the protein moiety involved.
To describe the spatial arrangement of a protein conformation in detail, a large number of experimental parameters has to be collected.
In single crystals these data may be obtained by analysis of many reflexions in a scattering experiment. To characterize fluctuations of the spatial structure, the time dependence of the atomic coordinates or the torsional angles should be known for all the different internal motions. Up to now such information could not be obtained by an experimental technique. An indirect approach is to study internal motions by use of a large number of internal probes which are located at well-defined positions in the protein structure. These probes count the number of fluctuations which affect that site in the protein. In that way information about location of fluctuations, about the size of the protein moiety involved and about the mechanisms of the fluctuations can be obtained.
I I . D E T E C T I O N OF F L U C T U A T I O N S BY N M R - P R O B E S
Due to the high resolution of modern NMR instruments a large number of well resolved signals can be observed, each of which contains information about mobility at a particular spot in the protein structure. In this article we will concentrate only on two manifestations of internal motions in proteins: (i) the isotope exchange of labile protons which are manifested by changes in intensity with time for particular NMR signals, and (ii) the rotational motions of aromatic side chains which are manifested by line shapes and relaxation rates.
Labile protons and aromatic side chains are considered as internal probes which register internal motions of the protein. Since all the interior aromatic side chains of BPTI appear to be tightly packed between neighbouring groups in the crystal structure, rotational motions are only possible when fluctuations of the protein structure reduce the energy barriers which would oppose the rotational motions
in the equilibrium state. Interior labile protons which are completely shielded from solvent contact in the equilibrium conformation can exchange with the solvent only when fluctuations of the spatial structure provide solvent access to the protein interior or expose the interior labile proton.
(1) Levels of information
There are essentially two levels of information which can be obtained from experimental data on internal motions of proteins. The first level yields qualitative information obtained from a comparison of the measurable parameters of as many internal probes all over the protein as possible. From these data a topographical mapping of motions in the protein can be obtained. The second level of information concerns a physical understanding of the mechanism of probe recording, and the determination of quantitative parameters such as populations of activated states, the activation enthalpies, activation entropies or activation volumes, or the shape of energy barriers. This information may be obtained by variation of the experimental conditions, e.g.
temperature or pressure. Since in a complex structure such as a protein many different fluctuations occur, the quantitative parameters obtained at the second level are average values because each internal probe is sampling over all the relevant fluctuations. Moreover, a change of experimental conditions will alter the distribution of fluctuations. Thus, when measuring at two different temperatures the sampling of the internal probes will be over different ensembles of fluctuations. This will sometimes inhibit the determination of quantitative parameters for the activated state.
(2) Parameters of fluctuations
For a fruitful discussion of fluctuations it appears to be necessary to define expressions which can be used to characterize the fluctuations.
On this basis the necessary conditions for a probe to record a fluctuation can be discussed. We use {rj as the set of atomic coordinates of all the atoms i, and the dimensionless quantity p{r) as the spatial distribution of the solvent which is one in the bulk solvent and o in the absence of solvent. A single fluctuation j shall be characterized by the change of atomic coordinates with time, {r^i)};.
when going from the equilibrium conformation, {r°}, to an activated state, {rf}p and back to the equilibrium conformation or a similar low energy state. The spatial distribution of the solvent will fluctuate in a complementary way, with pj(r, t) describing the time dependence
of the solvent distribution during the fluctuation j . A more significant set of variables is the difference between the actual state and the equilibrium state,
{Ar,(<)}, = {r«(0-«?},, ( 0 and we denote the absolute values of these differences as
{<!,(«)}, = {|Ar,(*)|}, (2) A/>,(r« t) = p,(r, t)-p°(r, t), (3) and we denote the absolute value of this difference as
*,(r,«) = |Ap,(r,t)|. (4) Of particular interest are these parameters of the fluctuation j at the time t*, when the system has reached the highest Gibbs free energy, G*, and is supposed to be in the activated state. We define
U (j) (5) as the individual amplitudes of the fluctuation j , and
^* = ::£«&) (6)
n t-i
as the amplitude of the protein fluctuation j , and
S?=Js,(r,t*)dr
as the amplitude of the solvent fluctuation connected with the protein fluctuation j . For complete cooperative unfolding Af will be of the order of the radius of gyration, RG, and Sf will be of the order of the volume of the protein. The location of the fluctuation is defined by the subscripts, i, of the set {at(t*)}j for which the at(t*) have sizeable values and by the spatial function Sj(r, t*).
From the experiments described in this paper essentially two parameters can be derived. These are the rate at which the activated state is reached or the frequency of this event, denoted by klt and the life time of the activated state, denoted by k^1- With individual assignments of the probes, information about location and amplitudes can further be derived.
(3) Necessary conditions for probe reactions (a) Monomolecular probe reactions
We first discuss the conditions for reaction of an internal probe which does not need solvent contact for the reaction such as the flipping
motions of internal aromatic rings. For this reaction, (i) the location of the fluctuation has to overlap with the location of the probe, (ii) the individual amplitudes af^ at the site of the probe have to be comparable with the size of the probe, (iii) the lifetime of the fluctuation, k^1, has to be comparable with or longer than some critical reaction time of the probe.
(b) Reactions of probes with the solvent
Conditions for successful isotope exchange of labile protons are: (i) the solvent has to reach the internal labile proton, (ii) the lifetime of the fluctuation has to be comparable with or longer than some critical reaction time of the probe.
(4) Distribution of fluctuations
If we have more than a single fluctuation we describe this situation by a distribution function. This can be represented as a distribution of amplitudes, Af or Sf, a distribution of life times, k^f, a distribution of rates, kljy or a distribution of activation energies. The distribution will consist of discrete fluctuations. In the extreme case of many fluctuations this can be approximated by a pseudocontinuum rep- resentation, as shown in Fig. 1. In this figure we assume that large amplitudes are connected with large activation energies and use thus a Boltzmann distribution.
A certain probe records only those fluctuations which are located at the probe and have the necessary minimum amplitude. If the lifetimes of all the fluctuations are long compared to the critical reaction time of the probe, then all fluctuations with amplitudes larger than the minimum amplitude will be recorded by the probe. In Fig. 1 this is indicated by the step-shaped efficiency curve. For the rotational motions of the aromatic side chains the critical reaction time is determined essentially by the moment of inertia of the aromatic ring, and for the isotope exchange this quantity is given by the intrinsic exchange rates (see Englander, Downer & Teitelbaum, 1972). This estimation of the critical reaction times is valid, however, only for amplitudes of fluctuations much larger than the minimum necessary amplitude. For amplitudes around the critical value, frictional effects will increase the critical reaction times of the probes. Thus in this range of amplitudes the critical reaction time will depend on the amplitude of the fluctuation. This is pointed out with the broken efficiency curve in Fig. 1.
The experimentally measured parameters are obtained by the sampling of the probe over a subset of fluctuations of the distribution.
Distribution
Amplitude Fig. i. Schematic representation of a continuous distribution of fluctuations v.
an amplitude. The efficiency of probe recording is given by the step function if the life time of the fluctuation is long compared with the characteristic time of probe reaction. If this is not the case the broken line is a characteristic efficiency curve. The sampling of the probe is obtained by the integral over the product of distribution function times efficiency.
The number of recordings of the probe is given by the integral over the product of the distribution function and the efficiency curve. This consideration shows that the sampling of the probe occurs over a limited class of fluctuations picked out around a critical amplitude which is approximately the minimum amplitude necessary for reaction of the probe. When the temperature or another external parameter is changed then the distribution of fluctuations will change. More- over, the efficiency curve may change with temperature, pressure or pH. Thus the probe averages over a differently weighted subset of fluctuations. This will generally lead to non-linear Arrhenius plots or to non-standard pressure or pH-dependence. This is the case for a smooth continuous distribution as in Fig. i. For a distribution of discrete classes of fluctuations it may be that at a certain temperature one class of fluctuations is dominant for the probe recording while at another temperature a different class of fluctuations dominates the recording of the probe. The main goal of the work described in this review is to get information about the shape of this distribution function.
I I I . T H E O R I E S FOR RATE PROCESSES
When analysing internal motions in proteins one of the most significant parameters is the rate constant. To further rationalize this parameter,
often transition state theory is applied (Pelzer & Wigner, 1932;
Eyring, 1935). In this theory we have for the rate constant, k, A = / c - f - e -A G t / f i T
, (8) n
K is the transmission coefficient. In this theory the rate of crossing an energy barrier, AG*, is the product of the population of the activated state times the velocity on top of the barrier. The latter quantity is taken from a Maxwellian velocity distribution without consideration of interactions of the moving particle with its environ- ment. Thus the system of the moving particle and its environment are treated as an entity, and frictional effects of the movement on the way to the activated state are transferred to an apparent activation energy, AG*, which thus might be different from the real energy difference between the activated state and the ground state, denoted by AG*.
An alternative approach analyses the forces acting on a particle which is going to escape over a potential barrier. The forces are separated in a static and a time-dependent part, the first being a gradient of a potential, G, and the second a random force due to collisions with other particles:
S2 (9)
dqp is the momentum and q the reaction coordinate.
Kramers (1940) has provided solutions for two limits of the Brownian motion. To obtain these solutions K(t) is integrated over short time intervals, T, which are sufficiently short that the momentum does not change during T, but sufficiently long that K(t) is uncorrelated with K(t + r). This assumption means essentially that the time scales of the movements of the particles under investigation and that of the particles with which it collides are clearly separated. The integral
K(t')dt' (10) represents the momentum transferred by the collisions during the time T. The average values of BT, B\, etc., are obtained by integration over a distribution function <fiB and yield expressions proportional to the friction coefficient, / .
J-cc V („)
Using the equipartition theorem one obtains a relation between this second moment and the friction coefficient,/, independent of/>.
The friction coefficient is proportional to the viscosity, y. Thus, the viscosity is an integral parameter representing the number and the average strength of these collisions. Low or high viscosity mean essentially few or many collisions, respectively. Using the moments B" Kramers (1940) obtained
k = i). Ce~&G*/RT for the low viscosity limit,
and ^ (13) k = - . C'e~*G*/RT for the high viscosity limit
V
C and C" are constants which depend mainly on the shape of the potential function G(q). In both limits the Arrhenius—Eyring type exponential factor is present where AG* is the real difference in free energy between the activated state and the ground state. The net effect of the Brownian motion is given by the viscosity factor and is inverse in both limits. In contrast to the transition state theory the coupling between the reacting particle and the heat bath is now included explicitly. Concerning the rate of a process, the collisions by the Brownian motion have two effects. On the one hand they initially provide the kinetic energy to overcome the energy barrier, and on the other hand further collisions tend to stop the initialized motion. If the first effect is dominant we have the 'low-viscosity limit', if the second effect is dominant we have the 'high-viscosity limit'.
The assumptions concerning the parameter T which Kramers used for integration of equation (9) are applicable only if the observed particles are much larger than their colliding counterparts. Thus these assumptions may not be appropriate for intramolecular processes in proteins where the moving protein moieties and the colliding counterparts have comparable size. Kramers' equations are strictly valid only if the random forces are ^-correlated and Guassian (Kubo, . (14) If this is not the case a frequency dependent friction coefficient,/(A), has to be used (Kubo, 1966). In this way modified Kramers' equations were derived for the high damping limit (Grote & Hynes,
1980): r,
A is the frequency of the unstable reactive motion in the barrier region, and m the mass of the reacting particle. Transition state theory and the high viscosity limit of Kramers' theory are obtained from this equation for large and small A, respectively. A corresponding treatment of the low viscosity limit of Kramers' theory is not yet available.
For analysis of data on internal motions in globular proteins neither the local viscosity is known nor is it obvious whether the low or the high viscosity limit prevails. When external parameters are varied, for example temperature or pressure, to obtain activation energies, activation entropies or activation volumes it has to be kept in mind that the local viscosity may also vary with these parameters. If we assume that the local viscosity of the protein interior behaves similar to that of normal hydrocarbon liquids we expect that tj decreases with temperature and increases with pressure. If we further assume exponential behaviour we have:
i/( T, P) = r)0 e+
<Ev+pvvVRT. (16)
In the low-viscosity limit AH* and AV* obtained from transition state theory are therefore too small by Ev and Vv respectively:
In the high-viscosity limit AH* and AV* are too large by the same quantities. To estimate the significance of AH^ or AV* values obtained from transition state theory it is thus of importance to know whether the low- or high-viscosity limit prevails. This could be checked if the local internal viscosity could be varied to find out if the rate to be studied is proportional to rj or to tfx. Attempts have been made to change the internal viscosity by variation of the solvent viscosity. Some of these experiments will be discussed later in this paper.
IV. EXCHANGE OF LABILE PROTONS
One of the most characteristic features of a globular protein structure is the network of intramolecular hydrogen bonds. The difference in Gibbs free energy of intramolecular hydrogen bonds relative to intermolecular hydrogen bonds with the solvent is in the order of only a few kcal/mol. Thus opening and reforming of these bonds has to be expected to be a main feature of internal motions in proteins. As a consequence of the opening of hydrogen bonds, contact between
internal amide protons and the solvent may occur. Thus a study of isotope exchange of internal amide groups is an appropriate technique to investigate these phenomena.
(i) Individual assignments 0/58 labile protons
BPTI consists of 58 amino acid residues. Since four residues are prolines we have 53 peptide bonds bearing labile amide protons which can be used to probe solvent accessibility and internal motions. In addition the side chain amide groups of three asparagines and one glutamine provide another eight NMR probes. The labile protons of arginine and lysine side chains can also be observed in the NMR spectra at low pH, but due to lack of resolution and because these groups seem to be mainly on the protein surface, they are not studied any further here.
The interpretation of the isotope exchange experiments depends crucially on the individual assignments of the resonances of the labile protons. The first three assignments of amide resonances were obtained by chemical modifications and the use of shift reagents with reference to the crystal structure (Marinetti, Snyder & Sykes, 1976).
Later on Dubs, Wagner & Wiithrich (1979) have assigned 15 labile peptide protons and two labile protons of an asparagine side chain by spin decoupling and one-dimensional nuclear Overhauser enhance- ment (NOE) experiments. Finally two-dimensional NMR techniques led to an almost complete assignment of the *H NMR spectrum of BPTI without reference to the crystal structure (Nagayama &
Wiithrich, 1981; Wagner, Anil Kumar & Wiithrich, 1981; Wagner
& Wiithrich, 1982 a). In particular all peptide amide protons were assigned except that of Gly 37. The CaH2 resonances of the latter residue have been identified but the NH-CaH2 cross peaks are not present in the two-dimensional correlated (COSY) spectra, perhaps due to some internal exchange reaction (Wagner & Wiithrich, 1982 a).
The assignment procedure was facilitated by the high resolving power of the two-dimensional NMR experiments at high magnetic field.
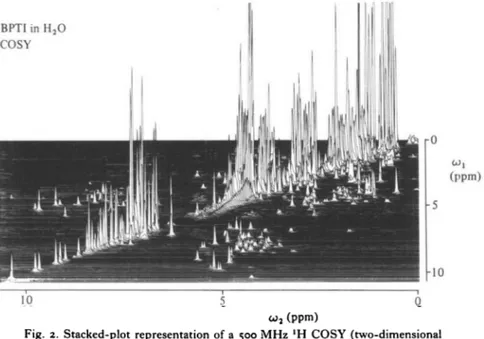
This is demonstrated in Fig. 2 with a COSY spectrum of BPTI in H2O solution. The normal one-dimensional spectrum appears on the diagonal. Off diagonal peaks indicate J-coupling between the corresponding resonances on the diagonal. Of particular interest are the cross peaks between peptide protons (6-5—11 ppm) and Ca-protons (1-5-6 ppm). This section of the spectrum is shown in Fig. 3 A in a contour plot representation. Only the part located above the diagonal in Fig. 2 is shown. In this spectral region each peptide proton is
BPT1 in HjO COSY
10 5 0
OJJ (ppm)
Fig. 2. Stacked-plot representation of a 500 MHz 'H COSY (two-dimensional correlated spectroscopy) spectrum of a coz M solution of BPTI in a mixed solvent of 90% H2O and 10% 2H2O, pH 46, T = 80 °C. (Reproduced with permission from Wagner & Wiithrich (1982a).)
represented by one signal except the glycines which show two peaks.
Due to these individual assignments a complete set of single proton exchange rates may be obtained.
Two other techniques can provide hydrogen exchange data of individually assigned labile protons. Rosa & Richards (1979) have followed the tritium out-exchange in Ribonuclease S. Structural resolution was obtained by fast digestion and high pressure chroma- tography of partially exchanged samples. Thus single proton exchange rates were obtained for the 5-peptide. Kossiakoff (1982) and Wlodawer
& Sjolin (1982) have followed the hydrogen deuterium exchange in protein crystals by neutron diffraction techniques and obtained spatial resolution of exchange data. This technique is complementary to the 2-dimensional NMR technique since the data are obtained from crystals, and it would be very interesting to study the same protein with both techniques. Neutron diffraction has the advantage not to be restricted to low molecular weight proteins while the 2-dimensional NMR technique appears to be more versatile with respect to variation of pH, temperature, buffers or concentration.
10
cj2(ppm)
9 8 7 10
cj2(ppm)
9 8 7 COSY 2H2O
80 °C
(A) COSY H2O
24 °C
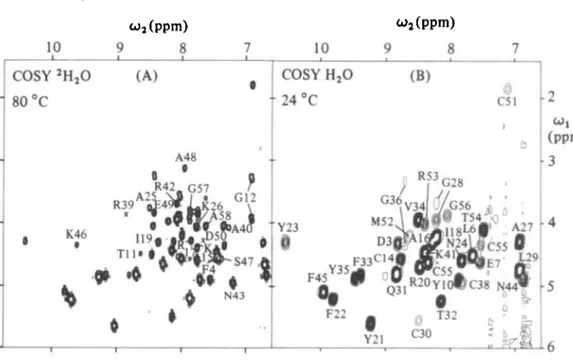
Fig. 3. (A) Contour plot of the spectral region (w, = 15-6-0 ppm, w2 = 6'6- 108 ppm) of the COSY spectrum in Fig. 2. At the pH and temperature chosen for this experiment (see Fig. 2), this spectral region contains exclusively CaH-NH J-cross peaks. It thus presents a 'fingerprint' of the protein. The present spectrum contains the NH-C'H cross peaks for 50 residues, and the peak locations for Arg 39 an Asp 50, which were for technical reasons observed in different experiments, are indicated by X. 52 of the 58 residues in BPTI are thus represented, i.e. all except Arg 1, Gly 37 and the 4 prolines. Individual assignments (Wagner & Wuthrich, 1982 a) to specific residues in the amino acid sequence are indicated for those 19 peaks which exchange too rapidly to be observed in spectrum B.
(B) Contour plot of the same spectral region as in A, taken from a 500 MHz 'H COSY spectrum of a fresh 002 M solution of BPTI in 2H,,O, p2H 35, T = 24 °C. This figure presents a reduced fingerprint, i.e. the C H - N H cross peaks are seen only for those residues for which the amide proton exchanges relatively slowly with the solvent. 33 peaks can be seen and the assignments are also indicated. (Reproduced from Wuthrich & Wagner, 1982). Peaks of four additional slowly exchanging peptide protons appear if the spectrum is recorded at io° (Wagner & Wuthrich, 19826).
(2) Solvent Accessibility in Solution and in the Crystal Structure When a protein is dissolved in 2H2O all the labile protons located on the protein surface, i.e. those which are accessible to the solvent, exchange within a few minutes with deuterium of the solvent. When a COSY experiment is carried out in 2H2O solution, the spectral region of the NH-CaH crosspeaks (Fig. 3 B) contains only the solvent protected peptide protons. If the conditions for the experiment are chosen in a suitable way (Wagner & Wuthrich, 1982 b), a discrimination
between surface protons and interior protons is obtained. In Fig. 3 A all those peaks are identified which are only seen in H2O solution and thus are assigned to surface protons. Fig. 3B contains only signals from solvent protected parts of the protein. In Table 1 all surface protons are identified with an ' / ' while for the solvent protected amides exchange rates are given. For details see Wagner & Wiithrich (1982b). Previously Lee & Richards (1971) have introduced a method for probing X-ray structures for solvent accessibility. By computer modelling they move a sphere of the size of a water molecule over the surface and determine the accessible surface area of each residue and each atom of the protein. This kind of calculation has been carried out for BPTI by Chothia & Janin (1975) who provided us with detailed data (Chothia, private communication). In Table 1 and Fig. 4 we compare these data with the results of the NMR measure- ments. This comparison yields three classes of labile protons:
(1) For 42 of the 53 peptide protons the NMR data are in agreement with the X-ray data.This means that those labile protons which are accessible in the X-ray structure exchange rapidly in the NMR experiment, and those which are inaccessible according to the X-ray structure exchange slowly in solution.
(2) The amide proton of Glu 49 appears inaccessible in the crystal structure but exchanges rapidly in solution.
(3) The ten amide protons of Asp 3, Glu 7, Gly 12, Ala 16, Ala 25, Gly 28, Cys 30, Thr 32, Val 34 and Lys 41 are accessible in the crystal structure but exchange slowly in solution.
For four protons of the latter group (Asp 3, Cys 30, Thr 32 and Val 34) the unexpected slow exchange seems to be due to an aggregation. The exchange experiments were normally carried out at 20 mM protein concentration. When the exchange was measured in 02 mM solution none of these four protons showed slow exchange.
The one labile proton which exchanges faster than expected from the crystal structure (Glu 49) forms a hydrogen bond to a carboxyl group of its own side chain (Wiithrich & Wagner, 19796). This hydrogen bond on the protein surface may not be stable enough to protect the amide proton from solvent contact. It may even catalize the exchange of the labile proton.
Thus a real discrepancy between solution structure and crystal structure exists for at most six out of 52 peptide groups which can be observed by this technique. This shows a gross similarity of the conformations in the crystal and in solution. The most remarkable discrepancy appears at the residue Glu 7. In the crystal structure a
distorted 310-helix is formed at the N-terminus, with two hydrogen bonds from Pro 2 to Cys 5, and from Asp 3 to Leu 6. Thus only the two amide protons of Cys 5 and Leu 6 would be involved in H-bonds.
The observation that the amide proton of Glu 7 is also slowly exchanging could indicate that the helix proceeds up to this residue with a third //-bond between the carbonyl oxygen of Phe 4 and the NH of Glu 7.
Some additional information on intramolecular hydrogen bonds and salt bridges in solution can be obtained from pH-titration experiments. Since the pKa values of all ionizable groups in BPTI
T A B L E I . Rate constants km (in 10 3 min 1, ± 10%) for the exchange of individual backbone amide protons in BPTI at p2H 35 and 36 °C
and 68 °C
(For 68 °C and p2H 3-5 the intrinsic exchange rates, k, are also given. Further, the following properties of the individual amide protons in the crystal structure of BPTI are listed: Accessible surface area and hydrogen bonding (adapted from Wagner & Wiithrich, 19826).)
Amino acid residue Arg 1 Asp 3 Phe 4 CysS
Leu 6 Glu 7 Tyr 10 Thr 11 Gly 12 Cys 14 Lys 15 Ala 16 Arg 17 He 18 He 19 Arg 20 Tyr 21 Phe 22 Tyr 23 Asn 24 Ala 25 Lys 26 Ala 27 Gly 28
(36T
n.o.
1 0
f
1-9 0 3 1 0 2 8 1 2
f
~IOO
I I
f f 00022
f
< 00004
< o-ooo 4
<cooo4
< 0000 4 000049
~ 100
f
~4S i-8
In solution
km
(68°)*
n.o.
~33°
f 93 23 H 93 f f
2 3 0
f 87
f 6-5 f
7 1 5-6 5 9 6 2 12
f f
~32O 52
(68°)t
— 37000 51000 110000 56000 39000 24000 39000 40000 88000 69000 56000 35 000 56000 30000 35000 44000 28000 28000 88000 78000 35000 56000 80000
In the Accessible
surface areaj
2 7 5
4 6 2 5 0 0 O'O 1 0
o-o 3 2 3 3
0 0 4 0 1 6 4 8
0 0
36
0 0 0 0 O'O 0 0 0 0 1 8 0 5 0 0 0 4
crystal Hydrogen
bonding§
—
—
—
310 3io
—
W
—
—
— w
—
— s
—
T A B L E I (cont.)
Atnino acid residue Leu 29 Cys3O Gin 31 Thr32
Phe33 Val34 Tyr35 Gly3°
Gly37
CyS38 Arg39 Ala 40 Lys 41 Arg42 Asn 43
Asn44 Phe45 Lys 46 Ser47 Ala 48
GIU49 Asp 50 Cyssi Met 52 ArgS3
Thr5 4
Cysss Glys6 GlyS7 Ala 58
km
(36°)#
0011
~ 8 o
000048 4 3 O'OO I 0 3 1 0-0044 0070
n.o.
~ 8 o f f 0-51
f
~ 100 00075
o-ooi 3 f
~IOO
f f
~ 100 O-22 OO57 O-O7I 0 4 9 0-036
2 - 1
f f
In solution
km
(68°)*
9 6 f
1 1 2 1 0
6-8
1 4 0 1 0
SO n.o.
f f f
1 8 0
f f 37
2 0
f f f f f
~5°
1 1
16 33
2 0
79 f f
(68°)t
59 000 8 8 0 0 0 7 8 0 0 0 123000 4 4 0 0 0 3 6 0 0 0 2 4 0 0 0 9 9 0 0 0 158000 175000 6 9 0 0 0 5 6 0 0 0 3 5 0 0 0 7 0 0 0 0 139000 196000 6 2 0 0 0 3 7 0 0 0 174000 5 6 0 0 0 3 9 0 0 0 7 2 0 0 0 144000 5 6 0 0 0 35OOO 174000 174000 156000 158000 6 3 0 0 0
In the Accessible
surface areaj
0 0 i - o 0 0
3 6 0 0
4 6
0 0 0 0 0 0 0 0
7 2 2-6
0 2
i-8 0 0
o-o
0 0
2 4 o-o 0-7 o-o o-o o-o o-o o-o o-o o-o o-o
3 0 1 1 7
crystal
Hydrogen bonding§
—
—
P P PP
S,W—
—
—
w— s
2 7
p
—— ss
a a a a a a
—
—
• The numbers give km in io~3 min ' + 10 %. The sign ~ in front of a number indicates that less than four experimental points were measured and therefore no error analysis was warranted, n.o., 'not observed', indicates that the NH resonance of this residue could not be detected in the COSY spectrum, f indicates that the amide proton exchanged too rapidly to be seen in the COSY spectrum recorded at 10 °C (see text). The following limits for the exchange rates of these protons were estimated: km (36°) > 01 min"1; km (68°) > 5 min"1 (see Wagner & Wuthrich, 19826).
•(• Intrinsic rate constants at p2H 3-5, which reflect inductive effects of neighbouring residues, were calculated according to the rules of Molday et at. (1972), starting from equation (2) of Englander et al. (1972). To obtain these data, piCa values of 3-4, 3-8, 3-8, 3 0 and 2-9 were used for Asp 3, Glu 7, Glu 49, Asp 50 and the C-terminal Ala 58, respectively (Wuthrich & Wagner, 19796). k, (68°) in io~3 min"1.
X Accessible surface area in A2 as defined by Lee & Richards (1970). The calculations for BPTI are described in Chothia & Janin (1975). The data used here are taken from this reference and from a complete listing of the solvent accessibilities for all the atoms in BPTI which was kindly given to us by Dr C. Chothia.
§ 3io. fi> a a nd 2, indicate involvement in 310-helix, /J-sheet, a-helix and 2,-ribbon, respectively. S and W indicate hydrogen bonding to side chains and internal water molecules, respectively.
G. WAGNER
8 10"3
10""
10"6
6 4 2 0
H-bonds Residue number
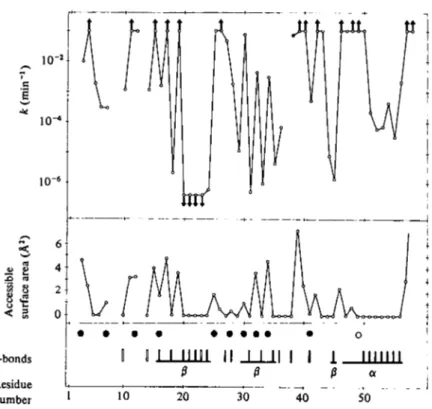
Fig. 4. Amide proton exchange data for BPTI at p'H 35 and 36 °C and selected features of the crystal structure of BPTI. The horizontal scale represents the amino acid sequence of BPTI. The graph at the top is a logarithmic representation of the individual exchange rates, km, at 36 °C. Arrows pointing upwards indicate that the exchange was too fast to be observed with the COSY experiments.
Arrows pointing downwards indicate that the exchange was too slow to be measured quantitatively within the maximum exchange time. In the lower part of the figure, the static accessible surface area is plotted for the backbone peptide nitrogens, and the intramolecular hydrogen bonds in the crystal structure of Deisenhofer & Steigemann (1975) are indicated by filled vertical bars (I, intramolecular H-bonds with main chain carbonyls) or open bars (|, H-bonds to side chains or internal water molecules). Residues which are part of regular a or fi secondary structure are joined by horizontal bars. O. The single residue that has zero accessible surface area and km (360) > 01 min"1, 0 , residues with non-zero accessible surface area and km (36°) ^ o-i min"1. (Reproduced from Wuthrich & Wagner, 1982.)
are known (Wuthrich & Wagner, 19796), a strong downfield shift of the NH-resonance of Lys 46 with increasing pH at the pKa of Asp 50 can only be explained by hydrogen bonding between these two groups (see resonance a in Wuthrich & Wagner, 19796). In a similar way an interaction between the side chain of Glu 7 and the peptide NH of Asn 43, and between the peptide NH of Glu 49 and its own side chain are manifested in the NMR spectrum of the protein
in solution (Wiithrich & Wagner, 19796). Furthermore the existence of a salt bridge between the two termini was also established on the basis of pH-titrations (Brown et al. 1978).
(3) Measurements of exchange rates in NMR spectra
In one-dimensional NMR spectra the intensities of the absorption lines are directly proportional to the *H concentration at the respective peptide groups. This has commonly been used to measure exchange rates of well separated resonances. In two-dimensional correlated spectra the relative intensity of each cross peak is determined by the degree of protonation of the peptide group, by the J-coupling between NH and CaH, and by the filter functions used for transformation.
Therefore intensities between different cross peaks cannot be compared in hydrogen exchange experiments but the time dependence of the intensity of each individual cross peak can readily be used for determining exchange rates. Rather accurate rate constants could thus be obtained for all the interior amide protons (Table 1) (Wagner
& Wuthrich, 19816).
(4) Mechanism of exchange of internal amide protons
The exchange of internal amide protons can be described by the following equation (Hvidt & Nielsen, 1966):
fr fc ju
N(H) ^± O ( H ) — ^ O(2H) ^ N(2H). (18)
fc8 aH , O fc,
The closed state N(H) is in equilibrium with open states O(H).
Exchange is possible only from the open states O(H) and leads, in the presence of 2H2O, to deuteration of the peptide site. The experimentally observable overall exchange rate km is approximately (Hvidt & Nielsen, 1966):
k =
There are two limiting kinetic situations:
(a) EXi process
If k3 > k2 each opening of the closed state N leads to an isotope exchange and we have
km = kl. (20)
In this case the exchange rate gives directly the opening rate of the protein fluctuation. The p2H- and temperature-dependences of the
protein fluctuations are directly obtained from km. If two amide protons are adjacent in the 3-dimensional structure of the protein and opening exposes both labile protons simultaneously, both protons should exchange in a correlated way. Correlated exchange implies, of course, equal exchange rates of adjacent protons, unless a local opening exposes only one of two adjacent protons.
(b) EX2 process
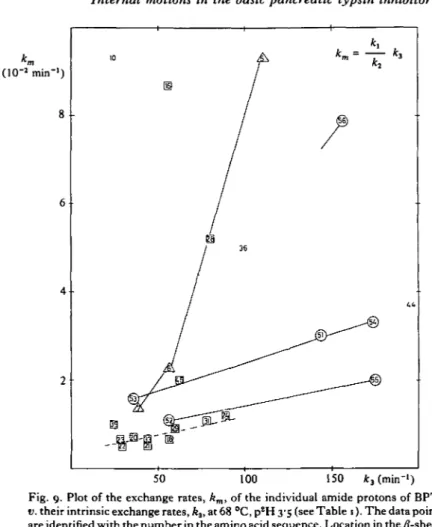
If k3 <^ k2 only a small portion of all openings leads finally to the exchange of internal protons and
No correlated exchange would thus be expected for neighbouring protons. In this case the parameters of the protein fluctuations are masked by the intrinsic exchange rate k3. Only if k3 were known could the equilibrium constant k1/k2 be determined. The pH- and temperature-dependence of km contains contributions of klt k2 and k3. k3 is directly proportional to the hydroxyl or hydronium ion concentration in the base or acid catalized regime, respectively. It has been measured in small model substances and is given by (see Englander et al. 1972):
k3 = — (1 oPH-3 + 1 03- PH) . 1 o° °5-T min-1 (T = temperature in °C).
200
(22)
Thus, in a plot of log k3 v. pH, it decreases with slope — 1 below p2H ~ 3 and increases with slope + 1 above p2H ~ 3. In the EX2 process this pH-dependence should be contained in the experimentally observed exchange rate km.
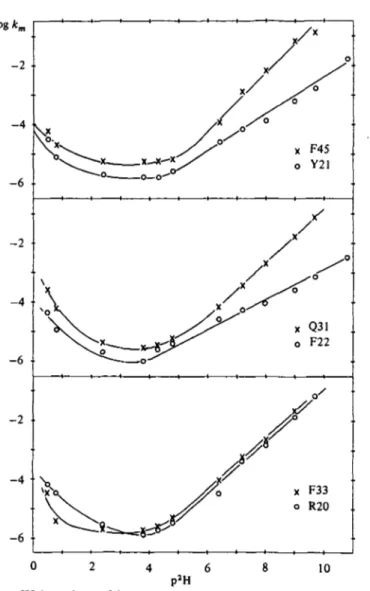
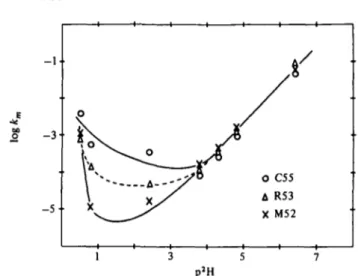
(c) Experimental distinction of EXr and EX2 in BPTI
The experimentally observed p2H dependence of the exchange rates in BPTI indicates an EX2 process. The rates decrease from p2H o to p2H 3 (acid catalysis) and increase again from p2H 3 to p2H 11 (base catalysis). This behaviour has been observed at different temperatures between 220 and 68° (Richarz et al. 1979; Hilton & Woodward, 1979).
The appearance of a V-shaped curve for the p2H dependence of the exchange rates is not a firm proof for EX2 exchange. The criterium of the p2H dependence fails if k1 has by chance a similar p2H dependence as k3. A method has been proposed to distinguish EXX
and EX2 processes by nuclear Overhauser enhancement (NOE)
N-HA—0-C I A I C« C«
I I C - O - - - HB- N
F22 Q31 N24
F22 Q31 N24
t = 60 min
10
PPM
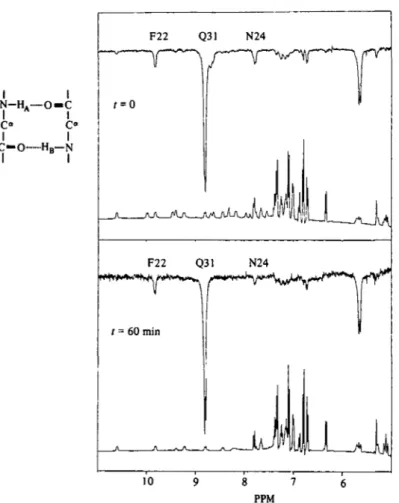
Fig. 5. Upper part: 360 MHz NOE differences spectrum (4000 scans) of a 20 min solution of the basic pancreatic trypsin inhibitor in 2H2O at p2H 46, 24 °C.
Lower trace: reference spectrum; upper trace: NOE difference spectrum. Lower part: same experiment but prior to the measurement the sample was kept at 6o°, P8H 80 for one hour to partially exchange the amide protons. Left side: schematic representation of two adjacent hydrogen bonds connecting opposite strands of an antiparallel /J-sheet. The two amide protons HA and HB are separated by approximately 2-6 A. The relative magnetization transfer is the same in the fresh solution and in the partially exchanged sample (c. 12 %). This indicates correlated exchange at these conditions. (Reproduced from Wagner, 19806.)
measurements between labile protons (Wagner, 1980.6). This tech- nique analyses the cross-relaxation between labile protons of close spatial proximity. This is demonstrated in Fig. 5. If two neighbouring protons exchange in a correlated way (EXj) the apparent NOE between the two should be the same in a fresh solution and in a protein solution where the two peptide sites were half exchanged,
since either both sites are protonated or both are deuterated. In the uncorrelated case (EX2) the NOE between the two labile protons should decrease with the exchange of the protons, since mixed pairs of protonated and deuterated peptide sites appear for which no ' H - ' H NOE can be obtained.
(d) Selection of the dominant mechanism in a distribution of fluctuations
For a single fluctuation we have two characteristic parameters, the openingrate, klt and the lifetimeof the fluctuation, ^ . I n a d i s t r i b u t i o n of fluctuations which all provide EX2-exchange the fluctuation with the largest value of k1/k2 appears as the dominant fluctuation. This will generally not be the most frequent fluctuation (with the largest kj). For a given fluctuation a transition from exchange by EX2 to exchange by EXX is expected to occur with increasing pH at condi- tions, where k3 = k2, since k3 increases with pH while k2 is constant.
In a system with a continuous distribution of fluctuations with respect to the lifetime, k^1, this transition may not be observable. This is readily apparent from the following considerations. When the fluctuation with the longest lifetime reaches the conditions of EXj exchange, its efficiency does not further increase with pH. Fluctu- ations with shorter lifetimes will thus become dominant. This will in general yield a slope < i in the plot of log km v. pH. On the other hand, when the distribution of fluctuations has discrete classes with respect to the lifetime, an EXX mechanism should be experimentally observable: When the fluctuations with long lifetimes have reached conditions of EXX exchange they remain the dominant mechanism for a certain pH interval, since the next class of fluctuations have a much shorter lifetime and become the dominant fluctuation only after a sizeable pH gap. Similar considerations apply for temperature vari- ation, since closing rates of protein fluctuations appear to have a rather small temperature dependence (see, for example, Pohl, 1976) compared to the intrinsic exchange rates. Thus the experimental observation of EXX mechanism is a proof for the existence of discrete classes of fluctuations with respect to the lifetime.
(e) The intrinsic exchange rate k3
The intrinsic exchange in a peptide group which is fully exposed to bulk solvent is assumed to consist of the following steps: diffusion of the solvent molecules which catalyse the exchange (H2O, H3O+ or OH~) to the peptide site, formation of hydrogen bonds between the
reacting particles, redistribution of hydrogen bonds and covalent bonds within the hydrogen bonded complex depending on the pi^-values of the reacting groups, and finally dissociation of the hydrogen bonded complex and fast reactions with water which re-establish the original chemical situation (Eigen, 1964; Englander et al. 1972). Consistent with this mechanism equation ( n ) was experimentally established for small model peptides (Englander &
Poulsen, 1969). Only acid and base catalysis was observed. No indication for general catalysis by H2O was found for the exchange of peptide hydrogens. Molday, Englander & Kallen (1972) found that the exchange rates of peptide hydrogens are modulated by the neighbouring amino acid side chains which influence the pi^-values of the peptide groups. The contributions of the two residues on both sides of the peptide group appear to be additive. With these data of Molday et al. (1972) the intrinsic exchange rates of fully solvent exposed polypeptide strands can be calculated.
For the case that a peptide group of a protein is not fully exposed to the bulk solvent it must be assumed that the diffusion of solvent molecules to the peptide site is somewhat hindered. In addition the pKa- values of the peptide groups may be influenced by the anisotropic environment, and the rules of Molday et al. (1972) may not be applicable to this situation. This inhibits an accurate determination of kinetic parameters in the EX2-exchange limit while an EXx-exchange allows determination of a well denned single rate constant, kv
(5) Change of experimental conditions
Many different fluctuations appear to be relevant for the exchange of internal amide protons which have different characteristic par- ameters such as activation enthalpies, activation entropies or acti- vation volumes. They may involve the opening of different H-bonds, salt bridges or van der Waals bonds. When experimental conditions, such as temperature, pressure or pH, are changed, a redistribution of the relative populations of the various fluctuations may occur (see Wagner & Wiithrich, 19796). This will result in curved Arrhenius plots, in non-linear pressure dependence or in non-standard pH dependence for reaction rates. Moreover, a change of the exchange mechanism from EX2 to EXX may occur, for example when going to high temperature or high pH.
(a) Change of mechanism with p2H and temperature
Isotope exchange by EXX mechanism can be detected by observation of correlated exchange of neighbouring protons. Correlated exchange can usually be anticipated only under conditions where adjacent pro- tons have similar exchange rates. In the /?-sheet this is the case at high temperatures and/or high pH. Three amide protons of the a-helix (Met 52, Arg 53 and Cys 55) have similar exchange rates over a large temperature range (Wagner & Wuthrich, 1982 b). NOE measurements have shown that at p2H 35 the exchange is uncorrelated up to 8o°
for all regions of the BPTI structure (Wagner et al., to be published).
A systematic investigation of the protons of the /?-sheet by Roder (1981) has shown that at 68° the exchange is correlated between pH 7 and pH 10 while at lower or higher pH no correlation was observed.
At 450 no correlation could be observed in the whole pH range from pH 3 to pH 11. Thus, when increasing the temperature at pH 8, a transition from EX2 to EXX occurs at about 50°. This transition with increasing temperature can readily be understood, since fluctuations with high activation enthalpies become more populated at high temperature. It can be assumed that these fluctuations have larger amplitudes and longer lifetimes, k^1, than the fluctuations which are relevant at low temperature since it takes more time to search for the reclosing pathway of these large-amplitude fluctuations. Thus at these temperatures the conditions for EXX exchange (k2 < k3) are met.
The pH dependence of the correlated exchange can be understood along the same line of arguments. There are two classes of fluctuations present which are relevant for the exchange of internal amide protons: large amplitude fluctuations and small amplitude fluctuations which have small and large refolding rates, respectively. At 68° and low pH the large amplitude fluctuations may be less frequent (small Aj) but more efficient than the small amplitude fluctuations if k1/k2 is larger due to the long lifetime, k^1. Since k3, the intrinsic exchange rate, increases with pH, both types of fluctuations gain in efficiency when pH is raised. Due to the longer lifetime, conditions of EXt
exchange are obtained for the large-amplitude fluctuations at pH ~ 7.
Thus k2 « k3 x io3 s"1 (see equation (22)) for the large-amplitude fluctuations at 68°, pH 7. Thus with a further increase of pH the efficiency of these fluctuations for isotope exchange does not increase while the small amplitude fluctuations still gain in efficiency, since they are still in the EX2 limit. At around pH 10 the latter fluctuations may become the dominant process for exchange and we observe
uncorrelated exchange up to pH 12. Thus, if k3 can be estimated from equation 11, then k2^ k3 (68°, pH 12) « io8 s"1 for the small- amplitude fluctuations. This interpretation does not involve a redis- tribution of fluctuations with pH, it is just a kinetic switch due to the pH dependence of the intrinsic exchange rate k3. Real physical changes of fluctuations with pH will be discussed below. At 450 the small-amplitude fluctuations seem to be dominant in the whole pH range and thus no transition to an EXj process can be observed. The observation of an EXX exchange indicates that there is a gap in the distribution of fluctuations v. lifetime, k^1- This means we have discrete classes of fluctuations which are relevant for exchange in the yff-sheet. Other molecular regions besides the /?-sheet have not been investigated in this much detail due to problems of resolution which have only recently been overcome by the use of 2-dimensional NMR.
(b) Variation of temperature
The influence of temperature on the exchange rates has been studied for the amide protons which exchange most slowly by Richarz et at.
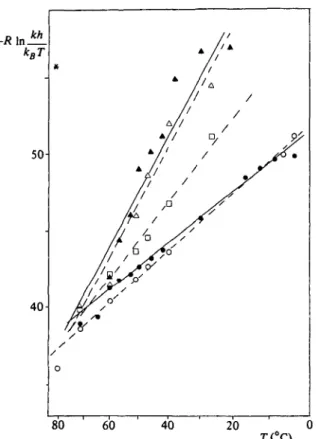
(1979), Hilton & Woodward (1979), Woodward & Hilton (1980), and quite recently exchange rates at different temperatures were measured for the complete set of interior amide protons by 2-dimensional NMR (Wagner & Wiithrich, 19826, Wagner et al., to be published). For protons of the y?-sheet, Woodward & Hilton (1980) have reported that the apparent activation energy, Ea, is ~ 60 kcal M"1 at p2H 42 and 17-30 kcal M"1 at p2H 9 5 . At p2H 8 they report a change of the slope of the Arrhenius plot at c. 40 °C, with an activation energy of
~ 60 kcal M"1 above 40 °C and a low-activation energy below 40 °C.
They conclude that a change from a high-activation energy process to a low-activation energy process occurs with p2H. In this interpre- tation it is not considered that the experimental data at p2H 4 2 were recorded between 400 and 700, the data at p2H 95 between 240 and 330, and the data at p2H 8 between 240 and 6o°. This selection of temperature ranges appears to be due to the p2H dependence of the exchange rates. The rates can be measured conveniently, within reasonable time, at p2H 42 only at high temperature, and at p2H 95 only at low temperature. Thus the apparent change of the activation energy with p2H, reported by Woodward & Hilton (1980), is in reality a temperature effect. These authors further did not consider that at P2H 8 a change of mechanism from EX2 to EXX occurs with tem- perature (Wagner, 19806; Roder, 1981), since these data were not available at that time. Thus the apparent activation energy obtained