12
Verpoest et al., The macroscore of amniotic fluidJ. Perinat. Med.
4(1976) 12
·· r Original articles
Changes in appearance of amniotic fluid during pregnancy The macroscore
M. J. Verpoest, J. C. Seelen, C. F. Westerman
Department of Obstetrics and Gynecology, Westeinde Ziekenhüis, Den Haag
WOYTON [5] mentioned the appearance of amniotic fluid äs in indicator of fetal maturity äs early äs 1963; this so easily accessible aspect, however, has since received little attention.
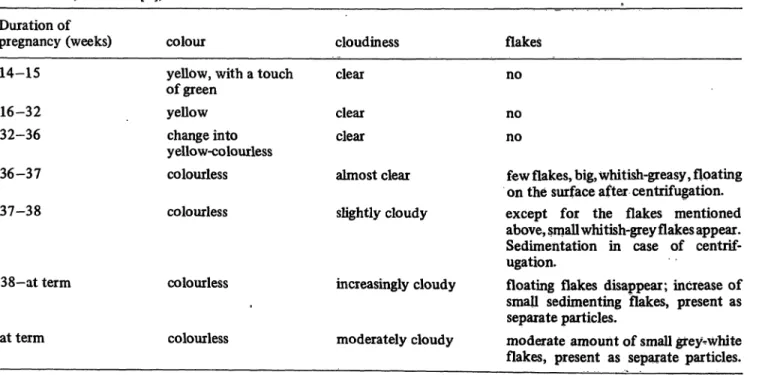
The relationship between the appearance of amniotic fluid, determined by its degree of cloud- iness and the number of flakes of vernix in it, and the duration of pregnancy, was described in more detail by SEELEN [1] and WLADIMIROFF and others [4](Tab.I).
In the first trimester of pregnancy the amniotic fluid is clear and yellow; from the 16th—20th pregnancy week the yellow colour begins to dimin- ish until the liquid is colourless at the 35th—36th
Curriculum vitae
MARK VERPOEST was born in 1944 in Nevele, Belgium. Doctor of Medi- cine in 1968 at the Catholic University of Leuven, Belgium. 1969- 1973: Department of Obstetrics and Gynäecol- ogy (Dr. J. C Seelen), Westeinde Ziekenhuis, Den Haag, Holland. 1974:
St. Vincentius Ziekenhuis, Gent, Belgium.
Main field of interest:
Amniotic fluid and fetal development.
Tab. I. Changes in the appeance of amniotic fluid from the 14th week of pregnancy üp to term. (WLADIMIROFF, VERPOEST, SEELEN [4J).
Duiation of pregnancy (weeks) 14-15
16-32 32-36 36-37
colour
yellow, with a touch of green
yellow change into yellow-colourless colourless
cloudiness clear clear clear ahnest clear
flakes no no no
few flakes, big, whitish-greasy , floating 37-38
38-at term
at term
colourless
colourless
colourless
slightly cloudy
increasingly cloudy
moderately cloudy
on the surface after centrifugation.
except for the flakes mentioned above, small whi tish-grey flakes appear.
Sedimentation in case of centrif- ugation.
floating flakes disappear; increase of small sedimenting flakes, present äs separate particles.
moderate amount of small grey^white flakes, present äs separate particles.
Verpoest et al., The macroscore of amniotic fluid 13
week. From this time on the amniotic fluid begins to become cloudy and a minute quantity of flakes of vernix begins to appear.
This cloudiness and the number of flakes gradually increase until the amniotic fluid is moderately cloudy and contains a moderate amount of flakes of vernix atterm.
l. l The macroscore
VERPOEST and SEELEN [2] introduced a System to express the degree of cloudiness and the quantity of flakes present äs a score which they called macroscore.
Both the degree of cloudiness and the quantity of flakes are expressed by a score, the scale running from 0, for no cloudiness or no flakes, to 6, for very cloudy or a very great number of flakes.
The macroscore may therefore vary between 0 and 12 (Tab. II). In this study we further test the signif- icance of the macroscore in relation to the duration of pregnancy.
Tab. II. Macroscore; score System for the degree of cloudiness and the amount of flakes of vernix in the amniotic fluid (VERPOEST and SEELEN, [2]).
degree of cloudiness/amount of flakes no±
++±
•H- -H-+
+++
score 01 23 45 6
cloudiness amount of flakes macroscore
none none
score 0 0 0
veryheavy
! heavyvery
score 6 6 12
l .2 Method of testing the macroscore
First an investigation was carried out to what extent the subjective assessment of cloudiness and of the quantity of flakes, are a justified and useful meas- urement for the macroscore.
For this purpose three independent observers, each with different experience in evaluating amniotic fluid, allocated a macroscore to 42 random samples of amniotic fluid. There was a significant positive correlation between the macroscore of the three observers (Pearson correlation coefficient between researchers l and 2 : 0.87, between researchers 2 and 3 :0.82 and between researchers l and 3:0.90).
Analysis of variance showed no difference in level between the observers (p = 0.48). The Standard deviation between the observers was l .2.
Testing the macroscore obtained by these three observers against an objective parameter, i.e. the optical density at 750 (ÖD 750), showed for each observer a significant correlation between the two (the Pearson correlation coefficient for observer l was 0.79, for observer 2 0.67 and for observer 3 0.88; observer 3 was the most experienced observer, observer 2 the least experienced one). Moreover, testing the macroscore of 244 samples of amniotic fluid against the optical density at 750 also showed a significant linear correlation (p = 0.803).
These statistics were performed by W 't Mannetje, Mathematisch-Statistisch Advies afdeling (Head of department Ph. v. ELTEREN), Katholieke Universi- teit Nijmegen.
Based on these points the macroscore seems an acceptable parameter for expressing the degree of cloudiness and the amount of flakes of vernix present in amniotic fluid.
2.1 Investigation of the amniotic fluid
The amniotic fluid is obtained by transabdominal amniocentesis; the colour and macroscore are assessed immediately.
All pregnant women were healthy and had a normal pregnancy, the duration of which was known.
They delivered healthy children of over 2750 gr.
Basically, pregnant women may be divided into two groups: one group where amniocentesis may be regarded äs a control-procedure during normal pregnancy (188 women, 484 tests) and another group where amniocentesis was carried out be- cause pregnancy exceeded 40 weeks (141 women, 229 Tests).
From each pregnant woman only the amniotic fluid obtained at the first amniocentesis is involved
J.Perinat. Med.4(1976)
14
Verpoest et al., The macroscore of amniotic fluid in this study, i.e. one sample per woman, unlessotherwise stated.
2.2 Definitions
Duration of pregnancy: number of days or weeks from the first day of the last menstrual period; the expression in weeks is äs follows, a pregnancy with a duration of "n" weeks comprises a pregnancy of
"n" weeks ± 3 days (for example 40 weeks is from the 227 th up to and including the 283 rd day).
Total gestation period: number of weeks n ± 3 days or number of days from the first day of the last menstrual period up to and including the day ofbirth.
3 Results
3. l Macroscore and duration of pregnancy
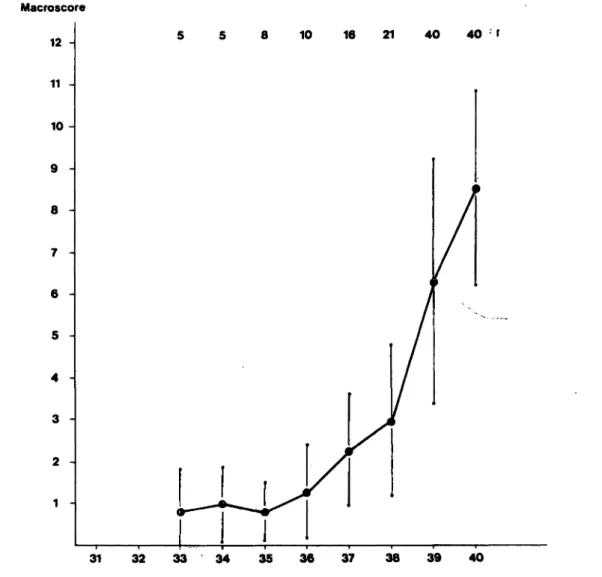
The mean macroscore (Fig. 1) up to the 32nd week of pregnancy is 0; the amniotic fluid is clear and does not contain any flakes. Subsequently, up into the 36 th week the mean score is 1—2, the amniotic fluid has a trace of cloudiness and it contains some very small flakes.
From the 36 th week onwards the mean score Starts to increase, slowty at first and then increasingly faster into the 40th week of pregnancy; the mean score is then 7.8 ± 3.1; the amniotic fluid is mod- erately cloudy and it contains a moderate amount of flakes. During the 41th week the mean macro- score drops; thereafter the average score increases again to 9.3 ± 2.5 in the 42nd week, i.e. consid- erably cloudy with a fairly large amount of flakes.
In pregnant women on whom more than one amniocentesis was carried out, the cumulative average increase of the macroscore per week (Fig. 2) shows that the increase between the 32th and 37th week of pregnancy is progressive, then linear until into the 40th week. In the 41th week this linear increase is displaced parallel by one week.
3.2 Macroscore near term
The macroscore per day and per half week from the 39 th up to and including the 42nd week (Fig. 3, Tab. III) shows that the score increases into the second half of the 40th week (8.5 ± 2.7) with the
highest score on the 281 and 282ndday. (8.6 ± LO;
8.8 ± 4.1). In the first half of the 41 th week the mean score is then considerably lower (7.7 ± 3.1) ( 2 test p < 0.05), after which it increases again, but in the second half of the 41 th week (8.0 ± 3.3) it is still lower than in the second half of the 40 th week ( 2 test 0.05 < p < 0.01).
The distribution of the frequencies of the macros- cores in the different stages of pregnancy (Fig. 4) shows that the increase of the mean macroscore up to the first half of the 40 th week is caused by a steady decrease in the lower scores and a strong increase in the medium scores; the higher scores increase only slightly. In the second half of the 40th week the lower scores decrease even more;
the higher mean macroscore duririg this week however is mainly caused by a decrease in the medium scores in favour of the higher scores, The subsequent decrease of the mean macroscore in the 41th week is based on a suddenly occurring in- crease in the lower scores at the expence of the higher scores. The mean macroscore subsequently increases again because of a strong reduction in the lower scores with a simultaneous increase in the higher .scores; the percentage of cases of amniotic fluid with medium scores remains almost constant. Thus, the 41 th week of pregnancy is characterised by a sudden increase in cases of amniotic fluid with a lower score; this is the cause of the reduction in the mean macroscore in this week.
3.3 Macroscore and birth
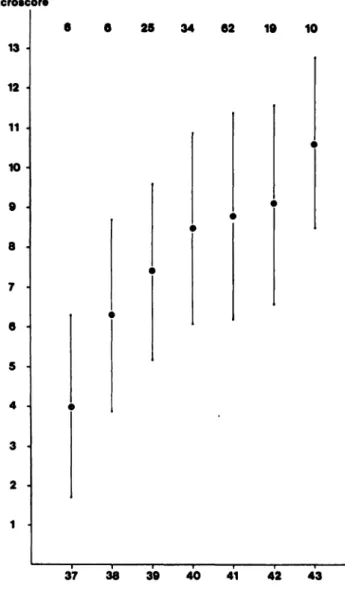
Fig. 5 and Tab. IV show that the earlier the delivery, the earlier occurs the increase in macroscore. In other word the score always increases in the days before delivery regardless of the duration of gestation. In the later weeks of pregnancy the macroscore is all the higher (lower) äs the birth comes earlier (later) (p < 0.001, Tab. V*).
Fig. 5 further shows that the later deliveiy, the higher macroscore at the end of pregnancy (p < 0.001, Tab. Vb); this is shown even more clearly in Fig. 6 which gives the mean macroscore
± l SD of samples of amniotic fluid obtained during the last week of pregnancy in births varying from the 37 until to 43 weeks.
Vcrpocst et al., The macroscorc of amniotic fluid 15
macroscore
1 0 1 3 2 1 S 1 2 3 2 2 S 6 5 15 9 20 19 26 60 124 15
Ϊ l l Ϊ l l 20 21 22 23 24 25 26 27 28 29 30 31 32 33 34 35 36 37 38 39 40 41 42 Fig. 1. Mean macroscore ± l SD in amniotic fluid during pregnancy. Abscissa bottom: pregnancy-week, top: number of samples, Ordinate: macroscore.
4. Discussion less» moderately cloudy and with a moderate num- . __ . , berof flakesof vernix at term (Tab. I).
Changes in the appearance of amniotic fluid occur
during pregnancy from yellow, clear and without The macroscore (Tab. II) gives a proper defmition flakes during the first half of pregnancy to colour- of this appearance.
J.Perinat. Med.4(1976)
16
Veipoest et al., The macroscore of amniotic fluid24- 23- 22- 21 - 20- 19- 18- 17- 16- 15- 14 13- 12- 11 - 10 9 8 7 6 5 4 3 2 1
Macroscore 12-
11-
10-
*-!
7 H
6 - J
4 H
266 273 280 287 294 301
34 35 36 37 38 39 40 41 42 43
Fig. 3. Mean macroscore per day and per half week of pregnancy near term. Abscissa: pregnancy-day, Ordinate:
Fig. 2. Cumulative average increase of the macroscore per macroscore.
week during pregnancy. Abscissa: pregnancy-week, x x per (jay ordinate: Cumulative increase of macroscore. · e per h^lf \yeek
Thereis arelation:
a) between the disappearance of the yellow colour (bilirubin) and the first occurrence of cloudiness and flakes;
b) between the duration of pregnancy and the macroscore; from the 32—36th week of preg- nancy the macroscore increases until birth
(Fig.
1).An exception is the mean macroscore in the 41 th week, which is lower than in the 40th week (p < 0.05);
c) between the total duration of gestation at birth and the progression of the macroscore during pregnancy (Fig. 5, Tab, IV); when birth takes place earlier (later) the macroscore will increase earlier (later).
This means that in the later weeks of. pregnancy the macroscore is the lower (higher), the later (earlier) birth occurs (p < 0.001; Tab. V*).
d) between the total duration of gestation at birth and the macroscore at the end of pregnancy;
with an earlier (later) bifth the macroscore is
Vcrpoest et al., The macroscorc of amniotic fluid 17
Tab. III. Macroscore (tnean X, Standard deviation SO and number n) near tcrm per day and per half week.
Macroscorc Preg-
nancy·
day 271270 272273
274275 276 278277 279280 281282 283 285284 287286
288289 290 292291 293294
per day X n 4.65.3 6.37.0
6.07.0 6.8 7.57.8 8.07.2
8.68.8 8.4 8.37.6 8.07.1
8.67.8 7.1 10.08.5 10.08.0
53 42
27 4 46 61
79 24 2515 2920 1510 8 62 41
per half week SD X n SD 2.7
2A 5'6 14
4.2
2.83.0 6.8 13 3.0
1.0
2^9 7.5 17 3.3
4.1 8.5 401.0 2.5
2.8
2* 7.7 89 3.1
3.23.4 8.0 33 3.6
3.72.8 9 2 n
1.6—
2.9
2.7
2.5
2.7
3.1
3.3
2.8
lower (higher) at the end of pregnancy (Fig. 5 and 6, Tab. IV; p < 0.001; Tab. Vb).
So, the macroscore, based on the appearance of the amniotic fluid, makes it possible to determine the duration of pregnancy after approximately the 35th week, admitedly with a certain, however determinable, margin of error.
Even more accurately it is possible to determin the time from birth (prepartal age) by the corre- lation between the development of the macroscore during pregnancy and the total gestation duration at birth. Both these aspects will be the subject of the thesis of one of us (VERPOEST; in preparation).
The fairly large Standard deviation of the macro- scores per week of pregnancy (Fig. 1) points how-
ever to a fairly largc inter-individual Variation in the appearance of the amniotic fluid at a certain duration of pregnancy.
This inter-individual Variation will partly be caused by the relation between the total gestation duration at birth and the increase in cloudiness and flakcs during pregnancy; the pregnant womcn of Fig. 1.
did have pregnancies varying in duration at birth from 37 to 43 weeks. But even when the macro- score in a given week of pregnancy is considered in prcgnancies with a given total gestation period,such äs in Fig. 7 for a gestation of 40 weeks, there is still a clear inter-individual Variation per pregnancy week.
The appearance of the amniotic fluid is deter- mined by elements originating from the fetal skin;
the cloudiness and flakes are caused by release and flaking off of vernix and cells from the stratum corneum (WOYTON 1963). No doubt there will be cells from other sources (amnion, oral cavity, respiratory and urogenital tract) present in the amniotic fluid, but these hardly contribute to its appearance.
Therefore, from the changes occurring in the appearance of the amniotic fluid conclusions may be drewn äs to changes in the function of the fetal skin.
From the 32nd to 34 th week of pregnancy vernix is being released, a little at first and then gradually more. The relation between the vernix layer and the duration of pregnancy is a well-known obste- trical fact; a premature newborn has much vernix, a postmature one none.
The appearance of the amniotic fluid is an indicator of the quantity of vernix that has been released;
very cloudy amniotic fluid with many flakes means there is little vernix left on the skin.
The amount of cloudiness and flakes, expressed äs macroscore, is therefore an indicator of the func- tional maturity of the fetal skin. Why the skin begins to release vernix at a given time, is the subject of a study of one of our group [3]; prelimi- nary results indicate that it depends on the func- tional maturation of the eccrine sweatglands; and this maturation depends on the functional ma- turation of the hypothalamic central nervous System. So the macroscore may be seen äs an indi- cator of maturation of the central nervous System.
J. Perinat. Med. 4(1976)
18
Verpoest et al., The macroscore of amniotic fluid100 - 90- 80- 70- 60- 50- 40- 30- 20- 10-
£3 score 11-12 score 9-10 score 7-8 score 5-6 score < 5
<270 270 277 281 284 288 >290 276 280 283 287 290
Fig. 4. Procentual macroscore distribution for different durations of pregnancy. Abscissa: pregnancy-day, Ordinate:
procentage.
The macroscore is only an indication of the dura- tion of pregnancy in so far äs the maturation of the fetus is correlated with this. The fairly con- siderable variations of the macroscore at a given duration of pregnancy (Fig. l and 7) indicate a great Variation in fetal maturation; some mature faster, others slower. Because of the correlation between the development of the macroscore and the total duration of gestation at birth (Fig. 5, Tab. IV), the faster maturing children will be delivered earlier, the slower maturing ones later.
This clearly shows the development of the child influencing the time of birth.
Apart from the degree of release of the vernix and the cells of the stratum corneum, the aspect of the amniotic fluid will also be determined by other factors, such äs the amount of vernix presents, the rate of drinking by the child, and above all by the volume of the amniotic fluid.
For identical quantities of released vernix and cells will of course cause less cloudiness in a large volume of amniotic fluid than in a smaller one. The volume of amniotic fluid is dependent on the duration of the pregnancy äs is its appearänce, and very prob- ably also more on the fünctional matürity of preg- nancy than on the duration itself.
Therefore, during the later weeks of pregnancy,
released vernix and amiiiotic fluid volume together will reflect the increase in macroscore äs a mani- festation of the maturing fetus on the one hand and äs a manifestation of the maturing pregnancy on the other. The higher macroscore düring thelast days prior to birth in pregnancies of longer
duration (Fig. 5 and 6) may possibly be explained
by a greater decrease in the volume of amniotic
fluid; is seems more probable that this higher
macroscore at a later delivery deyelops because
with a later delivery a less sensitive Uterus requires
Verpoest et al., The macroscore of amniotic fluid
19
12-
11-
10-
9 8-
7 -
6
5-
3-
2
—ι—39 —ι—
—r~ 42
31 32 33 34 35 —T-
36 37 38
40 41
43Fig. 5. Macroscore progression during pregnancy in relation to the total duration of gestation at birth. Abscissa: preg- nancy-week, Ordinate: macroscore.
χ χ delivery 256-262 days (37 weeks) delivery 284-290 days (41 weeks) χ χ delivery 263-269 days (38 weeks) · · delivery 291-297 days (42 weeks) x—·—χ delivery 270-276 days (39 weeks) o o delivery 298-304 days (43 weeks)
delivery 277-283 days (40 weeks)
a greater maturity of the fetus and of pregnancy for delivery to Start. A fascinating aspect is the drop of the mean macroscore in the 41 th week of pregnancy, caused by a sudden relative increase of amniotic fluids with lower macroscores (Fig. 4).
A lower score at a given moment means either a shorter duration of pregnancy or, with a given
duration of pregnancy, a longer total gestation, i.e. a later birth.
Table VI shows the relation between the macro- score and the number of days until birth.
With a score of 11-12, 92.9% of the women w l deliver within one week and 85.7% within 5 days;
with a decreasing macroscore this percentage be-
J. Perinat. Med. 4(1976) 2*
20
Verpoest et al., The macroscore of amniotic fluidTab. IV. Macroscore (mean X, Standard deviation SD and number n) äs a function of the duration of pregnancy in relation to the total duration of gestation at birth (all amniocenteses)
Total gestation time at birth (days) duiation of
pregnancy (days) 3132 3334 3536 3837 4039 4142 43
N44
duration of pregnancy (days) 3132 3433 3536 3738 4039 4142 4344
256-262 X
1.0_
—2.0 4.02.0__
_
-
—
—
—
—
SD 1.0_
—2.0 2.32.3_
_
-
—
—
—
—
n 2
— _
62 _6
—-
——
——
284-290 X
—
—_
1.01.5 2.92.2 3.38.0 8.8—
——
SD
—
—_
0.51.0 0.71.3 2.51.6 2.5—
——
n
—
—— _ 22 106 4212 74
—
—
—
263-269 X
_—
—— 1.02.0 6.02.7
——
——
——
SD n
— —1
~ —— — 0.9 5 1.6 4 1.0 7 3.0 9 _ — - +-— -^
— -^
— —— —
291-297 X
3.0r—_
— -r
—
4.0—
5.57.8 9.1—
—
SD n
-s- -s-.
1
— —— —
— —— —
— —1 2.1 8 2.9 44 2.5 20 _ —
— —
270-276 X
—1.0 1.01.8 1.31.5 4.52.4 6.8
———
——
298 X
—
—_
—
—
—2.0
— 4.13.0 10.28.2
—
SD
—1.0
— 1.81.2 1.61.3 2.02.3
—— -=
——
-304 SD
_=_
_
—_
—
—
—
—_
0.82.1 2.72.4
—
277-283 n X SD _ _ _
2 2.0
2 0,8 1.0 4 1.0 0.9 10 0.8 0.7 12 1.3 1.1 14 2.3 1.3 23 3.0 1.8 37 6.3 2.9 _ 8.5 2.3 -" — -- —
— ^ - _ _ _
— — _i.
n
^_
^— _— _
— _1 143 1912
—
n
— 25 58 1016 4021 40—
^—
—
Tab. V. Coirelation (Pierson correlation coefficient P) between the macroscore at a given pregnancy week (V3), the macroscore in the last days before birth (Vb) and the duration of pregnancy at birth.
duration of pregnancy (weeks) 3635 3738 3940 4142
correlation coefficient - 0.0032 - 0.004 -0.115 -0.355 - 0.409 -0.317 .- 0.562 -0.501
number
2327 4357 6977 12371
P
__ 0.01— 0.010.01 0.010.01
days before birth
01 23 45 67 89 10
correlation coefficient - 0.492
0.490 0.535 0.553 0.665 0.641 - 0.014 0.586 0.550 0.256 0.520
number
3185 5343 3227 2625 3217 14
P
0.01 O.Öl0.01 0.010.01 0.01 0.010.01_
. 0.05 0.1
Verpoest et al., The macroscore of amniotic fluid 21 Macrotcor·
13 12 11 10 9
θ 0 26 34 62 1Θ 10
37 36 30 40 41 42 43 Fig. 6. Mean macroscore ± l SD, obtained at the last amniocentesis in the last week of pregnancy, for deliveries, varying from the 37th to the 43rd week. Abscisse bottom:
delivery-week, top: number of samples, Ordinate: Macro- score.
comes successively lower, a steadily increasing percentage delivers later; with a score of < 5, only 22.2% delivers within one week and 11.1 % within 5 days; 51.9% of birth only takes place after more than 10 days.
The length of the period between puncture and birth for a given macroscore in a given week of pregnancy is shown in table VII. For a macroscore of < 5, and with a given duration of pregnancy, it will take an average of another 8 or 10 days before birth takes place.
The decrease in the mean macroscore during the 41 th week of pregnancy is due to the emergence of aconsiderable group of pregnant women (approx.
25% of all pregnant women in this week) who have a considerably longer total duration of pregnancy.
The average duration of pregnancy for this group at puncture during the first half of the 41th week is 295.4 ± 4.7 (number 13) days and at puncture during the second half of the 41 th week it is 299.1
± 7.6 (number 8) days.
The most obvious explanation for this phenomenon is that pregnant women can be divided into two groups: one group for whom physiological preg- nancy lasts 280 plus minus a certain number of days, and another group for whom physiological pregnancy lasts about two weeks longer.
In addition to a physiological significance, this characteristic has an importent practical signifi- cance, when treating postmaturity.
Tab. VI. Relation between macroscore and days from birth.
Macroscore number Frequency distribution (%) of number of days from birth 2 3-4· 5-6 7-8 9-10
Total
11-12 9-107-8 5-65
2818 5312 27
60.755.6 39.633.3 7.4
25.027.8 18.925.0 3.7
7.1 18.9—
16.711.1
7.1 11.3—
25.98.3
16.77.5 8.3
—
_
—3.8 51.98.3
100.199.9 10099.9 100
J. Perinat.Med. 4(1976)
22
Verpoest et al., The macroscore of amniotic fluid8 10 16 21 40 40 r
1 -
31 32 33 34 35 36 37 38 39 40
Fig. 7. Mean macroscofe ± l SD duiing pregnancy for deliveries in the 40th week. Abscissa bottom: pregnancy^week, top: number of samples; ordinate: macroscore.
Tab. VII. Days (mean ± Standard deviation) between puncture and delivery at a given macroscore on a given pregnancy day (number of women in brackets).
Macroscore
277-280
number of days between puncture and delivery pregnancy day of puncture
281-283 284-287 288-290
9-125-8
<5
0 (2) 3.6 ± 3.4 (12) 16.5 ±4.9 (2)
2.7 ±1.9 (12) 4.7 ± 3.2 (15) 9.3 ±3.3 (4)
3.0 ± 2.5 (21) 4.3 ± 3.3 (29) 9.5 ± 4.7 (13)
2.0 ± 2.3 (11) 3.2 ±3.2 (9) 10.3 ±7.3 (8)
Summary
During the first two trimesters of pregnancy the amniotic fluid is clear and yellow; during the third trimestef the amniotic fluid becomes colourless; then, approximately from the 33rd-34rd weekon, cloudiness and flocculation
occur, at first Very slowly, after the 36th-37th week steadüy faster (Tab. I). At term, the amniotic fluid is moderately cloudy and contains a moderate number of flakes of vernix. The appearance of the amniotic fluid
Verpoest et al., The macroscore of amniotic fluid
23
depending on the degree of cloudiness and on the number of flakes, has been expressed by means of a score System, the socalled macroscore (Tab. H).
Relationships were observed:
a) between the disappearance of the yellow colour (bili- rubin) and the initial occurrence of cloudiness and flocculation;
b) between the duration of pregnancy and the macro- score; from the 32nd-36th week of pregnancy the mean macroscore increases until the second half of the 40th week; then in the 41 st week there is a drop in the mean macroscore, after which a new increase occurs (Fig. l, 2 and 3).
c) between the total gestation period at birth and the pro- gression of the macroscore (Fig. 5); when birth takes place earlier (later), the. macroscore will increase earlier (later).
d) between the total duration of gestation at birth and the macroscore at the end of pregnancy; with an earlier (later) birth, the macroscore is lower (higher) (Fig. 5 and 6).
With the macroscore it is possible to determine the duration of pregnancy (b) and the time before birth even more accurately (c). The fairly large Standard deviation of the macroscore per pregnancy week (Fig. 1) also in case of a given duration of gestation at birth (Fig. 7) points to a fairly large interindividual Variation in the appearance of the amniotic fluid at a certain duration of pregnancy.
The macroscore is determined by elements originating from the fetal skin; the cloudiness and flocculation are caused by release of vernix and the flaking off of cells from the stratum corneum. Hence the macroscore reflects changesin thefunction of the fetal skin and is an indicator of the functional maturation of the fetal skin.
The considerable Variation of the macroscore at a given duration of pregnancy indicates a great Variation of fetal maturation. The fetus that is maturing faster, will be delivered earlier; the fetus that is maturing slower, later (c).
This points to a correlation between the degree of fetal maturation and the Start of labour. The higher macroscore during the last days before birth in pregnancies of longer duration (d) (Fig. 5 and 6) may be explained by a less sensitive uterus, requiring a greater maturity of the fetus for delivery to start.
The drop of the mean macroscore in the 41 st week of pregnancy is due to a sudden increase of lower scores in this week (Fig. 4). A lower score at a given stage of preg- nancy means a later birth (Tab. VI and VII).
Thus in the 41 st week of pregnancy a considerable group of prägnant women appears, that has a total duration of gestation that is, on the average, two weeks longer than normally. The most obvious explanation is that pregnant women can be divided into two groups:
one for whom physiological pregnancy lasts about 280 days, the other for whom physiological pregnancy lasts two weeks longer. This has an important practical signifi- cance in cases of postmaturity.
Keywords: amniotic fluid, appearance, fetal skin, fetus, macroscore, maturation, pregnancy, vernix.
Zusammenfassung
Veränderungen im Aussehen des Fruchtwassers während der Schwangerschaft - der Macroscore
Während des ersten und zweiten Trimenons zeigt das Fruchtwasser eine hellgelbe Farbe, dann tritt im Laufe des dritten Trimenons ein farbloser Aspekt auf. Von der 3S.-34. Woche erscheinen kleine Flöckchen und eine Trübung mit einer raschen Zunähme nach der 36.—37.
Woche (Tab. I).
Mit Hilfe eines Punktesystems, des sogenannten Macro- score wird das Aussehen des Fruchtwassers aufgrund des Trübungsgrades und der Flockendichte zum Ausdruck ge- bracht (Tab. II).
Unsere Untersuchungen ergaben folgende Beziehungen:
a) zwischen dem Verschwinden der gelben Farbe (Bill·
rubin) und dem Zeitpunkt des Auftretens von Trübung und Flöckchen.
b) zwischen der Schwangerschaftsdauer und dem Macro- score: Von der S2.-36. Woche steigt der mittlere Macroscore bis in die zweite Hälfte der 40. Woche an.
In der 41. Woche folgt eine Abnahme, später nimmt der mittlere Macroscore wiederum zu (Fig. l, 2 und 3).
c) zwischen der Schwangerschaftsdauer zum Zeitpunkt der Geburt und dem Verlauf des Macroscores (Fig. 5).
Findet die »Geburt früher bzw. später statt, so steigt der Macroscore früher, bzw. später an.
d) zwischen der Schwangerschaftsdauer zum Zeitpunkt der Geburt und dem Macroscore am Ende der Schwan- gerschaft: Bei einer früher bzw. später stattfindenden Geburt ist der Macroscore niedriger, bzw. höher (Fig. 5 und 6).
Anhand unseres Macroscore ist es möglich, die Schwanger- schaftsdauer zu bestimmen (b) und mit einer größeren Genauigkeit die Zeitspanne bis zur Geburt (präpartuales Alter) festzulegen (c).
Die bemerkenswert große Variation des Macroscore zu jedem Zeitpunkt der Schwangerschaft (Fig. 1) weist auf eine ziemlich große individuelle Variation des Frucht- wasseraspektes hin, dies gilt auch dann, wenn die Geburt bei einer gegebenen Schwangerschaftsdauer erfolgt (Fig. 7).
Der Macroscore wird durch Elemente, welche von der fetalen Haut herrühren, bestimmt: Trübung und Flocken- dichte werden durch die Emulgierung der Vernix und die Abschuppung von Zellverbänden des stratum corneum bedingt. Somit ist der Macroscore ein Parameter für die funktioneile Reifung der fetalen Haut. Die bedeutende Variation des Macroscore zu jedem Zeitpunkt der Schwan- gerschaft weist auf große individuelle Unterschiede des fetalen Reifegrades hin. Je fortgeschrittener der Reifegrad, um so früher erfolgt die Geburt, je langsamer die fetale Reifung erfolgt, um so später wird das Kind geboren (c).
Es besteht eine Korelation zwischen dem Reifegrad und J. Perinat.Med. 4(1976)
24
Verpoest et al., The macroscore of amniotic fluid dem Geburtstermin. Die interessante Beobachtung, daßder Macroscore am Ende der Schwangerschaft bei einer früher stattfindenden Geburt niedriger, bei einer später stattfindenden Geburt höher ist, läßt sich vielleicht da- durch erklären, daß eine weniger empfindliche Uterus- muskulatur eine größere Reifung des Feten erfordert um mit Wehenbeginn zu reagieren.
Das Absinken des mittleren Macroscore in der 41. SSW.
wird verursacht durch eine rasch erfolgende prozentuale Zunahme von Fruchtwasser mit einem niedrigen Score (Fig. 4).
Weü ein erniedrigter Macroscore bei einer gegebenen Schwangerschaftsdauer eine spätere Geburt bedeutet (Tab. VI und VII), ist in deirf41. SSW eine Gruppe von Frauen zu eruieren, deren Gesamtschwangerschaftsdauer eine normale Schwangerschaftsdauer um durchschnittlich 2 Wochen überdauert. Wir schließen daraus, daß schwan- gere Frauen in zwei Gruppen einzuteilen sind, von denen die einen eine physiologische Schwangerschaftsdauer von 280 Tagen, die andere eine um zwei Wochen verlängerte physiologische Schwangerschaftsdauer aufweist. Diese Interpretation hat eine große praktische Bedeutung zur Beurteilung der Übertragung.
Schlüsselworte: Fruchtwasser (Aussehen), Haut (fetale), Macroscore, Reifegrad, Schwangerschaft, Vernix.
Resume
Alterations de l'aspect du liquide amniotique durant la grossesse - Le macroscore
Durant les premier et deuxieme trimestre de la grossesse, le liquide amniotique est de couleur jaune clair et devient
\incolore au cours du troisieme trimestre. Entre la 33eme et 34 eme semaine apparaissent des petits flocons et un aspect trouble qui augmentent rapidement apres les 36.-3 7 eme semaines (Tab. I).
A Faide d'un Systeme de points, ledit macroscore, nous avons pu definir le degre de trouble et la densite des flocons du liquide amniotique (Tab. II) et etablir les
•rapports suivants:
a) entre la disparition de la couleur jaune (bilirubine) et le moment d'apparition du trouble et des flocons;
b) entre la duree de grossesse et le macroscore: Le macroscore moyen monte de la 32.-36eme semaine jusqu'a la seconde moitie de la 40 eme semaine, Puis succede une baisse dans la 41 eme semaine apres laquelle le macroscore moyen commence a remonter (Fig. l, 2 et 3);
c) entre la duree de grossesse au moment de Faccouchement et la courbe du macroscore (Fig. 5). Selon que la nais- sance a lieu plus o u moins tot, le macroscore monte plus ou moins tot;
d) entre la duree de grossesse au moment de Faccouche- ment et le macroscore ä la fin de la grossesse: La hausse du macroscore suit la courbe de la date de la naissance (Fig. 5 et 6).
A Faide de notre macroscore il est possible de determiner la duree de grossesse (b) et de fixer avec plus grande pre- cision le delai jusqu'a la naissance (äge prepartuel) (c). La Variation etonnamment grande du macroscore pour chaque Periode de la grossesse (Fig. 1) reflete une Variation in- dividuelle assez grande de l'aspect du liquide amniotique,
meme lorsque la naissance a lieu dans une duree de grossesse donnee (Fig. 7). -
Le macroscore est determine par des elements qui proviennent de la peau du foetus: le trouble et la densite des flocons resultent de Femultionnement de la vernix et de Fecaillage d'agglpmeres cellulaires du stratum corneum.
Le macroscore represente ainsi un parametre pour la maturation fonctionnelle de la peau foetale. L'importante Variation du macroscore a chaque moment de la grossesse resulte de grandes differences individuelles dans le degre de maturite foetale. Plus ce degre est avancee, plus tot aura lieu Faccouchement et, inversement, l'enfant naitra d'autant plus tard que la maturation foetale se fait lentement (c). II existe bien, comme on le voit, une correlation entre le degre de maturite et la date de l'accou- chement. L'observation interessante que le macroscore a la fin de la grossesse est plus bas a une naissance plut lot et plus haut a une naissance plus tarde, s'explique peut- etre du fait qu'une musculature moins sensible necessite une plus grande maturation du foetus pour que se declenche Finduction du travail.
La baisse du macroscore moyen dans la 41 eme semaine de grossesse est causee par une augmentation procentuelle rapide du liquide amniotique (Fig. 4).
Etant donne que pour une duree de grossesse indiquee, une baisse du macroscore signifie un retard de la naissance (Tab. VI et VII), il faut decouvrir parmi les patientes se presentant dans la 41 eme semaine de grossesse celles dont la duree totale de grossesse depassera de deux semaines en moyenne la duree normale. Nous en concluons que les femmes enceintes doivent etre reparties en deux groupes dont Fun comporte une duree de grossesse physiologique de 280 jours et Fautre de deux semaines de plus. Cette Interpretation est d'une grande importance pratique pour Fexamen de la transmission.
Mots-cles: Liquide amniotique, aspect, peau foetale, foetus, macroscore, maturation, grossesse, vernix.
Bibliography
[1] SEELEN, J. C: Amniocentese en Vruchtwateronder- zoek. In: Seelen, J. C, H. A. 1: M. van Leusden, A. C. Drogendijk, K. H. H. Verschoof: De bewaking van het kind in utero. De Nederlandse Bibliotheek der
Geneeskundej deel 82. Stafleu's Wetenschappelijke Uitgeversmaatschappij BV, Leiden 1973
[2] VERPOEST, M. J. L. T., J. C. SEELEN: Der richtige Zeitpunkt zur Geburtseinleitung bei Termin-Über-
Verpoest et al., The macroscore of amniotic fluid 25
schreitung. In: DUDENHAUSEN, J. W., E. SALING, E. SCHMIDT: Perinatal. Medizin. Band VI. 7. Deutscher Kongreß für Perinatale Medizin. Berlin, 1974. Thieme, Stuttgart 1975.
[3] VOETS, W.: Studies over de herkomst van troebeling en vlokken en het alkalische fosfatase in het vrucht- water. Dissertation, Utrecht 1976
[41 WLADIMIROFF, J. W., M. J. L. T. VERPOEST, J. C. SEELEN: Het vruchtwater in het verloop van de zwangerschap. Nederl. Tijdschr. v. Geneesk. 116 (1972) 1965
[51WOYTON, J.: Die Beurteilung des Reifesgrades des Frucht auf Grund der Fruchtwasseruntersuchung. U.
TeU. Zbl. Gynäk. 85 (1963) 552
Received May 2,1975. Accepted October 5,1975.
Dr. J. C. Seelen
Afdeling Verloskunde en Gynaecologie Westeinde Ziekenhuis
Den Haag Netherlands.
J. Perinat. Med. 4(1976)
![Tab. II. Macroscore; score System for the degree of cloudiness and the amount of flakes of vernix in the amniotic fluid (VERPOEST and SEELEN, [2]).](https://thumb-eu.123doks.com/thumbv2/1library_info/5656730.1694231/2.897.55.423.643.1002/macroscore-degree-cloudiness-flakes-vernix-amniotic-verpoest-seelen.webp)