An Econometric Analysis of Intra-daily Stock Market Liquidity, Volatility and News Impacts
D I S S E R T A T I O N
zur Erlangung des akademischen Grades doctor rerum politicarum (Dr. rer. pol.)
im Fach Volkswirtschaftslehre eingereicht an der
Wirtschaftswissenschaftlichen Fakultät Humboldt-Universität zu Berlin
von
Axel Groß-Klußmann, M.Sc.
Präsident der Humboldt-Universität zu Berlin:
Prof. Dr. Jan-Hendrik Olbertz
Dekan der Wirtschaftswissenschaftlichen Fakultät:
Prof. Dr. Ulrich Kamecke Gutachter:
1. Prof. Dr. Nikolaus Hautsch 2. Prof. Dr. Christian Conrad eingereicht am: 02.03.2012
Tag der mündlichen Prüfung: 14.05.2012
In this thesis we present econometric models and empirical features of intra-daily (high frequency) stock market data. We focus on the measurement of news impacts on stock market activity, forecasts of bid-ask spreads and the modeling of volatility measures on intraday intervals.
First, we quantify market reactions to an intraday stock-specific news flow. Using pre-processed data from an automated news analytics tool we analyze relevance, novelty and direction signals and indicators for company-specific news. Employing a high-frequency VAR model based on 20 second data of a cross-section of stocks traded at the London Stock Exchange we find distinct responses in returns, volatility, trading volumes and bid-ask spreads due to news arrivals.
In a second analysis we introduce a long memory autoregressive conditional Pois- son (LMACP) model to model highly persistent time series of counts. The model is applied to forecast quoted bid-ask spreads, a key parameter in stock trading op- erations. We discuss theoretical properties of LMACP models and evaluate rolling window forecasts of quoted bid-ask spreads for stocks traded at NYSE and NAS- DAQ. We show that Poisson time series models significantly outperform forecasts from ARMA, ARFIMA, ACD and FIACD models in this context.
Finally, we address the problem of measuring volatility on small 20 second to 5 minute intra-daily intervals in an optimal way. In addition to the standard realized volatility approaches we construct volatility measures by integrating spot volatility estimates that include information on observations outside of the intra-daily intervals of interest. Comparing the alternative volatility measures in a simulation study we find that spot volatility-based measures minimize the RMSE in the case of small intervals.
Zusammenfassung
In dieser Dissertation befassen wir uns mit ökonometrischen Modellen und empiri- schen Eigenschaften von Intra-Tages (Hochfrequenz-) Aktienmarktdaten. Der Fokus liegt hierbei auf der Analyse des Einflusses, den die Veröffentlichung von Wirtschafts- nachrichten auf die Aktienmarktaktivität hat, der Vorhersage der Geld-Brief-Spanne sowie der Modellierung von Volatilitätsmaßen auf Intra-Tages-Zeitintervallen.
Zunächst quantifizieren wir die Marktreaktionen auf Marktneuigkeiten innerhalb eines Handelstages. Zu diesem Zweck benutzen wir linguistisch vorab bearbeitete Un- ternehmensnachrichtendaten mit Indikatoren über die Relevanz, Neuheit und Rich- tung dieser Nachrichten. Mit einem VAR Modell für 20-Sekunden Marktdaten der London Stock Exchange weisen wir durch Nachrichten hervorgerufene Marktreak- tionen in Aktienkursrenditen, Volatilität, Handelsvolumina und Geld-Brief-Spannen nach.
In einer zweiten Analyse führen wir ein long memory autoregressive conditio- nal Poisson (LMACP)-Modell zur Modellierung hoch-persistenter diskreter positiv- wertiger Zeitreihen ein. Das Modell verwenden wir zur Prognose von Geld-Brief- Spannen, einem zentralen Parameter im Aktienhandel. Wir diskutieren theoreti- sche Eigenschaften des LMACP-Modells und evaluieren rollierende Prognosen von Geld-Brief-Spannen an den NYSE und NASDAQ Börsenplätzen. Wir zeigen, dass Poisson-Zeitreihenmodelle in diesem Kontext signifikant bessere Vorhersagen liefern als ARMA-, ARFIMA-, ACD- und FIACD-Modelle.
Zuletzt widmen wir uns der optimalen Messung von Volatilität auf kleinen 20 Se- kunden bis 5 Minuten Zeitintervallen. Neben der Verwendung von realized volatility- Ansätzen konstruieren wir Volatilitätsmaße durch Integration von spot volatility- Schätzern, sodass auch Beobachtungen außerhalb der kleinen Zeitintervalle in die Volatilitätsschätzungen eingehen. Ein Vergleich der Ansätze in einer Simulationsstu- die zeigt, dass Volatilitätsmaße basierend auf spot volatility-Schätzern den RMSE minimieren.
Contents
Acknowledgements 1
1 Introduction 3
1.1 On intraday stock market activity . . . 3
1.2 Outline of the thesis . . . 4
2 Quantifying High Frequency News-implied Market Reactions 7 2.1 Introduction . . . 7
2.2 Data . . . 9
2.3 Unconditional Effects of News Items . . . 14
2.3.1 Impact on Volatility and Liquidity . . . 14
2.3.2 Trading Profitability . . . 18
2.4 Market Dynamics around News Items . . . 21
2.4.1 Econometric Methodology . . . 21
2.4.2 Estimation Results . . . 23
2.4.3 Impulse Response Analysis . . . 26
2.5 Conclusions . . . 29
A Appendix . . . 31
3 A Forecasting Framework for Bid-Ask Spreads 35 3.1 Introduction . . . 35
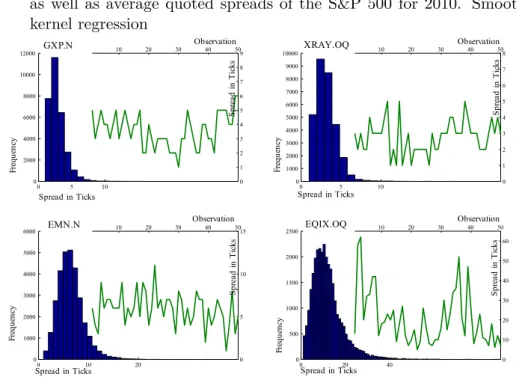
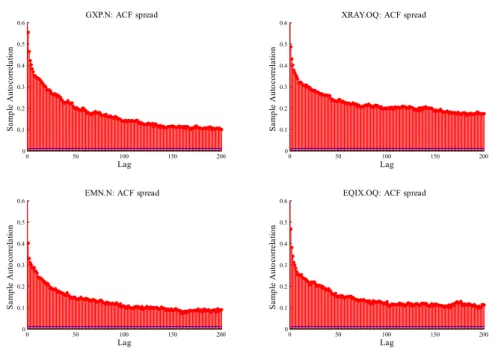
3.2 Properties of Bid-Ask Spreads . . . 36
3.2.1 The Bid-Ask Spread as a Liquidity Measure . . . 36
3.2.2 Empirical Properties . . . 37
3.3 An Econometric Model for Bid-Ask Spread Dynamics . . . 42
3.3.1 The Autoregressive Conditional Poisson model . . . 42
3.3.2 Long Memory Autoregressive Conditional Poisson Models . . . 44
3.4 Forecasting Bid-Ask Spreads . . . 47
3.4.1 Computation of Forecasts . . . 47
3.4.2 Additional Predictors based on Market Microstructure Theory . . 48
3.4.3 Forecast Benchmarks . . . 49
3.4.4 Point and Directional Forecast Evaluation . . . 50
3.5 Results . . . 51
3.5.1 Estimation Results and RMSE Performance . . . 51
3.5.2 A Trading Schedule based on Spread Forecasts . . . 57
3.5.3 Robustness of the Results . . . 59
3.6 Conclusions . . . 59
B Appendix . . . 60
B.1 Technical appendix . . . 60
B.2 Evolution of Coefficient Estimates . . . 61
4 Modelling Volatility Measures on Intra-Daily Time Intervals 65 4.1 Introduction . . . 65
4.2 Intraday volatility measures . . . 67
4.2.1 Realized measures of volatility . . . 67
4.2.2 Volatility measures based on spot volatility estimators . . . 71
4.3 Comparing Intraday Volatility Estimators in a Monte Carlo Simulation Study . . . 77
4.4 Empirical comparison of intraday volatility measures . . . 86
4.4.1 Data and model calibration . . . 86
4.4.2 Empirical Properties of Intraday Volatility Measures . . . 88
4.4.3 A model for intraday returns and volatility . . . 90
4.4.4 The tail probabilities of intraday returns . . . 92
4.5 Conclusions . . . 97
C Appendix . . . 98
C.1 Finite sample adjustment of the pre-averaging estimator . . . 98
C.2 Kernel functions . . . 98
C.3 Simulation of the SV models with seasonality . . . 98
C.4 Optimal bandwidth according to the grid-search procedure (2- factor model) . . . 99
C.5 Simulation results for the 2-factor model with microstructure noise of magnitude ω2= 0.00001 . . . 101
C.6 Sample autocorrelations of four volatility measures . . . 103
C.7 Basic descriptive statistics for the AAPL.OQ volatility measures . 105 C.8 Real Data results: RV Garch based on t-distribution, α= 10% . . 107
Bibliography 119
List of Figures 122
List of Tables 123
Acknowledgments
First of all I would like to express my deep gratitude towards my supervisor Nikolaus Hautsch for his exceptional support and guidance over the past years. Without his encouragement, comments and suggestions this thesis could not have been written. I would also like to thank Christian Conrad for kindly accepting the task of being co- examiner as well as for his comments on the draft.
This thesis has benefited hugely from the expertise and atmosphere at the chair of econometrics at HU Berlin. I would like to thank my friends and colleagues at the chair of econometrics for valuable advice and many pleasant discussions, especially Bernd Droge, Jonas Haase, Gustav Haitz, Ruihong Huang, Franziska Lottmann, Peter Malec, Tomas Polak, Julia Schaumburg and Melanie Schienle.
The main fraction of the thesis was written at the Deutsche Bank Quantitative Prod- ucts Laboratory (QPL), a research collaboration between Deutsche Bank, Humboldt Universität and Technische Universität Berlin. Over several years I enjoyed the working atmosphere, financial support and especially the DB data infrastructure. Many thanks are thus due to the directors of QPL, Peter Bank, Almut Birsner and Ulrich Horst.
Moreover, I thank my friends and colleagues at the QPL for valuable advice and the pleasant atmosphere, in particular Gökhan Cebiroglu, Peter Kratz, Lada Kyj, Markus Mocha and Nicholas Westray.
I also wish to thank the financial market practitioners from Deutsche Bank and Thom- son Reuters who commented on the work and gave me the opportunity to discuss and showcase the results at conferences. In particular I thank Richard Brown, Boris Drovet- sky, Kerr Hatrick and Roel Oomen.
Finally, I thank my family and friends for their patient support during the last years.
1 Introduction
1.1 On intraday stock market activity
The last years have witnessed a drastic increase in market activity at major stock ex- changes. Chordia et al. [2011] report an increase of the average monthly shares traded per outstanding shares from 5% to 26% in 1993 - 2003, while turnover virtually stag- nated in the decade before 1993. Most notably, the number of daily transactions even increased ninetyfold during 1993-2008, indicating a fundamental change in the way of trading.
The changes in market activity are undoubtedly linked to the past and ongoing au- tomatization of trading. The technological change dramatically reduced the costs of market participation and ultimately led to the advent of so-called algorithmic trading.
Algorithmic trading is commonly defined as the use of computer algorithms to automat- ically submit, organize and manage orders for the purpose of trading (see Hendershott et al. [2011]). The automated trading strategies rely heavily on the statistical analysis of daily and intra-daily market activity data, the availability of which has become industry standard. An important subset of algorithmic trading in this context is high frequency trading, where trading decisions are based on data at very high intraday frequencies.
The importance of algorithmic trading on financial markets cannot be underestimated.
Hendershott et al. [2011] report that about 73 % of the trading volume in the United States are due to algorithmic trading. However, the consequences of this dramatic de- velopment are less clear. While basic liquidity cost measures have declined considerably over the past decade, the effect of algorithmic trading on the overall market quality is virtually unexplored. The reported improvements in the stock market liquidity are typ- ically short-lived and concentrated on the stocks with very high market capitalization.
Moreover, the events of the May 6th 2010 "flash crash" at exchanges in the US have raised serious concerns about the risks associated with high frequency and algorithmic trading. In the time-span of half an hour on this day the Dow Jones Industrial Average declined by 1014.14 points, the biggest intraday decline in its history, before rebounding rapidly. Surprisingly, no fundamental new information or change in market sentiment could be attributed to the sudden $ 1 trillion drop in market value (Easley et al. [2011]).
Research documents of the US securities and exchange comission (see SEC and CFTC [2010]) as well as studies such as Kirilenko et al. [2011] confirm that the overreliance on high frequency trading and computerized systems crucially contributed to the crash.
The reason for the crash was likely a wrongly configured trading program which trig- gered the reaction of other trading programs, leading in the end to rapid price drops. In view of the tail risks it is thus still doubtful whether the algorithmic trading industry contributes to the stability of financial markets and the overall welfare or can rather be
considered a dangerous arms race
While the subsequent chapters of this thesis do not go into detail on the risks and merits of algorithmic trading, they contribute to a better understanding of the empirical features of intraday (high frequency) market data, which is of interest for regulators of markets, market participants and academics interested in the econometric analysis of high frequency data. The thesis focuses on three empirical aspects of intraday trading activity that have not received attention so far, but are important to the statistical support of trading decisions.
First, we present econometric models and empirical results on the impact of public news on stock markets. As yet another indication of the fast technological change, news vendors offer an immediate automated interpretation of various news texts and headlines in the instant of a millisecond. Whenever machine-readable news are generated around the world, programs based on linguistic pattern recognition techniques derive trading signals from the news text that can be fed to trading algorithms instantaneously. Our analysis draws on signals from such a news engine in order to quantify the impact of company-specific news on financial markets using high frequency data.
Second, we propose a novel model and forecasting framework for bid-ask spreads which are important indicators of market liquidity on stock markets. The time series of bid-ask spreads poses interesting challenges for an econometric model as the spread is discrete and typically exhibits a long memory time series behavior.
Third, we model intraday volatility on small intraday intervals. The literature on volatility measures so far covers mainly daily frequencies. However, the increasing intra- day trading activity requires risk measures for intra-daily intervals. In this context we propose to use spot volatility based measures of volatility to overcome the small sample problem encountered in case of small intraday intervals.
1.2 Outline of the thesis
In chapter 2 we examine high-frequency market reactions to an intraday stock-specific news flow.1 Using unique pre-processed data from an automated news analytics tool based on linguistic pattern recognition we analyze relevance, novelty and direction signals and indicators for company-specific news. Employing a high-frequency VAR model based on 20 second data of a cross-section of stocks traded at the London Stock Exchange we find distinct responses in returns, volatility, trading volumes and bid-ask spreads due to news arrivals. We show that a classification of news according to its relevance indicator as given by the linguistic pre-processing is crucial to filter out noise and to identify significant effects. Moreover, sentiment indicators have predictability for future price trends though the profitability of news-implied trading is deteriorated by increased bid- ask spreads.
In chapter 3 we introduce a long memory autoregressive conditional Poisson (LMACP)
1A version of this chapter is published in theJournal of Empirical Finance (see Groß-Klußmann and Hautsch [2011a]).
1.2 Outline of the thesis model to model highly persistent time series of counts.2 The model is applied to forecast quoted bid-ask spreads, a key parameter in stock trading operations. It is shown that the LMACP nicely captures salient features of bid-ask spreads like the strong autocorrelation and discreteness of observations. We discuss theoretical properties of LMACP models and evaluate rolling window forecasts of quoted bid-ask spreads for stocks traded at NYSE and NASDAQ. We show that Poisson time series models significantly outperform forecasts from ARMA, ARFIMA, ACD and FIACD models. The economic significance of our results is supported by the evaluation of a trade schedule. Scheduling trades according to spread forecasts we realize cost savings of up to 13 % of spread transaction costs.
In the last chapter we address the problem of measuring volatility on small 20 second to 5 minute intra-daily intervals in an optimal way. In addition to the standard realized volatility approaches we construct volatility measures by integrating spot volatility es- timates that include information on observations outside of the intra-daily intervals of interest. Comparing the alternative volatility measures in a simulation study we find that spot volatility-based measures minimize the RMSE in the case of small intervals. In an empirical analysis we propose a multiple component realized GARCH framework for intraday returns and evaluate the tail probabilities of the return distributions implied by competing volatility measures. The analysis shows that standard realized measures of volatility and volatility measures constructed from spot volatility estimates contain information beyond squared returns and improve the tail fit of the multiple component realized GARCH.
2See the working paper Groß-Klußmann and Hautsch [2011b].
2 Quantifying High Frequency
News-implied Market Reactions
2.1 Introduction
Trading on financial markets is strongly influenced by public company-specific, macroe- conomic or political information flows. Markets react sensitively to textual information updates – so-called ”news” – which are announced on a regular and irregular basis. How- ever, due to the enormous amount of news continuously released by modern electronic communication media nowadays it becomes increasingly difficult to process all news re- lated to a certain financial asset. Particularly nonscheduled news are noisy and often hard to quantify and to interpret. It is not trivial to separate information from noise and to distinguish between relevant and less relevant news. Consequently, empirical studies typically focus on specific and easily identifiable news events such as scheduled macroeconomic announcements, political interventions or earnings announcements.
This chapter addresses the challenge of linking a virtually continuous and nonsched- uled asset-specific news flow to intraday market activity. The fundamental objective of this study is to analyze to which extent high-frequency movements in returns, volatil- ity and liquidity can be explained by the underlying mostly nonscheduled news arrivals during a day. To overcome the major difficulty of structuring and filtering news we employ the trading signals of an automated news engine. Such engines are technological innovations fueled by the algorithmic trading industry which computerize the interpre- tation of news based on linguistic pattern recognition techniques. The news engines are designed to provide signals on the meaning and the relevance of news items for future price movements as well as for future volatility and liquidity situations.
To our best knowledge, the present study is the first one systematically analyzing data from an automated news engine. We use the Reuters NewsScope Sentiment Engine which classifies firm-specific news according to positive, neutral and negative author sentiments based on linguistic pattern analysis of the respective news story. A further crucial feature of the engine is a numeric indicator classifying the relevance of news as well as a variable indicating the novelty thereof. Exploiting these numeric indicators of news sentiment, relevance and novelty we relate the firm-specific news to high-frequency returns, volatility, trading intensity, trade sizes, trade imbalances, spreads and market depth.
In specific, we aim to answer the following research questions:
(i) Are there significant and theory-consistent market reactions in high-frequency re- turns, volatility and liquidity to the intraday news flow?
(ii) Is trading on news-driven, machine-generated trading signals profitable?
(iii) Is the machine-indicated relevance of news empirically supported by corresponding market reactions?
Question (i) addresses a gap in the empirical finance literature which still lacks evidence on the impact of intra-daily (nonscheduled) news on high-frequency market dynamics.
Therefore, this study sheds some light on the question whether it is possible to em- pirically link linguistically pre-processed and filtered asset-specific news to the intraday trading process. We are particularly interested in the question whether there are market reactions beyond the effects induced by company-specific earnings releases which are well-known to have strong impacts. Hence, we explicitly discard all news on earnings announcement days and focus on effects which are predominantly driven by mostly non- scheduled and inhomogeneous news items. In this context, it is of interest to study not only reactions in returns but also in volatility, bid-ask spreads as well as liquidity demand and supply (represented by trading volume and market depth, respectively). Specifically the high-frequency news-driven effects on bid-ask spreads and market depth are widely unexplored. To our best knowledge, only Fleming and Remolona [1999] and Lee et al.
[1993] report mainly summary statistics as some evidence of news-induced reactions in liquidity.
Research questions (ii) and (iii) are about the usefulness and effectiveness of machine- generated news feeds in intraday trading. While (ii) is addressed by testing for the significance of abnormal returns, question (iii) is investigated based on a classification of news into important and less important news items. The answers to (ii) and (iii) show to which extent linguistic analyses can help news vendors and traders to automatically structure the news flow. Finally, these questions provide also a first piece of evidence whether news engines have the potential to become building blocks in algorithmic trading strategies and thus major driving forces in market activity.
Compared to the vast literature on earnings announcements, only very few studies try to measure the market response to firm-specific intraday news. This is mainly because high-frequency news items are typically considered to be too noisy due to the interfer- ence with other sources of information. The work of Berry and Howe [1994] is an early attempt to link intraday market activity to aggregated measures of news like, e.g., the number of news. A similar approach is taken by Kalev et al. [2004] who document a posi- tive relationship between the number of intraday news and stock market volatility. In an alternative intraday study, Busse and Green [2002] consider the impact of news released via television to test market efficiency. Ranaldo [2008] is the only analysis providing descriptive statistics on the impact of singular firm-specific news items on intraday trad- ing processes. However, all studies show that the impact of news on intraday trading activity is only very weak and not identifiable anymore if earnings announcements are discarded. Moreover, typically news have to be aggregated to reduce the influence of noisy and non-informative news. This is also confirmed by Mitchell and Mulherin [1994]
reporting weak impacts of public news on a daily level. Finally, our study is also related to approaches based on the quantification of news texts. For instance, Tetlock [2007]
and Tetlock et al. [2008] perform linguistic analyses of daily Wall Street Journal stories.
2.2 Data Similarly, Antweiler and Frank [2004] link daily stock market activity to textual infor- mation from internet stock message boards. However, none of these approaches employ machine-processed and filtered textual news items.
Using 20 second aggregates of transaction data from 39 liquid stocks traded at the London Stock Exchange (LSE), we study news’ impacts on abnormal returns, volatility, trading volume, average trade sizes, spreads, trade imbalances and market depth. While most studies analyze news effects based on fixed windows around the event dates, we model the complete underlying trading process. To avoid spurious regression results due to neglected dynamics and cross-dependencies between the variables, we employ a high-frequency Vector Autoregressive (VAR) model which is augmented by news-specific explanatory variables and explicitly accounts also for the naturally high proportion of zero variables arising from non-trading in a 20-second interval.
A major finding of our study is that high-frequency trading activity indeed significantly reacts to intraday company-specific news items which are identified as relevant. The fact that earnings announcements are discarded makes these results quite remarkable.
We show that the observed market reactions well match theoretical predictions. By capturing dynamics and cross-dependencies in the VAR framework we find strongest effects for volatility and cumulative trading volumes. Bid-ask spreads, trade sizes and market depth do not necessarily directly react to news but indirectly through the cross- dependencies to volumes and volatility and corresponding spillover effects. Two findings confirm the usefulness of the linguistic pre-processing of news. First, we find that the indicated sentiments have predictive contents for price movements prior to news arrivals.
However, simultaneously rising spreads during these periods reduce the profitability of potential trading strategies. Second, only little market impact is found for news that are classified as not being relevant, while strong and significant effects are shown for relevant news. This result shows that news engines have the potential to successfully pre-structure news and to filter out noise.
The remainder of the paper is organized as follows. In the next section, we describe the underlying data set and present descriptive statistics. Section 2.3 reports empirical evidence for unconditional effects of published news items without explicitly controlling for time series dynamics and cross-dependencies in the processes. In Section 2.4, the econometric framework and corresponding results based on a high-frequency VAR model are given. Section 2.5 concludes.
2.2 Data
In order to facilitate the processing of new information, several news vendors offer soft- ware environments capturing particular characteristics of news in realtime. These tools electronically analyze available textual information using linguistic pattern recognition algorithms. Words, word patterns, the novelty of a news item, its type and other char- acteristics are translated into indicators of the relevance, novelty as well as of the tone of the item.
We use pre-processed news data from a news-analytics tool of the Reuters company,
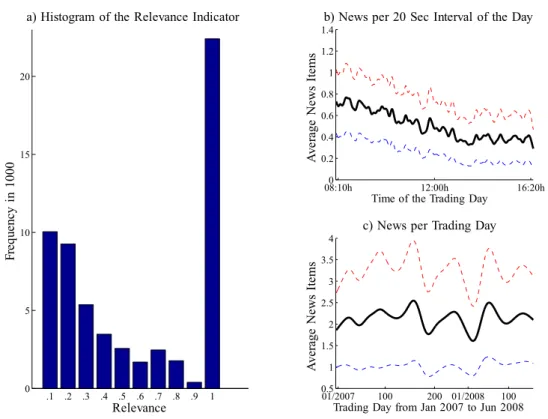
Figure 2.1: a) Distribution of the Relevance Indicator. b) Distribution of news over a day and c) over the time span January 07 to June 08 (averages). Confidence bounds dotted. Smoothed via kernel regression.
the Reuters NewsScope Sentiment Engine. The data contain 29,497 news headlines for the stocks we consider for 01/07 to 06/08 as observed on traders’ screens. News arrival is recorded with GMT time stamps up to a millisecond precision. Each news message provides a sentiment, novelty and relevance indicator. The indicators are produced based on an automated linguistic analysis of news texts. The sentiment tags of the news are coded +1, 0 and -1 for a positive, neutral and negative tone of the underlying story, respectively. Relevance is given by a number in the [0,1] interval. The novelty indicator reflects how many news with similar content have been published prior to a certain news item. It can thus be used to identify initial news topics (novelty= 0) and updates on a topic (novelty>0).
We select 40 stocks traded at the LSE which are most active in terms of the number of published news items. As we require data availability for 355 trading days from 01/03/2007 to 06/01/2008, the sample is ultimately cut down to 39 stocks. The fact that the selected stocks are also very actively traded allows us to study market dynamics based on a high frequency. Covering 70 % of the market capitalization of the FTSE100, our sample can be considered representative of the FTSE100 (see Table 2.1).
2.2 Data
M.Capin%MoneyVal.ReturnSpreadNr.ofNr.ofRelevantRel.Pos.Rel.Neg. RICofFTSE100Traded1/7-6/8TradesNewsNewsNewsNews AAL2.4158.440.372.4185.871266418166148 AV1.3684.21-0.230.68519.2355824210884 AZN2.7254.92-0.191.43175.34861391142170 BATS1.9038.330.311.40232.873121318129 BARC3.08391.72-0.490.52992.962243874390331 BG1.5392.560.820.89507.974471568254 BGY0.0057.630.350.76313.03558304144113 BLT1.43160.191.031.27370.121300279122100 BP7.22499.470.070.534546.402408908308406 BSY0.5959.950.030.66603.273541505366 BT1.61251.73-0.270.302097.745081708551 CBRY0.7479.050.230.70560.583761646868 CNA0.84118.33-0.180.34855.753481346648 DGE1.7664.39-0.020.96530.282821106730 EMG0.6490.510.180.73488.34174854023 FP0.30134.54-0.440.251134.6146922311077 GSK5.00131.54-0.171.13855.071219408127148 HBOS2.75170.43-0.650.81650.7492732099155 HSBA6.96349.53-0.090.561806.281986695293224 III0.3022.21-0.121.26177.50272623314 IMT0.8820.49-01.9897.3639720711860 ITV0.27175.74-0.450.173149.7837819053118 LLOY2.08220.87-0.330.491175.855281817174 LSE0.0010.84-0.222.6799.6470028114473 MKS0.78105.32-0.470.60565.144751524979 NG1.2965.8600.67499.173121245638 NXT0.2622.78-0.361.9097.743231536577 PRU1.10111.43-0.050.68512.254171738840 RBS4.05450.73-0.890.691046.441859560234216 RIO1.8059.421.203.2170.75122336219987 RR0.5281.26-0.060.54502.9939723812539 SAB1.1436.720.101.41254.563681819845
SBRY0.4590.66-0.140.54718.9665230716992 SL0.4043.67-0.160.45454.733211898277 STAN1.3354.130.241.45213.5973532817396 TSCO2.07213.450.020.331034.075061909555 ULVR1.2041.520.171.34299.383301086129 VOD4.821426.320.150.14508.251700559315137 XTA1.5556.230.562.8076.531008326164120 Sum69.16294971103349433891 Table2.1:DescriptivestatisticsoftheFTSEstocks Note:RICdenotestheReutersIdentifierCode.Thesecondcolumnisthe%marketcap.,definedasthesharedpricetimesthenumberordinary sharesinissuefor2007,asfractionofthemarketcapfortheFTSE100.MoneyValue(traded)iscomputedasthetradesizetimestherespective price(tradedturnovertotalin01/2007to06/2008in100000).Returnreferstothe%pricechangefrom01/03/07to06/01/08.SpreadandNr.of trades(in100000)areaveragespertradingday.TheNewscolumnreferstothenumberofnewsitemsperfirmwithoutovernightnewsandduplicate entries.Relevantnewsitemsareclassifiedtobetheoneswitharelevanceindicatorequaltoone.Rel.PositiveandRel.Negativegivethenumbers ofrelevantpositiveandnegativeitems,respectively.
2.2 Data The underlying transaction data is aggregated to 20 second intervals. We consider this aggregation level to be a good compromise between exploiting a maximum of information on the one hand and making the analysis still computationally tractable (given 1.5 years of data). To reduce the impact of market opening and closing effects, we discard the first ten and last ten minutes of a trading day. Intraday returns, volatility and liquidity are captured by the following variables computed over 20 second intervals:
(i) money value traded, defined as trade sizes in the intervals weighted by the corre- sponding mid-quotes,
(ii) average trade size, defined as the cumulated trade size divided by the corresponding number of trades per interval,
(iii) bid-ask spread, evaluated at the endpoint of each interval, (iv) mid-quote returns over each interval,
(v) depth, defined as as the volume pending at the best bid and ask level, evaluated at the endpoint of each interval,
(vi) volatility, defined as the sum of squared mid-quote transaction returns over each interval,
(vii) trade imbalance, defined as the difference of cumulated sizes of buyer and seller- initiated trades (identified by the Lee and Ready [1991] algorithm), normalized by the cumulated trade size,
(viii) absolute trade imbalance.
As shown by Figure 2.13 (see the appendix), all volatility and liquidity variables exhibit pronounced intraday trading patterns. To capture the seasonality, we standardize all processes by the yearly average of the corresponding underlying 20 s interval. We compute standardized variables according to
x∗jd := xjd 1/nPnd=1xjd
,
where j denotes the specific interval of the trading day d and x represents the corre- sponding variable.
We delete all news on days of earnings announcements to minimize the influence of scheduled earnings releases on the results. This allows us to focus on the yet unexplored data of widely unscheduled intraday news driven mostly by random events. In addition, we only consider the news flow within a trading day and do not examine overnight news.
Incorporating the latter would considerably increase the complexity of the study.
After pre-filtering, the number of news range from a minimum of 174 to a maximum of 2408 disclosures per stock for the 01/2007 to 06/2008 period (see Table 2.1). We observe that news tend to cluster in the first half of a day. As shown by Figure 2.1 b),
the news intensity peaks at the beginning of the trading period and decreases during the rest of the day. Figure 2.1 c) reveals that there is no pronounced yearly pattern of news arrival.
In order to identify potentially market-moving news, we distinguish between relevant and less relevant news according to the linguistic pre-analysis. Since we expect the reported relevance tag of news to be a relatively noisy measure, we classify items with an indicator value at (below) the maximum 1 as relevant (irrelevant) news (see Figure 2.1 a)).
2.3 Unconditional Effects of News Items
2.3.1 Impact on Volatility and Liquidity
Quantifying the unconditional impact of news without controlling for market dynamics and cross-dependencies between variables already provides important insights and serves as a basis for the econometric modelling in Section 2.4. We analyze 720 20-second intervals around the arrival of news items capturing 180 intervals before each disclosure and 540 thereafter.
Figure 2.2 illustrates the timing of the intervals. I0 denotes the specific 20-second interval around the news item, whereas T1 and T2 are the numbers of intervals before and after the disclosure, respectively. For each stock, we compute the average market reaction and corresponding standard errors over all event windows. For sake of brevity, we refrain from showing results for individual stocks but report pooled averages over the cross-section of stocks. Correspondingly, by denoting the market reaction of variable X to news item i during interval Ij as XiIj, the pooled average across all news events and all stocks is computed as XIj = 1/nPni=1XiIj, where n is the total number of news for all stocks. Given that the stocks have quite similar empirical characteristics (see Table 2.1), this proceeding allows us to highlight the results common to all stocks.
Assuming (approximative) normality, the 95% confidence intervals ofXIj are computed as two times the standard errors of XIj. Since these standard errors reflect variations across all event windows as well as across the market they capture overall news responses and statistical confidence thereof. Two robustness checks underscore the validity of the inference. First, the confidence intervals closely match those obtained from a parametric bootstrap. Second, to account for the fact that stocks with a high number of news naturally have a stronger weight inXIj, we perform a robustness check using a group- means estimator instead of a pooled average. The corresponding results are qualitatively identical.1
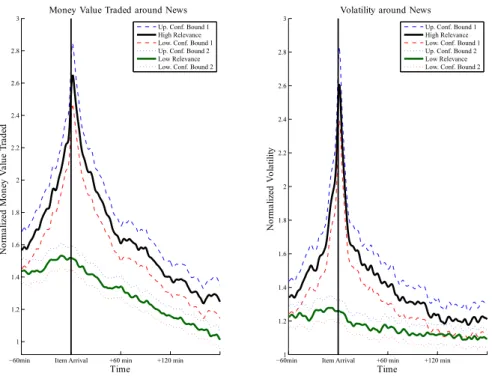
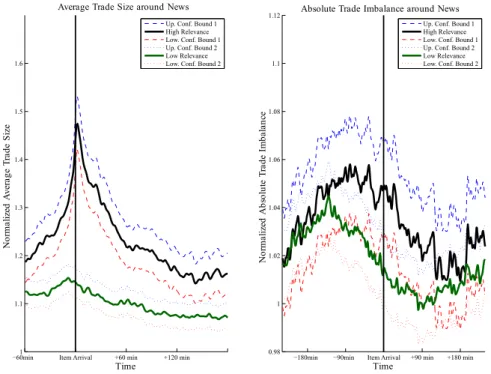
Figures 2.3 to 2.5 show the money value traded, realized volatility, bid-ask spreads, market depth, average trade sizes and absolute trade imbalances around relevant and less relevant news items. Note that by construction of the seasonality adjustment the mean of each series equals one.
1See the Appendix for more details on the computation of standard errors.
2.3 Unconditional Effects of News Items
- Time IT2
....
....
I−T1 I−2 I−1 I0 I1 I2
6 News Interval
Figure 2.2: Intervals around news arrival
The following findings can be summarized: First, we identify significant upward move- ments in money value traded, average trade sizes and volatility around the releases of news items. Hence, volatility and trading activity clearly increase when news are pub- lished. This supports a ’micro-foundation’ of the mixture-of-distribution hypothesis as postulated by Clark [1973] and put forward by Tauchen and Pitts [1983] and Karpoff [1986]. In this framework, price changes are essentially driven by trading on pieces of news, whereas uninformed traders tend to trade when they see large price movements.
In consequence, the theory indeed predicts co-movements of volatility and volume. The observed effects are also well-supported by market microstructure theory providing sev- eral explanations for higher trading activity during news announcements: (i) Larger trade sizes due to execution by better informed market participants according to Easley and O’Hara [1987], (ii) increased trading due to news-induced information asymmetry among market participants as advocated in the models of Kim and Verrecchia [1991]
and Kim and Verrecchia [1994], (iii) trading because of differences in opinion of traders on news’ topics as in Harris and Raviv [1993] as well as Kandel and Pearson [1995], and (iv) trading as a consequence of the attention grabbing behavior of investors as documented by Barber and Odean [2008]. Beyond overall increases in volumes, we also observe slight increases in absolute trade imbalance reflecting that trading activity on the two sides of the market tends to become also more asymmetric in periods of information dissemination.
Second, the release of a news item significantly increases bid-ask spreads but does not necessarily affect market depth. Hence, liquidity suppliers predominantly react to news by revising quotes but not by offered order volumes. This is well supported by asym- metric information based market microstructure theory (see, e.g., Easley and O’Hara [1992]) where specialists try to overcompensate for possible information asymmetries.
Though on an electronic market there are no designated market makers, the underlying mechanism is similar: Liquidity suppliers reduce their order aggressiveness in order to avoid being picked off (i.e., being adversely selected) by traders who are better informed.
For earnings announcements, such effects are also reported by Krinsky and Lee [1996].
Third, the machine-indicated relevance of a news item is clearly supported by corre- sponding market reactions. All variables respond significantly stronger if information is indicated to be of highest relevance. Actually, for less relevant news we cannot identify
Figure 2.3: Money Value and Volatility around news arrivals. Smoothed via kernel regression.
Figure 2.4: Spread and depth around news arrivals. Smoothed via kernel regression.
2.3 Unconditional Effects of News Items
Figure 2.5: Average trade sizes and absolute trade imbalance around news. Smoothed via kernel regression.
Figure 2.6: Money value and spread around initial news and updates. Smoothed via kernel regression.
significant deviations of the analyzed trading variables from their pre-news levels. This finding is economically in line with Blume et al. [1994] who argue that higher volumes reflect a higher quality of news signals. Moreover, it shows that an appropriate filtering and structuring of the news flow (as provided by the news engine) is crucial to identify systematic market responses. In fact, the noisiness of less relevant news items is the ma- jor reason for the yet missing empirical evidence on statistically significant relationships between intraday news flow and high-frequency market activity.
Fourth, for most variables, above-average activities start already more than sixty minutes before the item arrival. This phenomenon is also known in case of periodically scheduled earnings releases. According to the model in Kim and Verrecchia [1994], trad- ing prior to news depends on the degree of information leakages. Our results show that some market participants seem to have additional and partly more timely channels of information. Besides information leakage we attribute the pre-news reaction to a clus- tering of news. The clustering is an effect inherent in the production of news stories:
Beginning with an alert about the news content, subsequent updates ultimately culmi- nate in a full-blown story. Typically, the time between updating steps is small. Indeed, the novelty indicator of the news data allows us to separate between ’news’ (in its true sense) and updates on the topic published later. Figure 2.6 shows money value traded and bid-ask spreads around ’initial’ news and subsequent updates. Most strikingly, we find that trading on updated news is much more pronounced than trading on the initial news which strongly supports the notion of news clustering. Hence, market reactions become stronger if signals on news are repeated, refined and possibly enforced. This confirms the importance of accounting for the full history of news. Given that later published full stories are more precise than initial alerts, the findings support also the theoretical model of Tetlock [2010] who argues that the magnitude of the volatility and volume change at public news disclosures are positively related to the precision of the news.
2.3.2 Trading Profitability
To test for the profitability of trading on news items we employ an event study framework as outlined in Campbell et al. [1997]. As a model for ’normal’ returns we assume the market model
Rit=αi+βiRmt+γiRi,t−1+εit, εit∼(0, σ2i), (2.1) wheretdenotes the underlying (20 second) intervals,Rmtis the market return, computed as the return of the FTSE 100 index, and Rit is the return for stock i. To capture return dynamics on high frequencies we also include lagged returns. Model (2.1) is estimated based on the complete 20-second return time serieswithoutincluding the event windows. Using the resulting parameter estimates, we compute the abnormal returns ARdit := Rit−αbi−βbiRmt−γbiRi,t−1 during the event windows. Let ARdki denote the ((T1+T2+ 1)×1) vector of abnormal returns for eventk of stockicomputed between time pointsI−T1 andIT2 in Figure 2.2. Letγj be a ((T1+T2+ 1)×1) vector consisting of
2.3 Unconditional Effects of News Items
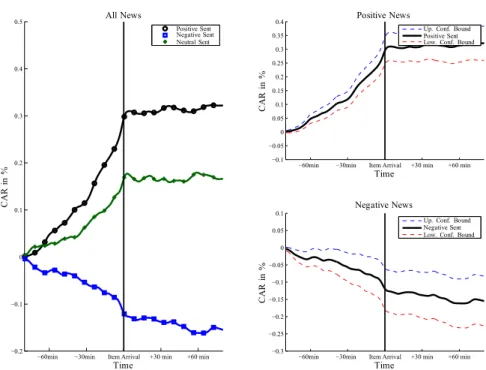
Figure 2.7: Cumulated abnormal returns around relevant positive, negative and neutral news. Smoothed via kernel regression.
ones in the firstj places and zero else. Then, we define the cumulated abnormal return for intervalj after the I−T1 interval as
CAR[kij :=γj0ARdki. (2.2)
AveragingCAR[kij yields
CAR[j = 1 n
X
i
X
k
CAR[kij
!
, (2.3)
where n is the total number of events over all stocks. Assuming (asymptotic) normal- ity, 95% confidence intervals are computed as two times the standard deviation of the estimatesCAR[j.
Figure 2.7 shows the averaged cumulated abnormal returns (ACAR) CAR[ around relevant news. Starting 90 minutes before the disclosure we observe significantly pos- itive (negative) cumulated abnormal returns as reactions to positive (negative) news items. The news engine obviously allows to establish a significant relationship between a stories’ sentiment and the corresponding sign of price trends. However, we observe al- ready significant price movements prior to news releases but only little return reactions thereafter. Though private pre-release information might be present, we conjecture that
Figure 2.8: Cumulated abnormal returns after relevant positive and negative news.
Smoothed via kernel regression.
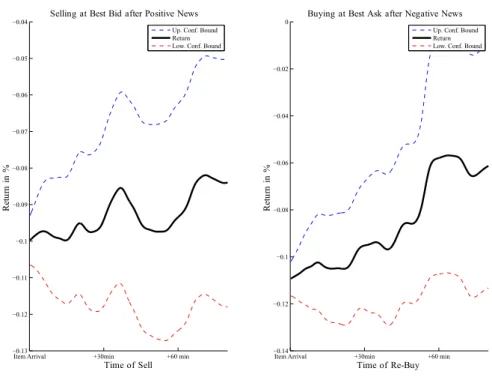
Figure 2.9: Profitability of trading on the sentiments. Smoothed via kernel regression.
2.4 Market Dynamics around News Items the availability of other sources of information and an induced clustering of news items is mainly responsible for pre-announcement effects. Figure 2.8 depicts the ACARs ex- plicitly starting at news disclosure. We observe that sentiment indicators of news items have some predictability for future price movements. Nevertheless, we find the abnormal returns to be mostly insignificant.
In order to provide more specific evidence on trading profitability, we test a stylized trading strategy based on the sentiment information. Following a positive news item returns are computed by buying at the best ask at the item arrival and selling later at the bid. Conversely, after negative news, the asset is sold at the best bid and re-bought later at the ask. As shown by Figure 2.9, we observe that the corresponding returns increase with the underlying horizon but are generally negative. This result shows that the abnormal returns of maximally 3.5 basis points in case of negative news (cf. Figure 2.8) are too low to overcompensate increased bid-ask spreads around news and to provide economic gains of the underlying trading strategies. Still, the fact that return trends are positive (though never crossing the zero line), might be exploited via trading strategies.
2.4 Market Dynamics around News Items
2.4.1 Econometric Methodology
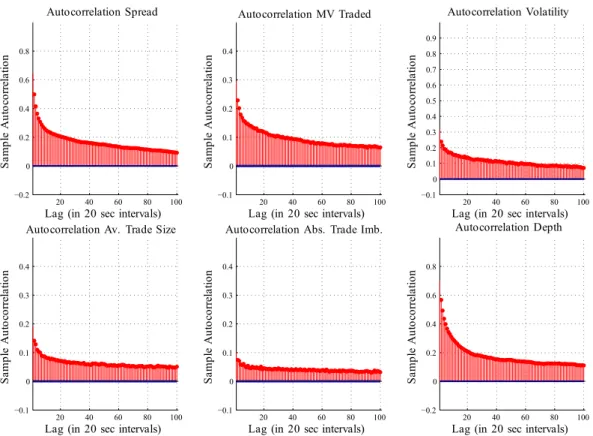
The unconditional analysis of the previous section provides strong indications for -driven market reactions to news disclosures. However, we observe significant autocorrelations as well as cross-correlations between the variables. Figure 2.10 shows corresponding autocorrelation functions.2 The autocorrelation functions reveal a high persistence of the individual processes. Geweke and Porter-Hudak [1983] estimates of the fractional integration parameter (not shown in the paper) indicate that some series exhibit long range dependence and are overall covariance stationary. In order to avoid spurious results, the dependencies and interdependencies have to be explicitly taken into account.
We suggest a six-dimensional model for the realized variance, the money value traded, the bid – ask spread, market depth, average trade size and absolute trade imbalance.
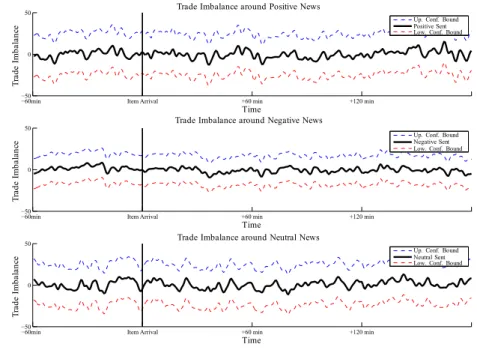
As high-frequency volatility and liquidity variables are only weakly related to (signed) returns we refrain from including the latter in the model. Furthermore, in a seperate analysis we find that the signed trade imbalances do not react to signed news (results given in the appendix). Nevertheless, to capture the order flow we consider the absolute trade imbalance instead. Accordingly, the vector of endogenous variables consists of the money value traded, the volatility, the absolute trade imbalance, the bid-ask spread, the market depth and the average trade size.
Since even for liquid stocks there is not necessarily a transaction in every 20 second interval we observe a non-trivial fraction of zero observations for money value traded and realized volatility. In particular, there are no trades in 46% of all 20 second intervals on average. To capture this finding, we suggest explicitly differentiating between the cases of trading,y1t>0, and no trading,y1t= 0, in intervalt. Correspondingly, the log
2Sample cross-correlations are given in the appendix.
Figure 2.10: Typical sample autocorrelations for the variables of interest (case: AV.L)
likelihood function is given by lnL(y;θ1,θ2,θ3) =
T
X
t=1
{lnf(yt|y1t>0;θ1) + ln P(y1t>0;θ2)} ·1l (y1t>0) +
T
X
t=1
{ln P(y1t= 0;θ2) + lnf(yt|y1t= 0;θ3)} ·1l (y1t= 0), whereθ1,θ2 and θ3 denote corresponding parameter sets.
As long as the parameter setsθ1,θ2 andθ3are disjoint, the likelihood components can be maximized separately. Since the case of no trading,f(yt|y1t= 0;θ3), is not in the core of our interest, we leave it unspecified. In addition, we refrain from explicitly modeling the long range dependence in some individual time series since this is infeasible in our case of 530000 observations per variable and stock. To parameterize f(yt|y1t > 0;θ1), we suggest a VAR specification given by
yt|y1t>0 =c+
p
X
i=1
(Γiyt−i+ΨiZt−i) +Ξ·Dt+εt, εt∼N(0,Ω), (2.4)
2.4 Market Dynamics around News Items whereΓi andΞdenote (6×6) and (6×(p1+p2+ 1)) coefficient matrices, wherep1>0 and p2 > 0 are integers. Lags of the dummy Zt := 1l(y1t=0) capture previous periods of nontrading with corresponding (6×1) coefficient vectors Ψi. To capture the impact of news we define the dummy variable dt with value one in case of relevant news in t and zero otherwise. Then,Dt:= (dt+p1....dt−p2)0 is a vector of time dummies indicating the arrival ofrelevant news and coveringp1 intervals before and p2 intervals after news disclosures. Model (2.4) can be consistently (though not necessarily efficiently) estimated equation by equation using ordinary least squares.
For the money value equation, the conditional probabilities for the occurrence of zero observations (i.e., no trading) in periodt, P(y1t= 0;θ2), are parameterized in terms of a probit specification. Letxt contain all right-hand side variables of equation (2.4), i.e., x0t := [1 y0t−1...y0t−p Zt−10 ...Zt−p0 Dt]. Assuming a normally distributed latent process y∗1t∼N(x0tθ2,1) underlying the trading "decision", we have
P(y1t∗ >0) = Φ(x0tθ2), ify1t∗ >0 ⇔ y1t>0, (2.5) P(y1t∗ ≤0) = 1−Φ(x0tθ2), ify1t∗ ≤0 ⇔ y1t= 0, (2.6) for the binary decision y1t > 0 vs. y1t = 0. The probit model is straightforwardly estimated by maximum likelihood.
The model is applied to each stock in our sample. Depending on the number of un- derlying trading days, the individual time series for the 39 stocks contain up to 533,000 observations. In order to obtain equal lag structures in all equations which eases cross- sectional comparisons and the computation of cross-sectional averages, we choose a uni- versal lag length of 10 for all stocks. This lag length is sufficiently close to the individually optimal lag length according to the Bayes Information Criterion and does not restrict the validity of the results discussed below. In the following we show the cross-sectional averages of point estimates and corresponding standard errors.
2.4.2 Estimation Results
Table 2.2 reports averaged estimates of the VAR model which is augmented by dummies indicating relevant news. For sake of brevity, we do not show coefficients for lags of the dependent variables greater than two. Likewise, coefficient estimates for the dummies Zt are not reported.3 News dummies cover 40 seconds before the disclosure and 100 seconds thereafter.
Analyzing the dynamics of volatility and liquidity, we can summarize the following main results: First, all variables reveal significantly positive own dynamics. This is strongly expected given the underlying autocorrelations reported above. Second, we observe a significantly positive relationship between money value traded and volatility.
Hence, volatility and trading activity are closely dependent not only on a daily level as, e.g., shown by Clark [1973] and Tauchen and Pitts [1983], but obviously also on a high-frequency level, confirming, e.g., Hautsch [2008]. Third, bid-ask spreads increase if past trading periods reflect rising liquidity demand and volatility. This causality is well
3These results are available upon request from the authors.
VAR(I)MoneyVolatilityAbs.DepthSpreadAv.Probit(I) ValueTradeImb.TradeSz.1l(y1t>0) c-0.666∗∗∗ -0.120∗∗∗ 0.522∗∗∗ 0.239∗∗∗ 0.342∗∗∗ 0.159∗∗∗ 1.847∗∗∗ (0.115)(0.076)(0.010)(0.017)(0.022)(0.038)(0.048) Money Value
mvt−10.224∗∗∗ 0.046∗∗∗ -0.003∗∗∗ -0.001∗ 0.001∗∗∗ 0.020∗∗∗ 0.018∗∗∗ (0.003)(0.005)(0.000)(0.000)(0.000)(0.002)(0.003) mvt−20.130∗∗∗ 0.011∗∗∗ -0.001∗∗∗ 0.001∗ -0.0000.008∗∗∗ 0.004∗∗∗ (0.002)(0.002)(0.000)(0.000)(0.000)(0.001)(0.001) Volatilityvolat−10.0000.203∗∗∗ -0.002∗∗∗ 0.0000.004∗∗∗ 0.008∗∗∗ 0.011∗ (0.001)(0.004)(0.000)(0.000)(0.000)(0.001)(0.001) volat−2-0.0000.095∗∗∗ -0.001∗∗∗ 0.0000.002∗∗∗ 0.004∗∗∗ 0.003 (0.001)(0.002)(0.000)(0.000)(0.000)(0.000)(0.000) Abs. TradeImb.
atit−10.140∗∗∗ 0.118∗∗∗ 0.060∗∗∗ 0.002∗ -0.008∗∗∗ -0.053∗∗∗ 0.222∗∗ (0.017)(0.016)(0.001)(0.002)(0.002)(0.007)(0.005) atit−20.079∗∗ 0.0120.043∗∗∗ -0.007-0.003-0.0240.147∗∗∗ (0.010)(0.015)(0.001)(0.001)(0.002)(0.005)(0.004) Depthdpt−10.594∗∗∗ -0.302∗∗∗ 0.008∗∗∗ 0.445∗∗∗ -0.025∗∗∗ 0.398∗∗∗ 0.008∗∗∗ (0.025)(0.024)(0.001)(0.010)(0.001)(0.017(0.002) dpt−2-0.0280.008-0.0010.091∗∗∗ -0.001-0.0020.008∗∗∗ (0.007)(0.008)(0.000)(0.002)(0.001)(0.006)(0.001) Spreadsprt−1-0.359∗∗∗ 0.647∗∗∗ 0.006∗∗∗ -0.097∗∗∗ 0.297∗∗∗ -0.105∗∗∗ -0.160∗∗∗ (0.016)(0.071)(0.001)(0.006)(0.009)(0.007)(0.005) sprt−20.053∗∗ 0.044∗ -0.004∗∗∗ -0.012∗∗∗ 0.070∗∗∗ 0.0020.028∗∗∗ (0.006)(0.019)(0.001)(0.001)(0.004)(0.003)(0.002) Av. TradeSz.
atst−1-0.030∗∗∗ 0.034∗∗∗ -0.000-0.007∗∗∗ 0.0010.130∗∗∗ 0.005∗∗∗ (0.003(0.004)(0.000)(0.001)(0.000)(0.003)(0.002) atst−2-0.018∗∗ 0.017∗∗∗ 0.001-0.0000.0000.094∗∗∗ 0.005∗∗∗ (0.003)(0.002)(0.000)(0.001)(0.000)(0.003)(0.001)
2.4 Market Dynamics around News Items
VAR(II)MoneyVolatilityAbs.DepthSpreadAv.Probit(II) ValueTradeImb.TradeSz.1l(y1t>0) Dummy Leads
dt+20.8941.023-0.0130.0180.0040.2110.030 (0.329)(0.354)(0.005)(0.012)(0.013)(0.079)(0.015) dt+10.485∗ 0.484∗ -0.0090.002-0.0240.1010.065 (0.145)(0.182)(0.005)(0.007)(0.011)(0.055)(0.018) Item Dummydt1.036∗∗∗ 1.332∗∗∗ -0.0150.0220.0430.1630.110 (0.224)(0.308)(0.004)(0.012)(0.014)(0.042)(0.019) Dummy Lags
dt−11.244∗∗∗ 1.470∗∗∗ -0.022-0.0110.0350.201-0.081 (0.236)(0.482)(0.004)(0.014)(0.010)(0.081)(0.016) dt−20.891∗∗∗ 0.925∗∗∗ -0.009-0.0030.0200.1370.048 (0.178)(0.330)(0.006)(0.012)(0.010)(0.048)(0.015) dt−30.5880.909-0.009-0.015-0.0040.1660.031 (0.187)(0.244)(0.005)(0.013)(0.010)(0.042)(0.018) dt−40.4340.413-0.0130.0200.0050.1070.057 (0.145)(0.145)(0.005)(0.013)(0.010)(0.057)(0.019) dt−50.3070.549-0.0130.022-0.0000.0760.024 (0.179)(0.189)(0.004)(0.013)(0.011)(0.040)(0.018) Table2.2:AverageVARResults:Dynamics(y|y1t>0)andDummies.Note:ThefirstsixcolumnsshowOLSestimation resultsofsystem(2.4).ThelastcolumnshowstheMLestimationresultsofthecorrespondingprobitmodel(2.5). VAR(I)(Probit(I))givesthedynamicsandVAR(II)(Probit(II))givestheestimatesforthenewsdummies. Reportedcoefficientsareaveragesoftheestimatesforeachindividualstock.Significanceisreportedbasedon averaget-statistics.(Cross-sectional)standarderrorsoftheaveragedcoefficientsaregiveninparenthesesbelow. (∗∗∗)denotessignificanceoftheaveragecoefficientestimatesatthe1%level,(∗∗)atthe5%level,and(∗)at the10%level.
confirmed by asymmetric information based market microstructure theory (e.g., Easley and O’Hara [1992]) where increased trading activity is an indicator for the existence of information and thus increased risks due to adverse selection. Our findings show that such situations are typically also characterized by increased trade sizes. Conversely, liquidity demand is reduced as a response to increased trading costs as induced by higher bid-ask spreads and reduced market depth.
Fourth, in contrast to the unconditional analysis in Section 2.3, significant effects induced by news items are only identifiable for volatility and cumulated trading vol- umes but not for spreads, absolute trade imbalances, average trade sizes and market depths. In particular, the insignificant spread dummies contradict corresponding results for earnings announcements. These results suggest that the (unconditional) reactions of these variables during news arrival periods as reported in Section 2.3 are mainly due to spillover effects arising from increased volatility and cumulated volumes but do not nec- essarily arise from news alone. Moreover, due to the persistence in the market dynamics, news-induced effects and pre-release trading activity are carried over to subsequent pe- riods. It is therefore not surprising that the direct impact of news as captured by the dummy variables dies out relatively quickly. These findings show that ignoring dynamics and interdependencies can cause spurious results.
Fifth, confirming the results of section 2.3 we find significant effects only for relevant news. Indeed, filtering out noise and structuring news according to their relevance is even more important in a dynamic setting than in an unconditional framework.
The estimation results for the probit model widely confirm those for the VAR specifi- cation. However, the fact that all news dummy variables are insignificant indicates that the occurrence of a trade in a 20-sec interval is not significantly driven by news arrivals.
The averaged estimates capture the major features common to all assets, but most stocks still reveal idiosyncratic responses to news. Even though, for instance, theaverage spread reaction is insignificant, we still observe significant individual spread responses for 19 out of 39 stocks in the sample. Figure 2.11 shows that the significant (positive) dummies for most stocks center around the item arrival interval. Accordingly, there is evidence for news-implied reactions in spreads, depth and average trade sizes which are, however, diffuse across the stock universe. Stock-specific effects for the money value and volatility are much more in line with the average results as we detect significant reactions after news arrivals for all but three stocks.
2.4.3 Impulse Response Analysis
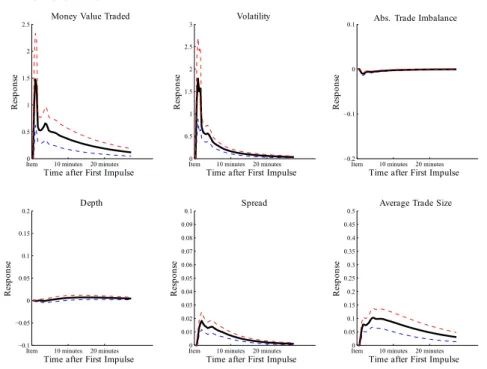
To provide more insights into news-implied market responses in a dynamic system, we perform an impulse response analysis. Here, a ’news shock’ is defined as a change in the corresponding news dummies. As the arrival of news generally stimulates trading activity, it is sufficient to conduct the analysis under the assumption that there is trading activity throughout post-release periods. In the following we thus use the conditional mean specification (2.4) for the periodst, .., t+s, wheretdenotes the news item arrival time.
2.4 Market Dynamics around News Items
Figure 2.11: Numbers of significant dummy variables in the intervals around the news disclosure. Dummies cover 7 20-second intervals before and 13 after the news arrival.
Figure 2.12: Response analysis of a change in the news dummies for highly relevant news (95% confidence intervals as dotted lines)