www.nat-hazards-earth-syst-sci.net/16/2683/2016/
doi:10.5194/nhess-16-2683-2016
© Author(s) 2016. CC Attribution 3.0 License.
The December 2012 Mayo River debris flow triggered by Super Typhoon Bopha in Mindanao, Philippines:
lessons learned and questions raised
Kelvin S. Rodolfo1,2, A. Mahar F. Lagmay3,4, Rodrigo C. Eco4, Tatum Miko L. Herrero4,a, Jerico E. Mendoza3, Likha G. Minimo4, and Joy T. Santiago3
1Professor Emeritus, Department of Earth and Environmental Sciences, University of Illinois at Chicago, Chicago, USA
2Project NOAH consultant in 2013
3Nationwide Operational Assessment of Hazards, Department of Science and Technology, Diliman, Quezon City, Philippines
4Volcano-Tectonics Laboratory, National Institute of Geological Sciences, University of the Philippines, Diliman, Philippines
anow at: Magmatic and Hydrothermal Systems, GEOMAR – Helmholtz Centre for Ocean Research, Kiel, Germany Correspondence to:Kelvin S. Rodolfo (krodolfo@uic.edu)
Received: 28 March 2016 – Published in Nat. Hazards Earth Syst. Sci. Discuss.: 11 April 2016 Revised: 19 October 2016 – Accepted: 6 November 2016 – Published: 15 December 2016
Abstract. Category 5 Super Typhoon Bopha, the world’s worst storm of 2012, formed abnormally close to the Equator, and its landfall on Mindanao set the record proximity to the Equator for its category. Its torrential rains generated an enor- mous debris flow in the Mayo River watershed that swept away much of the village Andap in the New Bataan munici- pality, burying areas under rubble as thick as 9 m and killing 566 people. Established in 1968, New Bataan had never ex- perienced super typhoons and debris flows. This unfamiliar- ity compounded the death and damage. We describe Bopha’s history, debris flows and the Mayo River disaster, and then we discuss how population growth contributed to the catas- trophe, as well as the possibility that climate change may ren- der other near-Equatorial areas vulnerable to hazards brought on by similar typhoons. Finally, we recommend measures to minimize the loss of life and damage to property from similar future events.
1 Introduction
Super Typhoon Bopha was the world’s worst storm in 2012.
In December of that year, its torrential rains on the southern Philippine island of Mindanao triggered an enormous debris flow in the Mayo River watershed that devastated Barangay (village) Andap in New Bataan, a municipality of Com-
postela Valley province. Debris flows, although among the world’s most destructive natural phenomena, are remarkably misunderstood. Technically, debris flows are a type of land- slide (Pierson and Costa, 1987; Cruden and Varnes, 1996;
Hungr et al., 2001), but using the generic term “landslide” as a synonym for “debris flow” makes most people mistakenly think of rock masses detaching from a cliff and accumulating near its base.
Debris flows are also often mistakenly called floods, mud- slides or mudflows, not only by the media, but by decision makers as well. In fact, the official descriptions of the dis- aster incorrectly termed and treated it as a “flash flood”, and relocation sites were initially evaluated in that context (MGB, 2012). In 2012 it was still not widely recognized that the conic-shaped alluvial fans with apices at the mouths of mountain gorges are built over long periods by rarely occur- ring debris flows, and are thus unsafe sites to occupy. Such a lack of understanding may have tragic consequences for communities like Andap in mountainous terrain. To address this deficiency, we review debris flows and their deposits in general, and exemplify them with a detailed description of the Mayo River event.
Beyond the huge volume and rapidity of the flow itself, human factors contributed to this catastrophe. Such events are rare in Mindanao, and New Bataan was settled much too recently for its founders and inhabitants to be familiar
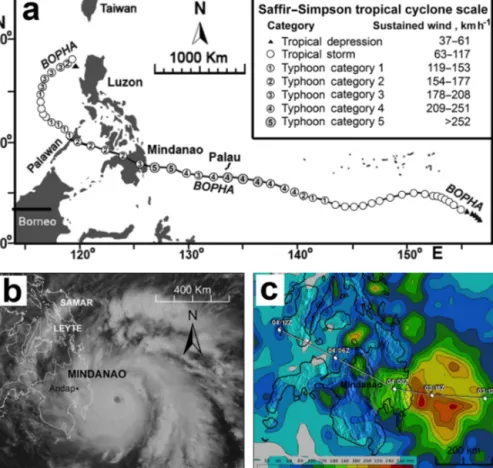
Figure 1.Typhoon Bopha (Pablo).(a)Track and development of the super typhoon. New Bataan, Andap and Maragusan rain gauges lie beneath the Category 3 icon following Mindanao landfall.(b)Bopha at landfall (modified from NASA Earth Observatory, 2012).(c)Tropical Rainfall Measurement Mission (TRMM) image from which NASA (2012) estimated that Bopha delivered over 240 mm of rainfall near the coast.
with super typhoons and debris flows. It is worrisome that the rapidly growing Philippine population continues to ex- pand into increasingly disaster-prone areas, and it does so with insufficient hazard evaluation. Unregulated logging de- forested the steep slopes, facilitating runoff, erosion and the landslides that fed the debris flow.
As part of Project NOAH (Nationwide Operational As- sessment of Hazards), the Philippine government’s disaster assessment program, we studied the Mayo River debris flow until most of our resources and attention were urgently di- verted to a new major Philippine disaster event. That was the world’s worst storm of 2013, Super Typhoon Haiyan in De- cember, which generated the catastrophic storm surge that destroyed Tacloban and damaged many other municipalities on the Visayan Islands, killing thousands of people.
Many questions about the Andap disaster still await our attention; in the interim this report describes for the larger community of disaster-mitigation specialists Super Typhoon Bopha, the Andap catastrophe and its detailed geologic bases. We review the historical role that population growth
and insufficiently guided settlement continue to play in gen- erating “natural” disasters in the Philippines.
We then address the possibility that climate change will bring similar large storms and debris flows more frequently to Mindanao and to other subequatorial areas that are simi- larly unused to them. We present the sparse record of tropical cyclones that made landfall on Mindanao since 1945 and as- sociated records of the Pacific El Niño–Southern Oscillation (ENSO). Our review of the literature pertinent to the question is an invitation for commentary and advice from climatolo- gists and meteorologists to guide our thinking as we proceed.
We describe our new program, an outgrowth of the Andap disaster, that has identified over 1200 alluvial fan areas in the Philippines that are susceptible to debris flows, together with communities at risk from them. The program has already had significant success. Finally, we discuss what else might be done to protect Mindanao and other vulnerable subequatorial populations from climate-related hazards.
2 Super Typhoon Bopha
On 23 November 2012, a large area of convection began forming at 0.6◦N latitude, 158◦E longitude (NASA, 2012).
While still unusually close to the Equator at 03.6◦N, 157◦E, 2 days later it was categorized as a tropical depression (Fig. 1a). On 26 November, while at 04.4◦N, 155.8◦E, it was upgraded to Tropical Storm Bopha. It was too close to the Equator for the weak Coriolis effect there to develop its rotation quickly, but on 30 November, while still at 3.8◦N, 145.2◦E, it was upgraded to a typhoon. Bopha intensified into a Category 4 Super Typhoon on 1 December while at 5.8◦N, 138.8◦E. On 2 December, it attained Category 5 wind speeds of 259 km h−1 while at 7.4◦N, 128.9◦E, the record proximity to the Equator for that category. As it passed south of Palau Island on 3 December, Bopha weakened into a Cat- egory 3 typhoon, and then re-intensified to Category 5. It en- tered the Philippine area of responsibility at 08:00 local time (LT) on 2 December and was given the local name of Pablo.
On 4 December at 04:45 LT, Bopha arrived at the eastern Mindanao coast at about 7.7◦N (Fig. 1b), the landfall closest to the Equator for all Category 5 tropical cyclones of record.
Its average wind speed and gust wind speed were 185 and 210 km h−1, respectively. Once onshore, Bopha weakened rapidly as it expended much of its energy generating great havoc. Many fisherfolk were lost at sea and many coastal dwellers were drowned. The National Disaster Risk Reduc- tion and Management Council of the Philippine government (NDRRMC, 2012) also attributed numerous deaths and se- vere injuries to flying trees and debris, but by far the great- est cause of death and destruction was wreaked by the de- bris flow that Bopha’s intense rains generated, which is de- scribed in this report (Fig. 1c). After passing through Min- danao, Bopha crossed the Sulu Sea and Palawan Island, en- tered the West Philippine Sea (South China Sea), and then reversed course towards northern Luzon, but dissipated be- fore making landfall there.
On 12 February 2013, the United Nations Office for the Coordination of Humanitarian Affairs reported that while in the Philippines, Bopha killed 1146 people with 834 missing, and displaced 925 412 others. It totally or partially damaged 233 163 houses and caused USD 1.04 billion of damage; the most costly typhoon in the nation’s history up to that time, only to be superseded by Super Typhoon Haiyan the follow- ing year.
3 Debris flows
Among the world’s most destructive natural phenomena, de- bris flows are fast-moving slurries of water, rock fragments, soil and mud (Takahashi, 1981; Hutter et al., 1994; Iverson, 1997; Iverson et al., 1997). They can be triggered by sud- den downpours such as those commonly delivered by trop- ical cyclones, reservoir collapses (Lagmay et al., 2007) or
landslides dislodged by earthquakes into streams. Many de- bris flows (Table 1) are associated with volcanoes (Vallance, 2000; Rodolfo, 2000; Lagmay et al., 2007). Casualties can be light or even non-existent in a poorly populated area, such as Mount St. Helens, or where people are familiar with the hazard, such as with lahars at Mount Pinatubo.
When rainfall on slopes exceeds critical thresholds of in- tensity, duration and accumulation it dislodges soil, sediment and rock masses into landslides that may coalesce to form de- bris flows, which are slurries of sediment and water with the consistency of freshly mixed concrete. Water content rarely exceeds 25 % by weight and may be only 10 %, which is just enough to provide mobility. Gravel and boulders constitute more than half of the solids, and sand typically makes up about 40 %. Silt and clay normally constitute less than 10 % and remain suspended in the water (Pierson and Scott, 1985;
Smith and Lowe, 1991).
While flowing in a channel, a striking debris-flow char- acteristic is how easily it transports large boulders, owing only in part to the buoyancy provided by the density of the slurry. Boulders repeatedly bounce up from the channel floor or away from its sides into the central near-surface “plug”
of the flow where friction with the channel is minimal and flow velocity is greatest. Thus, in a mountain gorge they tend to migrate to the front of the flow, where they create a high, moving dam consisting largely of boulders, logs and tree de- bris.
Behind it, the moving frontal dam ponds the main flow body, which is richer in sand, silt and clay, and progressively becomes more dilute toward the rear, undergoing transitions into hyperconcentrated flows, so called because they carry much more sediment than normal streams do. Sand, silt and clay commonly comprise up to 75 % by weight of hypercon- centrated flows, which look similar to normal, turbid flood waters, but flow twice as fast or more, typically 2 to 3 m s−1 (Pierson and Scott, 1985). Having no strength, they can trans- port gravel only as bed load. Hyperconcentrated flows in turn are succeeded by normal, turbid stream flow. Confusingly,
“debris flow” sometimes refers to only a true debris-flow phase and sometimes to an entire hydrologic event including its hyperconcentrated and normal stream-flow phases, which we do here in reference to the Mayo River debris flow.
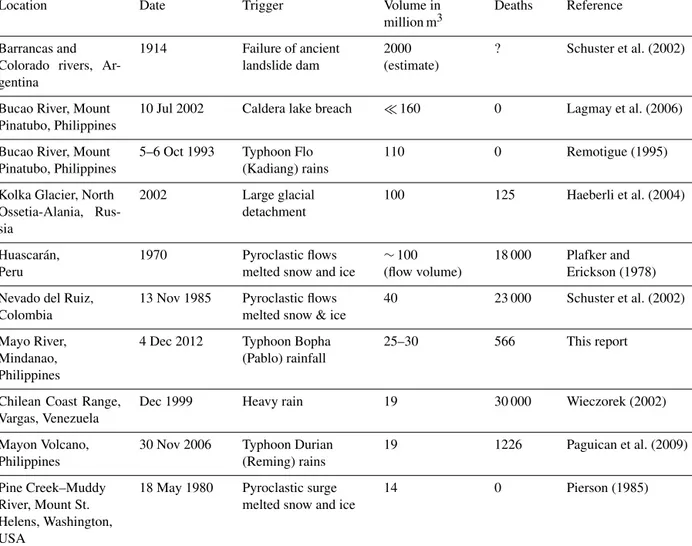
Emerging from a mountain gorge, a debris flow spreads out, and increased basal friction slows it down. It drops some of its sediment load, adding to a conical alluvial fan, ex- pressed on topographic maps by contour lines that are con- vex toward the downstream direction (Fig. 2). Even after it spreads out, it continues to transport large boulders by com- bined flotation, pushing, dragging and rolling. The flow may extend beyond the fan for many kilometers, especially its hy- perconcentrated and normal-flood phases. Debris flows vary in volume by many orders of magnitude, from 1000 to 100 thousand m3 for the most frequent ones to more than 100 million m3(Table 1; Jakob, 2005). Importantly, debris-flow
Table 1.The world’s 10 largest debris flows on record ranked by volume.
Location Date Trigger Volume in
million m3
Deaths Reference Barrancas and
Colorado rivers, Ar- gentina
1914 Failure of ancient landslide dam
2000 (estimate)
? Schuster et al. (2002)
Bucao River, Mount Pinatubo, Philippines
10 Jul 2002 Caldera lake breach 160 0 Lagmay et al. (2006)
Bucao River, Mount Pinatubo, Philippines
5–6 Oct 1993 Typhoon Flo (Kadiang) rains
110 0 Remotigue (1995)
Kolka Glacier, North Ossetia-Alania, Rus- sia
2002 Large glacial
detachment
100 125 Haeberli et al. (2004)
Huascarán, Peru
1970 Pyroclastic flows melted snow and ice
∼100 (flow volume)
18 000 Plafker and Erickson (1978) Nevado del Ruiz,
Colombia
13 Nov 1985 Pyroclastic flows melted snow & ice
40 23 000 Schuster et al. (2002)
Mayo River, Mindanao, Philippines
4 Dec 2012 Typhoon Bopha (Pablo) rainfall
25–30 566 This report
Chilean Coast Range, Vargas, Venezuela
Dec 1999 Heavy rain 19 30 000 Wieczorek (2002)
Mayon Volcano, Philippines
30 Nov 2006 Typhoon Durian (Reming) rains
19 1226 Paguican et al. (2009)
Pine Creek–Muddy River, Mount St.
Helens, Washington, USA
18 May 1980 Pyroclastic surge melted snow and ice
14 0 Pierson (1985)
sizes correlate positively with velocities, which range from 2 to 100 km h−1(Pierson, 1998; Rickenmann, 1999).
An important distinguishing characteristic of debris-flow deposits is “reverse grading”: boulders tend to be smaller at the base and increase in size upwards. Large boulders com- monly jut out at the top of a deposit (Fig. 3a). In addition to the buoyancy they experience from the dense slurry, the best mechanism advanced to explain reverse grading is kinetic sieving (Gallino and Pierson, 1985; Savage and Lun, 1988;
Hutter et al., 1994; Vallance, 2000). While the flowing slurry is undergoing shear at its base, void spaces of different sizes continuously open and close, and particles of equivalent sizes migrate into them while they last. Smaller voids form more frequently and are filled by smaller solid particles, so larger boulders migrate up to the flow surface. Debris-flow deposits are also characteristically “matrix-supported” (Fig. 3b); the larger rock fragments are separated by a mixture of the finer sediment that constituted the bulk of the flowing slurry that carried them. Pierson (2005) has published a useful guide
for distinguishing the effects of debris flows from those of floods.
4 Methods
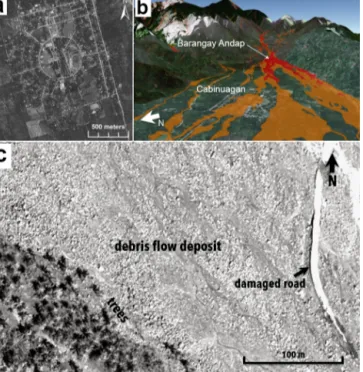
Prior to our field work, we mapped out the extent of the debris flow deposits using high-resolution optical satellite imagery acquired through Sentinel Asia, the collaborative initiative between space agencies and disaster management agencies, that applies remote sensing and Web-GIS technolo- gies to support Asian Pacific disaster management. In the images, large boulders and other coarse debris easily dis- cerned in the main debris flow body facilitated its delineation from the hyperconcentrated-flow deposits (Fig. 4c). The only available maps were 1 : 50 000 scale maps dating from the 1950s. Therefore, we commissioned a lidar survey to gener- ate detailed topographic maps of the affected areas for our fieldwork.
In the field, we analyzed the new deposits, ascertained that they were indeed left by a debris flow and found evidence
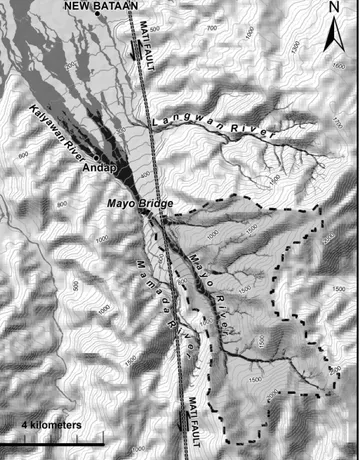
Figure 2.Physical setting of the Andap disaster. Grey area enclosed by dashes is the Mayo watershed. All steep slopes are contoured at 50 m intervals. Below 700 m elevations the contour interval is 20 m to better define the gentler valley surfaces. New deposits of true debris flows south of the Mayo bridge are shown in solid black;
associated hyperconcentrated-flow deposits are shaded in grey. Note that the topographic contour lines from the Mayo bridge to New Bataan are convex northward, defining the surface of an alluvial fan. The trace of the Mati Fault is only generalized; it has numerous associated fractures in a broad zone along its length.
that enabled us to determine its velocity when it hit Andap.
We also found and described old deposits that confirm that debris flows had happened long before New Bataan was es- tablished. The Bopha event was described for us in detail by residents and eyewitnesses we interviewed. We asked those who have lived in New Bataan since the 1960s whether sim- ilar events had happened before; they had not. Data gathered from these surveys and interviews were used to analyze and reconstruct the event.
5 Geomorphologic setting and history of New Bataan and the Mayo debris flow
Upstream of New Bataan and Andap, the Mayo River drains a mountainous watershed of 36.5 km2with a total relief of about 2320 m and with slopes commonly steeper than 35◦ (Fig. 2). The Mayo River passes northward through a narrow
Figure 3.Debris-flow deposits in the New Bataan area.(a)Boul- der in ancient reverse-graded debris-flow deposit. Well-established trees indicate an age of some decades prior to the settlement of the town.(b)Old debris-flow deposits underlying New Bataan – An- dap highway. Boulders are separated from each other by a matrix of finer-grained sediment. For scale, the concrete is 15 cm thick.
The coarse sediment atop the highway are new debris-flow deposits.
(c)Boulder-rich deposits of debris flows that destroyed much of the barangay.(d)Tangle of fallen trees and branches left with numerous cadavers by hyperconcentrated flows in central New Bataan.
gorge to join the Kalyawan River, which flows in the Com- postela Valley that it shares with several other tributaries of the Agusan River.
A site 8 km downstream of the Mayo junction, near the eastern edge of the Compostela Valley, was informally known as Cabinuangan after its many enormous, valuable Binuang (Octomeles sumatrana) trees. This old-growth for- est drew the attention of the logging industry in the early 1950s (Ea et al., 2013). As the loggers rapidly expanded their road networks, immigrant farmers from Luzon and the Visayan Islands followed closely behind, planting the cleared land mainly with coconuts, rice, corn, bananas, coffee, cacao, abaca and bamboo.
Figure 4.New Bataan.(a)Google image of Cabinuangan (the cen- tral district of New Bataan) before the debris flow.(b)Southward facing three-dimensional terrain diagram of New Bataan, show- ing Cabinuangan and the site of outlying Barangay Andap. (c)A 1 m pixel resolution panchromatic Pleiades satellite image of the boulder-rich debris flow deposit in Barangay Andap.
In 1966 the government subdivided the public lands of Compostela Valley into municipal areas, including one of 55 315 ha that was further subdivided into farm lots and a 154 ha central town site in Cabinuangan. When this new mu- nicipality comprising 16 barangays was formally established by an act of Congress on 18 June 1968, it was named New Bataan in honor of Luz Banzon-Magsaysay, the widow of President Magsaysay and a native of the Luzon province of Bataan, who had lent her influence to proponents of the town.
The central town retained “Cabinuangan” for its barangay name. In 1970, two years after its founding, the population of New Bataan was 19 978 (National Census and Statistics Of- fice, 1970); by 1 May 2010 it had increased 238 % to 47 470, including 10 390 in Cabinuangan and 7550 in Andap (Na- tional Statistics Office, 2010).
Cabinuangan was laid out thoughtfully, with streets radi- ating out from a circular central core for government and so- cial functions (Fig. 4a), but the founders of New Bataan were not aware of the natural hazards it faced. No one, including the government, realized that the Kalyawan River portion of Compostela Valley had served as an avenue for ancient de- bris flows. Indeed, debris flows were not widely understood at that time, and even the government-issued hazard map of New Bataan available in 2012 (MGB, 2009) was only con- cerned with landslides and floods. This lack of geomorpho-
Figure 5.The rainfall that triggered and sustained the debris flows.
Histogram measures rain accumulated during successive 15 min in- tervals; the heavy curve is accumulated rainfall.
logic knowledge would prove fatal during Super Typhoon Bopha (Fig. 4b).
Barangay Andap was established at the head of the val- ley 3 km upstream of Cabinuangan, on high ground that was not recognized as an alluvial fan but is clearly ex- pressed as such in Fig. 2 by contour lines that are convex downstream where they cross the valley. Characteristically reverse-graded, matrix-supported debris-flow deposits of un- known but ancient age built up the fan (Fig. 3).
6 The Mayo River debris flow of 2012
Rain-gauge data from Maragusan municipality 17 km south of Andap are proxies for the rainfall that triggered the debris flow (Fig. 5). From midnight on 4 December until the flow occurred at 06:30 LT that morning, the Mayo River water- shed above the alluvial fan received 120 mm of rain, falling as intensely as 43 mm h−1, and accumulated 4.4 million m3. These values greatly exceeded the global initiation thresholds for debris flows, including those at the Philippine volcanoes Mayon and Mount Pinatubo (Rodolfo and Arguden, 1991;
Van Westen and Daag, 2005), and Taiwan (Guzzetti et al., 2008; Huang, 2013).
After the debris flow began, it was sustained un- til 07:00 LT by another 24 mm of torrential rainfall that peaked at 52 mm h−1 at 06:45 LT. This delivered an addi- tional 900 000 m3 of runoff. Substantial discharge from the 17.7 km2 Mamada River watershed joined the debris flows about 450 m downstream of the Mayo Bridge; this, along with discharge from other Kalyawan River tributaries, di- luted the western portions of the debris flow into hypercon- centrated flows that reached 2 km beyond Cabinuangan.
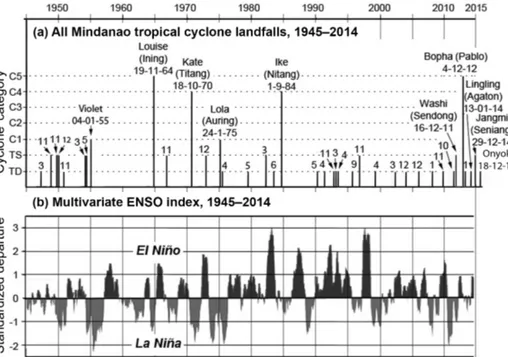
Figure 6. (a) From Unisys (2012), JTWC (2012, 2013) and NASA (21 January–30 December 2015). TD=Tropical Depression;
TS=Tropical Storm. Typhoons fully dated; TDs and TSs dated by month number only (January=1 to December=12). Panel(b)modified from NOAA Earth Science Research Laboratory (2014).
Other factors facilitated the debris flows. The rocks are ex- tensively fractured because the watershed lies in the broad, left-lateral Philippine Fault zone of which the Mati Fault in Fig. 2 is a major splay. Its steep slopes have been largely deforested by mining and logging, which facilitated numer- ous landslides, both shallow and involving bedrock, that were triggered by Bopha’s heavy rains. Powerful typhoon winds uprooted trees on the upper watershed, enhancing infiltration-triggered soil slips and erosion by runoff, pro- viding additional bulk that included clay, which increases debris-flow cohesion, mobility and runout distance (Costa, 1984). Abundant, ancient and easily remobilized debris-flow deposits underlay the path that the flows took (Fig. 3b).
At about 06:30 LT, Andap resident Eva Penserga watched in horror as the 16 m high front of a full-fledged debris flow emerged from the Mayo River gorge and obliterated a 100 m long concrete bridge 1.5 km upstream of Andap, carrying away a truck bearing 30 construction workers. Shortly there- after, people in Andap witnessed the arrival of the debris flow, which lasted only about 5 to 10 min. Unfortunately, alerts radioed the night before had directed about 200 peo- ple from outside Andap proper to seek shelter from floods at the community center where they joined many local inhab- itants; 566 people were swept away, equivalent to 7.5 % of the village population counted by the 2010 census.
Amateur video footage (available at https://youtu.be/
figGMlzDt0s) and the 5 km length of the debris-flow deposit indicate a flow velocity of 60 km h−1. No structures survived the main flow, but battered trees standing in the debris field
30 m from its eastern edge and 70 m upstream from the oblit- erated community center document slower flows there. The heights to which the flows rose up against the trees yield their velocity (Arguden and Rodolfo, 1990): assuming that all of the kinetic energy of the flow was converted to potential en- ergy as it rose up against these obstacles, the 1.7 m run-up height hindicates a velocity v of 5.8 m s−1, or 21 km h−1, fromv=(2gh)1/2. This value is only minimal because the formula considers neither channel roughness nor internal friction.
From satellite imagery and our post-Bopha lidar mapping and field measurements, the volume of the Andap debris-flow deposit is 25 to 30 million m3, ranking it among the largest ever experienced worldwide (Table 1). The deposit is 0.2–
1 km wide and 0.25–9 m thick. Debris with boulders up to 16 m in diameter (Fig. 3c) covered 500 ha and buried Andap as deep as 9 m. Downstream, clast sizes decrease and the de- posits thin, grading into sandy, laminated hyperconcentrated- flow deposits less than 0.5 m thick. These finer-grained de- posits cover 2000 hectares and extend 8 km beyond Cabin- uangan. Where these finer-grained sediments dominate, as- sociated tree debris clogs streams and creeks. In Cabinuan- gan, dozens of corpses were recovered from a tangle of fallen trees and logs (Fig. 3d).
7 The role of Philippine population growth
The global increase in death and damage from natural calamities may be due in part to the effects of anthro- pogenic climate change, but another, more likely reason is the growth of populations in high-risk areas (Huppert and Sparks, 2006). Developed nations in Europe and North America are not immune from increasing incidences of land- slide disasters (Cascini et al., 2005; Di Martire et al., 2012;
Lari et al., 2012). The trend, however, is especially pro- nounced in places that experience tropical-cyclone landfalls (Weinkle et al., 2012). Nowhere is this better exemplified than in Mindanao by the Andap disaster.
The founding of the newer Mindanao settlements includ- ing New Bataan was largely driven by the pressure of rapid population growth, well described by Dolan (1993). In 1950 the Philippine land–population ratio was about one cultivated hectare per agricultural worker; by the early 1980s the ratio had been cut in half. The 1980 census documented that 6 of the 12 Philippine provinces experiencing the fastest growth were in western, northern and southern Mindanao.
When New Bataan was settled in 1968, the annual Philip- pine population growth rate was 2.98 % and Filipinos num- bered 36 424 000. By 2014 the population had almost tripled, to 107 668 000 (United States Census Bureau International Programs, 2014). A Reproductive Health Care congressional bill was filed in 2003, its main purpose being to provide contraception to the poor. After strenuous opposition from the clergy in this predominantly Roman Catholic country, the bill was finally passed in December 2012, coincidentally the month that Bopha arrived. The annual growth rate has dropped to 1.83 %, but that means that the country will still need to provide for another two million people in 2016, and similar numbers every year for some time to come. Among these needs, housing will be extremely difficult to find be- cause hardly any hazard-free areas remain.
In February 2013 the office of the Philippine president organized Task Force Pablo, a multiagency group of geol- ogists and engineers from the Mines and Geosciences Bu- reau (MGB) and Project NOAH, to conduct field analyses of the Andap disaster and search for safe relocation sites for the people of New Bataan and other municipalities of the province of Compostela Valley. Task Force Pablo identified 31 resettlement sites using lidar-derived digital terrain mod- els and rainfall intensity–duration frequency data from the national weather service. The phenomenal event at Barangay Andap required special attention from us to identify reloca- tion sites safe from future debris flows in New Bataan. The task is a daunting one; the Kalyawan floodplain is suscep- tible to floods and debris flows, and the valley margins and adjacent high grounds are susceptible to landslides.
8 Is Bopha a harbinger of the future?
8.1 The historical record of tropical cyclone landfalls in Mindanao
The ancient debris-flow deposits in New Bataan testify that such flows occurred in Compostela Valley at least once be- fore Super Typhoon Bopha. Dating those deposits is a prime topic for future research. At present, all we can say is that the event occurred long before New Bataan was settled in 1968; the sizes of some trees rooted in the old deposits sug- gest decades or even a century or more earlier.
The most urgent question raised by these old deposits and by the Andap disaster is whether their debris flows simply represent the latest, very rare and essentially random events in Mindanao, or whether it and other places at low latitudes can expect to experience such events more frequently as the climate changes. Most climatologists (Webster et al., 2005;
Emanuel, 2005; Bengtsson et al., 2007; Elsner et al., 2008;
Emanuel et al., 2008; Knutson et al., 2010) equate climate change with fewer but more intense tropical cyclones due to rising sea-surface temperatures and atmospheric water vapor contents. However, this does not necessarily mean that ty- phoons will make Mindanao landfall more frequently in the future, even though their history since 1945 might suggest as much (Fig. 6a).
Tropical cyclones rarely and sporadically make landfall on Mindanao because the island lies in the ephemeral southern fringe of the northwest Pacific typhoon track. Furthermore, most Mindanao typhoons do not occur during the main sea- son of July through October, and most are tropical depres- sions; hence, they do not enter into most modeling attempts to predict future typhoon behavior.
In 1945 the US Navy Joint Typhoon Warning Center began to archive northwest Pacific tropical cyclones, recording only 34 Mindanao landfalls by the end of 2012 (Unisys Weather, 2012). A tropical depression arrived in January 2013. On 13 January 2014 Tropical Storm Lingling (local name Aga- ton) made landfall and killed 70 people in Mindanao (NDR- RMC, 2014). On 29 December 2014, Tropical Storm Jangmi killed 10 people in Mindanao (NDRRMC, 2015a). Finally Tropical Depression Onyok arrived on 18 December 2015 (NDRRMC, 2015b). These 38 landfalls are incontrovertible, and our search for what the future holds begins with them.
During 40 of the 69 years monitored by the US Navy Joint Typhoon Warning Center, not even a single tropical depres- sion visited the island; one quiescent period lasted 8 years, from 1956 to 1963 inclusively. Most of the tropical cyclones that affected Mindanao were of the weaker varieties: 21 trop- ical depressions, 11 tropical storms, and Category 1 typhoons Violet in 1955 and Lola in 1975.
Before Bopha, Mindanao was largely spared stronger ty- phoons except for Category 5 Louise in 1964, Category 3 Kate in 1970, and Category 4 Ike in 1984. Louise and Ike both barely grazed the northernmost tip of the island, and
Kate passed some 45 km south of New Bataan, where it is remembered as not being very windy, but having heavy rains and flooding. Only four tropical cyclones of all categories arrived during the northwest Pacific peak typhoon season of July through October, although these included Kate in Octo- ber 1970 and Ike in September 1984. In preseasonal March through June 12 storms hit, and 19 arrived during the post- season months of November through January.
From 1945 to 1989, the frequency of Mindanao landfalls was only one every 2.5 years. Then that rate abruptly dou- bled to one landfall every 1.32 years in the period from 1990 to 2015. Another fact causing concern is that Mindanao has, for the first time, recently suffered lethal cyclones in two con- secutive years. The year before Bopha, from 16 to 17 Decem- ber 2011 the city of Cagayan de Oro on the Mindanao coast 180 km north of New Bataan received 180 mm of rain from Tropical Storm Washi. Most fell during only 6 h, causing floods that killed 1268 people (Ramos, 2012; Manila Obser- vatory, 2012). A tropical depression made landfall on Min- danao 2 months before Washi, making 2011 only the fifth year since 1945 when Mindanao experienced two tropical cyclones. Only 3 years later in 2014, Mindanao again ex- perienced two lethal tropical cyclones: Tropical Depression Lingling and Tropical Storm Jangmi.
The increase in Mindanao storminess since 1990 is strik- ing and alarming. It cannot be ascribed simply to the climate change induced by anthropogenic global warming, however, and requires additional research focused on the actual record of tropical cyclones in Mindanao.
8.2 The ENSO cycle and future Mindanao typhoon activity
ENSO is the complex result of ocean–atmosphere interac- tions that are best expressed by fluctuating sea-surface tem- peratures in the central and eastern equatorial Pacific from warmer El Niño to cooler La Niña periods (Trenberth, 1997;
Wolter and Timlin, 2011). Atmospheric pressures at the ocean surface during an El Niño are high in the western Pa- cific and low in the eastern Pacific, and the situation is re- versed during a La Niña. Typical episodes of both occur ev- ery 3 to 5 years, but El Niños tend to last 9 months to 1 year and La Niñas lasts 1 to 3 years (NOAA Climate Prediction Center, 2014).
During El Niño episodes, tropical cyclones tend to form farther east, are more widely dispersed and curve north- ward, making fewer Philippine landfalls. Under La Niña con- ditions they tend to form farther west, stay below 23◦N and travel westward, thus visiting the Philippines more frequently, especially during the later typhoon months of September through November (Wang and Chan, 2002; Wu et al., 2004; Emanuel, 2005; Emanuel et al., 2008; Zhang et al., 2012). Except for their tendency to arrive later than November, all the typhoons before Bopha that made Min- danao landfalls since 1945 fit the pattern by occurring dur-
ing La Niñas (Fig. 6a and b). Bopha came either during a weak La Niña (NOAA Climate Prediction Center (2014) or a weak El Niño (NOAA Earth Science Research Laboratory, 2014). The weaker storms and depressions visiting Mindanao show no marked preference between El Niño and La Niña episodes, 15 vs. 22, respectively.
Cai et al. (2015) recently analyzed 21 global-climate mod- els of Phase 5 of the Coupled Model Intercomparison Project commissioned by the Intergovernmental Panel on Climate Change. They have arrived at the disquieting conclusions that global warming will double the frequency of future extreme La Niñas, from the historical average of one every 23 to 13 years. They ascribed the change to three effects of global warming. The western North Pacific region of archipelagos and insular seas that includes the Philippines will warm faster than the central Pacific, vertical temperature gradients of the upper tropical ocean will be enhanced and extreme La Niñas usually follow extreme El Niños, which will also occur more frequently (Cai et al., 2014). Given the tendency of typhoons to make landfalls on the Philippines more frequently during La Niñas, the Philippines, including Mindanao, should ex- pect greater storminess in future.
8.3 Other models of future typhoon behavior
A recent review by 10 prominent researchers studying the long-term response of tropical cyclones to climate change (Knutson et al., 2010) stated that considerable research on the topic has yielded conflicting results because of large fluc- tuations in cyclone frequencies and intensities, as well as se- rious deficiencies in the availability and quality of historical records. Thus, it is uncertain whether the observed changes in tropical-cyclone activity exceed the variability due to nat- ural causes. The authors do have some confidence in theory and models that project globally averaged frequencies of all tropical cyclones to decrease 6–34 % by 2100, but for inten- sities to increase 2–11 % owing to substantial increases in the most intense cyclones. Most worrisome for debris-flow gen- eration, the review predicts that precipitation within 100 km of storm centers will increase about 20 %.
In short, the record of increasingly frequent landfalls on Mindanao may or may not indicate that more frequent ty- phoon disasters will happen there in the future, although the results of Cai and coworkers (2014, 2015) strongly suggest as much. Low-latitude areas, however, are given short shrift by most meteorological and climatological analyses. Given the large populations that live near the Equator, more research of the possible impact of anthropogenic global warming on tropical cyclone behavior there is urgently needed.
9 The NOAH national catalog of alluvial fans and areas susceptible to debris flow
A positive outgrowth of the Andap disaster is the compila- tion by NOAH of all alluvial fan areas in the Philippines (Aquino et al., 2014). Alluvial fans were delineated from high-resolution digital terrain models by analyzing geomor- phic features, slopes, gradients and stream networks. So far, more than 1200 alluvial fans have been identified throughout the country, and communities under the threat of debris flows are being educated about them. The results can be accessed online for free in the NOAH portal at http://noah.dost.gov.ph.
In October 2015, Typhoon Koppu (Lando) generated dev- astating debris flows on alluvial fans in the Nueva Ecija province (Eco et al., 2015). Fortunately, communities living on those alluvial fans had been warned and evacuated. No one was killed. In December 2015, Typhoon Melor (Nona) struck Mindoro in the central Philippines, also triggering massive debris flows. Houses and buildings were buried or washed out in several communities on alluvial fans, but no one died because of timely warnings and evacuations (Llanes et al., 2016).
10 Other climate-related hazards in the Philippines and Mindanao
Future fluctuations between extreme El Niños and La Niñas pose other threats. Philippine rainfall is modulated by ENSO;
El Niños bring droughts and La Niñas cause excessive rain- fall (Lyon et al., 2006). During a protracted El Niño drought, rock debris accumulates on slopes that heavy rains of the suc- ceeding La Niña wash down, causing landslides and debris flows. Additionally, excessive La Niña rainfall encourages strong forest growth that a succeeding protracted drought dries out and renders susceptible to fire.
Mindanao has 8 active (PHIVOLCS, 2008a) and 12 poten- tially active volcanoes (PHIVOLCS, 2008b) that are popular tourist destinations, productive geothermal areas and min- ing districts. Many are situated in watersheds with impor- tant agriculture and large populations. However, like Mount Pinatubo on Luzon island before its disastrous 1990 erup- tion, these volcanoes have not yet been fully studied or in- strumentally monitored, and their populations are not used to eruptions. As Table 1 shows, some of the world’s largest de- bris flows are lahars generated on volcanoes by intense rain- fall during an eruption or even decades afterwards. Whether or not typhoons will visit Mindanao more frequently in fu- ture, any large eruption there will inevitably be succeeded by a major storm. Even without eruptions, Mindanao’s larger, taller volcanoes pose serious threats, being structurally and mechanically weak (Herrero, 2014) and are thus suscepti- ble to landslides and debris flows during exceptionally strong rainstorms.
11 Summary and conclusions
Bopha formed abnormally close to the Equator. It developed into a Category 5 Super Typhoon and made landfall at record proximities to the Equator for all tropical cyclones of that category anywhere in the world. In only 7 h, it delivered more than 120 mm of rain to the Mayo River watershed, generating a debris flow that deposited a dry volume of 30 million m3, the world’s seventh largest of record. The village of Andap was devastated and 566 of its inhabitants were killed.
Debris flows are among the most lethal of natural hazards.
They are remarkably poorly recognized in the Philippines, especially in Mindanao, which lies in the southern fringe of the western North Pacific typhoon track and thus has been infrequently visited by typhoons and debris flows. This un- familiarity exacerbated the loss of life caused by the Mayo River debris flow.
“Every health centre or school that collapses in an earth- quake and every road or bridge that is washed away in a flood began as development activities” (UNDP BCPR, 2004). The people and government authorities who established New Bataan and Andap in 1968 did not know that they were build- ing on ancient debris-flow deposits, and they were unaware of the hazardous process that produced the deposits. The lack of awareness about debris flows persisted until Bopha ap- proached, when many people were advised to seek refuge from flooding on high ground in Andap. Even after the disas- ter, the government personnel initially designated to explain the tragedy and select relocation sites treated it as a “flash flood”, not as a debris flow (MGB, 2012).
The rapid growth of the Philippine population provided the impetus for the establishment of New Bataan and Andap in the late 1960s. A Reproductive Health Care congressional bill filed in 2003 was finally passed in 2012, though how successful it will be in curbing population growth remains to be seen. Meanwhile, the population continues to expand into more areas susceptible to natural hazards. Drawing upon Andap and numerous other recent disasters, the government must more rigorously assess the hazards posed to new settle- ment sites and infrastructure.
Western North Pacific tropical cyclone data have been archived accurately since 1945. The frequency of Mindanao landfalls has doubled since 1990, a possible indication that anthropogenic global warming is making such events more frequent. Learning whether this is true or not is obscured by irregular climatic rhythms on the ENSO timescale of a few years in the western North Pacific. Additionally, most tropi- cal cyclones that affect Mindanao do not arrive in the main typhoon season of July through October and most are only tropical depressions, which most climatologists and meteo- rologists do not include as data for their models. The typhoon regimens of Mindanao and other, more densely populated low-latitude areas need more attention.
Typhoons make Philippine landfalls most frequently dur- ing La Niña episodes during the July–October main season.
In Mindanao, however, they arrive during the off season from November to June. Current models suggest that extreme El Niños and La Niñas will succeed each other more frequently, a prime example of how Earth systems, kept in balance by a myriad of interacting phenomena, fluctuate strongly when disturbed. Thus, Mindanao and the Philippines as a whole should prepare their populations for more frequent hazards associated with these events, including landslides, debris flows and forest fires.
Developing countries have difficulty funding mitigation measures, and the best and least costly recourse is to en- able each family to develop its own emergency plans, with accurate, accessible, understandable and timely government input. Among NOAH’s mandated tasks are evaluating the numerous natural hazards that confront every region of the Philippines, educating every community about the hazards they face, and advising them on how to prepare and protect themselves when the threats materialize. Thus, as a conse- quence of our work on the Mayo debris flow, Project NOAH has examined detailed topographic maps for the entire Philip- pine archipelago and identified more than 1200 alluvial fans and associated communities that may be threatened by debris flows (Aquino et al., 2014). We have also simulated potential flow paths of debris flows on all the alluvial fans and identi- fied communities threatened by them. This work has already helped to mitigate the effects of two major Philippine debris flows in 2015.
Acknowledgements. This work was funded by the Philippine Department of Science and Technology (DOST) and the Volcano Tectonics laboratory of the National Institute of Geological Sciences at the University of the Philippines (U.P.). Lidar data covering the New Bataan area were provided by the U.P. Training Center for Applied Geodesy and Photogrammetry. DOST’s Balik (Returning) Scientist Program funded Kelvin S. Rodolfo’s travel.
We thank Eric Colmenares for helping coordinate our field work and Jen Alconis, Yowee Gonzales, Jasmine Sabado and Yani Serrado for their help in the field. We thank DOST’s Advanced Science and Technology Institute and the Philippine Atmospheric, Geophysical and Astronomical Services Administration for rainfall data, Congresswoman M. C. Zamora for logistical support and Thomas Pierson for information about debris-flow mechanics.
Edited by: M. Parise
Reviewed by: two anonymous referees
References
Aquino, D., Ortiz, I. J., Salvosa, S., Timbas, N. L., Llanes, F., Fer- rer, P. K., Magcamit, M., Gacusan, R. C., Eco, R., Norini, G., and Lagmay, A. M. F.: Atlas of Alluvial Fans in the Philippines, Na- tional Institute of Geological Sciences, University of the Philip- pines, unpublished technical report, 2014.
Arguden, A. T. and Rodolfo, K. S.: Sedimentologic and dynamic differences between hot and cold laharic debris flows of Mayon Volcano, Philippines, Geol. Soc. Am. Bull., 102, 865–876, 1990.
Bengtsson, L., Hodges, K. I., Esch, M., Keenlyside, N., Kornblueth, L., Luo, J. J., and Yamagata, T.: How may tropical cyclones change in a warmer climate?, Tellus A, 59, 539–561, 2007.
Cai, W., Borlace, S., Lengaigne, M., van Rensch, P., Collins, M., Vecchi, G., Timmermann, A., Santoso, A., McPhaden, M. J., Wu, L., England, M. H., Wang, G., Guilyardi, E., and Jin, F.-F.: In- creasing frequency of extreme El Niño events due to greenhouse warming, Nat. Clim. Change, 4, 111–116, 2014.
Cai, W., Wang, G., Santoso, A., McPhaden, M. J., Wu, L., Jin, F.-F., Timmermann, A., Collins, M., Vecchi, G., Lengaigne, M., Eng- land, M. H., Dommenget, D., Takahashi, K., and Guilyardi, E.:
Increased frequency of extreme La Niña events under greenhouse warming, Nat. Clim. Change, 5, 132–137, 2015.
Cascini, L., Bonnard, C., Corominas, J., Jibson, R., and Montero- Olarte, J.: Landslide hazard and risk zoning for urban planning and development, in: Landslide Risk Management, edited by:
Hungr, O., Fell, R., Couture, R., and Eberhardt, E., 199–235, CRC Press, 2005.
Costa, J. E. (Ed.): Developments and Applications of Geomorphol- ogy, Springer-Verlag, Berlin, 268–317, 1984.
Cruden, D. M. and Varnes D. J.: Landslides: investigation and mit- igation, edited by: Turner, A. K. and Schuster, L. R., in: Land- slide Types and Processes, Special Report 247, Transportation Research Board, Washington D.C., USA, 36–75, 1996.
Di Martire, D., De Rosa, M., Pesce, V., Santangelo, M. A., and Calcaterra, D.: Landslide hazard and land management in high- density urban areas of Campania region, Italy, Nat. Hazards Earth Syst. Sci., 12, 905–926, doi:10.5194/nhess-12-905-2012, 2012.
Dolan, R. E. (Ed.): Philippines: A country study, Area Hand- book series, 550(72), Federal Research Division, Library of Congress, US Government Printing Office, 384, available at:
http://countrystudies.us/philippines/ (last access: 18 February 2013), 1993.
Ea, C., Lebumfacil, M. A., Silveron, J. M., and Juson, B.: Proposal To Declare Certain Areas in New Bataan Identi?ed As Highly Susceptible to Landslide and Flooding Geohazard., 30 pp., available at: https://www.academia.edu/5054503/POLICY_
PROPOSAL_TO_DECLARE_CERTAIN_AREAS_IN_NEW_
BATAAN_IDENTIFIED_AS_HIGH_TO_LANDSLIDE_
AND_FLOODING_AS_NO_BUILD_ZONE (last access: 24 November 2016), 2013.
Eco, R., Herrero, T. M., Llanes, F., Briones, J., Escape, C. M., Sulapas, J. J., Galang, J. A. M., Ortiz, I. J., Sabado, J. M., Ariola, H., Irapta, N., and Lagmay, A. M. F.: Bongabon, Ga- baldon and Laur, Nueva Ecija debris flows triggered by Ty- phoon Koppu, NOAH Open File Reports, 4, 36–43, available at:
http://blog.noah.dost.gov.ph/2015/12/22/ (last access: 23 January 2016), 2015.
Elsner, J. B., Kossin, J. P., and Jagger, T. H.: The increasing intensity of the strongest tropical cyclones, Nature, 455, 92–95, 2008.
Emanuel, K.: Increasing destructiveness of tropical cyclones over the past 30 years, Nature, 436, 686–688, 2005.
Emanuel, K., Sundararajan, R., and Williams, J.: Hurricanes and global warming: Results from downscaling IPCC AR4 simula- tions, B. Am. Meteor, Soc., 89, 347–367, 2008.
Gallino, G. L. and Pierson, T. C.: Polallie Creek debris flow and sub- sequent dam-break flood of 1980, East Fork Hood River basin, Oregon, United States Geological Survey Water-Supply Paper, No. 84-578, 1985.
Guzzetti, F., Peruccacci, S., Rossi, M., and Stark, C. P.: The rainfall intensity-duration control of shallow landslides and debris flows, Landslides, 5, 3–17, 2008.
Haeberli, W., Huggel, C., Kääb, A., Zgraggen-Oswald, S., Polkvoj, A., Galushkin, I., Zotikov, I., and Osokin, N.: The Kolka- Karmadon rock/ice slide of 20 September 2002: an extraordinary event of historical dimensions in North Ossetia, Russian Cauca- sus, J. Glaciol., 50, 171, 533–546, 2004.
Herrero, T. M.: The implications of the structure and morphology of volcanic edifices in the development of mass movements in the Philippine setting, M.S. thesis, Laboratoire Magmas et Volcans, Université Blaise Pascal – Clermont-Ferrand II, France, 1–50, 2014.
Huang, C.-C.: Critical rainfall for typhoon-induced debris flows in the Western Foothills, Taiwan, Geomorphology, 185, 87–95, 2013.
Hungr, O., Evans, S. G., Bovis, M., and Hutchinson, J. N.: Review of the classification of landslides of the flow type, Environ. Eng.
Geosci., 7, 221–238, 2001.
Huppert, H. E. and Sparks, S. J.: Extreme natural hazards: popu- lation growth, globalization and environmental change, Phil. T.
Roy. Soc. A, 364, 1875–1888, 2006.
Hutter, K., Svendsen, B., and Rickenmann, D.: Debris flow model- ing: A review, Cont. Mech. Thermodyn., 8, 1–35, 1994.
Iverson, R. M.: The physics of debris flows, Rev. Geophys., 35, 245–296, 1997.
Iverson, R. M., Reid, M. E., and LaHusen, R. G.: Debris-flow mo- bilization from landslides, Ann. Rev. Earth Planet. Sci., 25, 85–
138, 1997.
Jakob, M. A.: Size classification for debris flows, Eng. Geol., 79, 151–161, 2005.
JTWC (Joint Typhoon Warning Center): Annual Tropical Cyclone Report 2012, available at: http://www.usno.navy.mil/NOOC/
nmfc-ph/RSS/jtwc/atcr/2012atcr.pdf (last access: 6 June 2015), 2012.
JTWC (Joint Typhoon Warning Center): Annual Tropical Cyclone Report 2013, available at: http://www.usno.navy.mil/NOOC/
nmfc-ph/RSS/jtwc/atcr/2013atcr.pdf (last access: 6 June 2015), 2013.
Knutson, T. R., McBride, J. L., Chan, J., Emanuel, K., Holland, G., Landsea, C., and Sugi, M.: Tropical cyclones and climate change, Nat. Geosci., 3, 157–163, 2010.
Lagmay, A. M. F., Rodolfo, K. S., Siringan, F. P., Uy, H., Re- motigue, C., Zamora, P., Lapus, M., Rodolfo, R., and Ong, J.: Geology and hazard implications of the Maraunot notch in the Pinatubo Caldera, Philippines, Bull. Volcanol., 69, 797–809, 2007.
Lari, S., Frattini, P., and Crosta, G. B.: Local scale multiple quan- titative risk assessment and uncertainty evaluation in a densely urbanised area (Brescia, Italy), Nat. Hazards Earth Syst. Sci., 12, 3387–3406, doi:10.5194/nhess-12-3387-2012, 2012.
Llanes, F. V., Rodolfo, K. S., Escape, C. M., Felix, R., and Ortiz, I.
J.: The December 2015 debris flows triggered by Typhoon Nona in Baco, Oriental Mindoro, Philippines (initial assessment), un- published technical report, 1–14, 2016.
Lyon, B., Cristi, H., Verceles, E. R., Hilario, F. D., and Abastillas, R.: Seasonal reversal of the ENSO rainfall sig- nal in the Philippines, Geophys. Res. Lett., 33, L24710, doi:10.1029/2006GL028182, 2006.
Manila Observatory: Tropical Storm Sendong, available at: http:
//www.observatory.ph/cgi-bin/publications/pubdetails.py?p=137 (last access: 4 June 2015), 2012.
MGB (Mines and Geosciences Bureau): List of suscep- tible areas to mass movements in Region XI as cov- ered under the National Geohazard Mapping Pro- gram (As of July 2009), available at: http://mgbxi.org/
list-of-susceptible-areas-to-mass-movements-in-region-xi/
(last access: 7 July 2015), 2009.
MGB (Mines and Geosciences Bureau): Progress report on geohazard mapping of Brgy.Andap and Cabinuangan, New Bataan, Province of Compostela Valley, available at: http://mgbxi.org/wp-content/uploads/2013/05/Bgry.
-Andap-and-Cabinuangan-Geohazard-FINAL-Report-2.pdf (last access: 6 January 2014), December 2012.
NASA: Typhoon Bopha (Northwest Pacific Ocean), updates 26 November–10 December 2012, available at: http://nasa.gov/
mission_pages/hurricanes/archives/2012h2012_Bopha.html (last access: 18 February 2014), 2012.
NASA Earth Observatory: Bopha makes Landfall, available at: http:
//earthobservatory.nasa.gov/NaturalHazards/view.php?id=79892 (last access: 24 November 2016), 4 December 2012.
National Census and Statistics Office: Census of Population and Housing, National Economic and Development Authority, Manila, 1970.
National Statistics Office: Total Population by Province, City, Municipality and Barangay as of May 1, 2010. Compostela Valley, 2010 Census of Population and Housing, avail- able at: http://web0.psa.gov.ph/sites/default/files/attachments/
hsd/pressrelease/Davao.pdf (last access: 3 February 2014), 2010.
NDRRMC (National Disaster Risk Reduction and Management Council): Situation Report No. 38 re effects of “Typhoon PABLO” (Bopha), http://reliefweb.int/report/philippines/
ndrrmc-update-sitrep-no-38-re-effects-typhoon-pablo-bopha (last access: 5 March 2013), 25 December 2012.
NDRRMC: Situation Report No. 33 re: Effects of Tropical Depres- sion Agaton, available at: http://reliefweb.int/report/philippines/
ndrrmc-update-sitrep-33-re-effects-tropical-depression-agaton (last access: 6 February 2014), 2014.
NDRRMC: Situation Report No. 22 re: Effects of Tropical Storm Seniang, available at: http://www.ndrrmc.gov.ph/attachments/
article/1367/SitRep_No_17_re_Effects_of_Tropical_Storm_
Seniang_as_of_05JAN2015_2000H.pdf (last access: 7 July 2015), 2015a.
NDRRMC: Situation Report No. 8 re: Tropical Depression Onyok, available at: http://www.ndrrmc.gov.ph/attachments/
article/2665/Sitrep_No.08_re_Tropical_depression_ONYOK_
22DECEMBER2015_0800H.pdf (last access: 24 November 2016), 2015b.
NOAA Climate Prediction Center: Cold and warm episodes by season, available at: http://www.cpc.ncep.noaa.gov/products/
analysis_monitoring/ensostuff/ensoyears.shtml (last access:24 November 2016), 2014.
NOAA Earth Science Research Laboratory: Multivariate ENSO In- dex (MEI), available at: http://www.esrl.noaa.gov/psd/enso/mei/
(last access: 24 November 2016), 2014.
Paguican, E. M. R., Lagmay, A. M. F., Rodolfo, K. S., Rodolfo, R. S., Tengonciang, A. M. P., Lapus, M. R., Baliatan, E. G., and Obille, E. C.: Extreme rainfall-induced lahars and dike breaching, 30 November 2006, Mayon Volcano, Philippines, Bull. Volcanol., 71, 845–857, 2009.
PHIVOLCS (Philippine Institute of Volcanology and Seismol- ogy): Active Volcanoes, available at: http://www.phivolcs.dost.
gov.ph/index.php?option=com_content&view=article&id=57:
active-volcanoes&catid=55&Itemid=114 (last access: 24 November 2016), 2008a.
PHIVOLCS (Philippine Institute of Volcanology and Seismology):
Potentially active Volcanoes, available at: http://www.phivolcs.
dost.gov.ph/index.php?option=com_content&view=article&id=
60:potentially-active&catid=55&Itemid=115 (last access: 24 November 2016), 2008b.
Pierson, T. C.: Initiation and flow behavior of the 1980 Pine Creek and Muddy river lahars, Mount St. Helens, Washington, Geol.
Soc. Am. Bull., 96, 1056–1069, 1985.
Pierson, T. C.: An empirical method for estimating travel times for wet volcanic mass flows, Bull. Volcanol., 60, 98–109, 1998.
Pierson, T. C.: Distinguishing between debris flows and floods from field evidence in small watersheds, United States Geological Sur- vey Fact Sheet 2004-3142, 2005.
Pierson, T. C. and Costa, J. E.: A rheologic classification of sub- aerial sediment-water flows, Rev. Eng. Geol., 7, 1–2, 1987.
Pierson, T. C. and Scott, K. M.: Downstream dilution of a lahar:
Transition From debris flow to hyperconcentrated stream flow, Water Resour. Res., 21, 1511–1524, 1985.
Plafker, G. and Ericksen, G. E.: Nevados Huascaran avalanches, Peru, Rockslides and Avalanches, 1, 277–314, 1978.
Ramos, B. T.: Final Report on the Effects and Emergency Management re Tropical Storm “Sendong” (Washi), Na- tional Disaster Risk Reduction and Management Center, available at: http://www.ndrrmc.gov.ph/attachments/article/358/
FinalReportreTSSendong,15-18December2011.pdf (last access:
24 November 2016), 2012.
Remotigue, C.: The 5–6 October 1993 lahar event on the Bucao River, Zambales: Observed dynamics, effects and telemetered data, M.S. thesis, National Institute of Geological Sciences, Uni- versity of the Philippines, Diliman, Quezon City, Philippines, 1995.
Rickenmann, D.: Empirical relationships for debris flows, Nat. Haz- ards, 19, 47–77, 1999.
Rodolfo, K. S.: The hazard from lahars and jokulhlaups, edited by: Sigurdsson, H. et al., Encyclopedia of Volcanoes, Academic Press, San Diego, 973–995, 2000.
Rodolfo, K. S. and Arguden, A. T.: Rain-lahar generation and sed- iment delivery systems at Mayon Volcano, Philippines, in: Sed- imentation in Volcanic Settings: Society of Economic Mineral- ogy and Paleontology Special Publication, edited by: Fisher, R.
V. and Smith G. A., 45, 71–87, 1991.
Savage, S. B. and Lun, C. K. K.: Particle size segregation in inclined chute flow of dry cohesionless granular solids, J. Fluid Mech., 189, 311–335, 1988.
Schuster, R. L., Salcedo, D. A., and Valenzuela, L.: Overview of catastrophic landslides on South America in the twentieth cen- tury, Rev. Eng. Geol., 15, 1–34, 2002.
Smith, G. A. and Lowe, D. R.: Lahars: Volcanohydrologic events and deposition in the debris flow – hyperconcentrated flow con- tinuum, in: Sedimentation in Volcanic Settings, SEPM Special Publication 45, edited by: Fisher, R. V. and Smith, G. A., 59–70, 1991.
Takahashi, T.: Debris flows, Ann. Rev. Fluid Mech., 13, 57–77, 1981.
Trenberth, K. E.: The definition of El Niño, B. Am. Meteor. Soc., 78, 2771–2777, 1997.
UNDP BCPR (United Nations Development Programme Bureau for Crisis Prevention and Recovery): Reducing disaster risk: A chal- lenge for development, available at: http://www.undp.org/bcpr (last access: 24 November 2016), 2004.
Unisys Weather: Hurricane/Tropical Data for Western Pacific, avail- able at: http://weather.unisys.com/hurricane/w_pacific/ (last ac- cess: 6 February 2014), 2012.
United States Census Bureau International Programs: Demographic overview of the Philippines, available at: http://www.census.gov/
population/international/data/idb/region.php?N=Results&T=
13&A=separate&RT=0&Y=1968&R=-1&C=RP (last access: 7 July 2015), 2014.
Vallance, J. W.: Lahars, in: Encyclopedia of Volcanoes, edited by:
Sigurdsson, H., Houghton, B., Rymer, H., Stix, J., and McNutt, S., Academic Press, San Diego, 973–995, 2000.
Van Westen, C. J. and Daag, A. S.: Analyzing the relation between rainfall characteristics and lahar activity at Mount Pinatubo, Philippines, Earth Surf. Process. Land., 30, 1663–1674, 2005.
Wang, B. and Chan, J.-C. L.: How strong ENSO events affect trop- ical storm activity over the northwest Pacific, J. Climate, 15, 1643–1658, 2002.
Webster, P. J., Holland, G. J., Curry, J. A., and Chang, H.-R.:
Changes in tropical cyclone number, duration, and intensity in a warming environment, Science, 309, 1844–1845, 2005.
Weinkle, J., Maue, R., and Pielke Jr., R.: Historical global tropical cyclone landfalls, J. Climate, 25, 4729–4735, 2012.
Wolter, K. and Timlin, M. S.: El Niño/Southern Oscillation be- haviour since 1871 as diagnosed in an extended multivariate ENSO index (MEI.ext), Int. J. Climatol., 31, 1074–1087, 2011.
Wu, M. C., Chang, W. L., and Leung, W. M.: Impacts of El Niño- Southern Oscillation events on tropical cyclone landfalling activ- ity in the northwest Pacific, J. Climate, 17, 1419–1428, 2004.
Zhang, W., Graf, H. F., Leung, Y., and Herzog, M.: Different El Niño types and tropical cyclone landfall in East Asia, J. Climate, 25, 6510–6523, 2012.