Report No. 39
South Asia Human Development Sector
National Transfer Accounts Analysis For Sri Lanka
October 2012
Discussion Paper Series
Public Disclosure AuthorizedPublic Disclosure AuthorizedPublic Disclosure AuthorizedPublic Disclosure Authorized
74170
Report No. 39
South Asia: Human Development Unit
National Transfer Accounts Analysis For Sri Lanka
October 2012
Discussion Paper Series
Discussion Papers are published to communicate the results of the World Bank’s work to the development community with the least possible delay. The typescript manuscript of this paper therefore has not been prepared in accordance with the procedures appropriate to the formally edited texts. Some sources cited in the paper may be informal documents that are not readily available.
The findings, interpretations, and conclusions expressed herein do not necessarily reflect the views of the International Bank for Reconstruction and Development / The World Bank and its affiliated organizations, or those of the Executive Directors of the World Bank or the government they represent.
The World Bank does not guarantee the accuracy of the data included in this work. The boundaries, colors, denominations, and other information shown on any map in this work do not imply any judgment on the part of the World Bank concerning the legal status of any territory or the endorsement or acceptance of such boundaries.
Contents
Acknowledgements ... v
1. Background and Motivation... 1
2. Brief Summary of the National Transfer Accounts Methodology ... 2
3. Discussion of Results ... 3
4. Projections ... 17
5. Conclusion ... 19
Appendix A: Estimation of NTA components for Sri Lanka ... 20
References ... 26
Figures Figure 1: Total Labor Income and Consumption ... 3
Figure 2: Total Life Cycle Deficit (C-YL) ... 5
Figure 3: Sri Lanka NTA: Life cycle deficit ... 6
Figure 4: Mean Labor Income and Consumption ... 7
Figure 5: Private health and education consumption ... 7
Figure 6: Private expenditure on health and education ... 8
Figure 7: Share of the elderly population and total fertility rate ... 9
Figure 8: Share of elderly population and total fertility rate (expanded view) ... 10
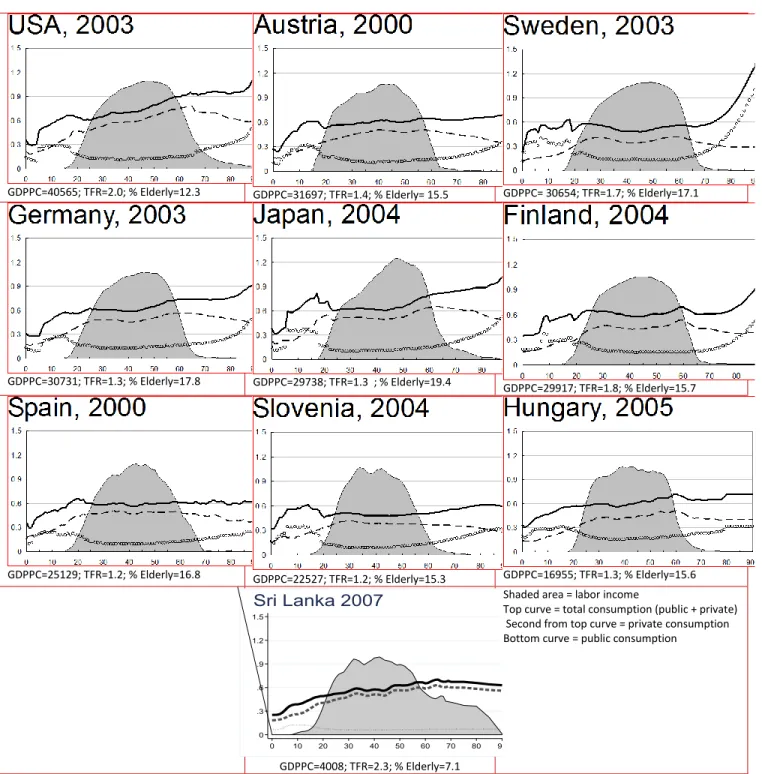
Figure 9: Sri Lanka versus Developed Countries ... 12
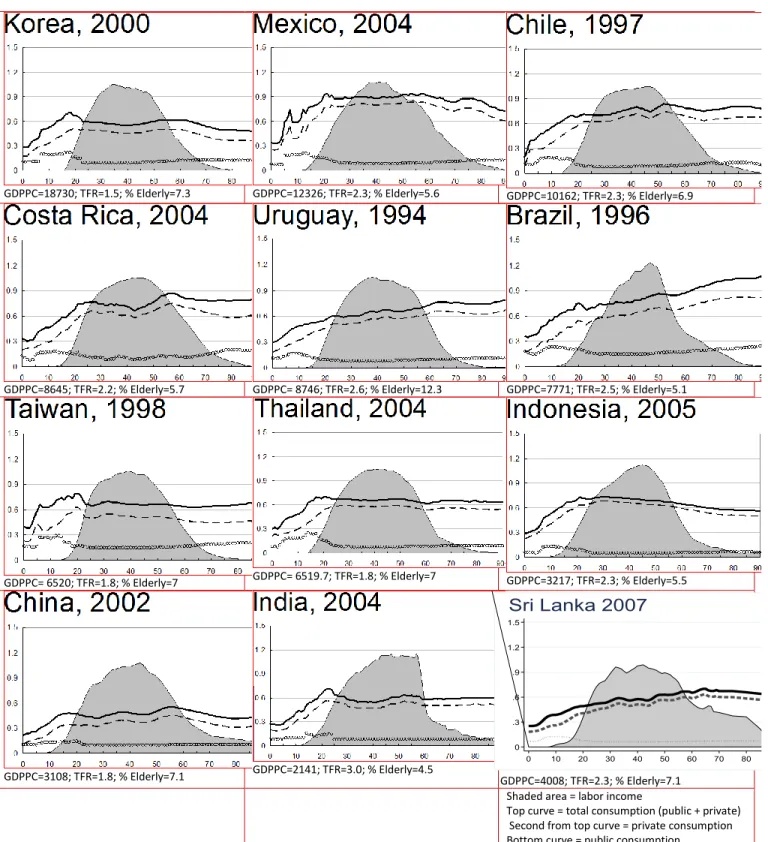
Figure 10: Sri Lanka versus Developing Countries at Similar Stage of Demographic ... 13
Figure 11: Sri Lanka versus Developing Countries at Earlier Stages of Demographic Transition and Economic Development ... 14
Figure 12: Private and public transfers, % private consumption ... 15
Figure 13: Private and Public transfers, % labor income ... 16
Figure 14: Observed and Projected Total Labor Income and Total Consumption ... 17
Figure 15: Observed and Projected Total Life Cycle Deficit (C-YL) ... 18
Tables Table 1: Aggregate Control Parameters for Income, 2007, Millions Rs... 20
Table 2: Aggregate Control Parameters for Taxes, 2007, Millions Rs. ... 21
Table 3: Private Consumption Aggregate Controls, Millions Rs ... 22
Table 4: Aggregate Control Parameters for Current Public Expenditure on Education in Primary, Secondary and Tertiary Education, 2007, Millions Rs. ... 23
Table 5: Aggregate Controls on Public Expenditure, 2007, Millions Rs. ... 24
Table 6: Aggregate Control Parameters for Transfers, 2007, Millions Rs. ... 25
Authors
Denis Nikitin, Indralal de Silva, and Tissa Jayasekara World Bank
v
Acknowledgements
This paper was written under the overall direction of Cem Mete (Lead Economist, World Bank). Authors thank Cem Mete, Susrutha Goonasekara, Nistha Sinha, and Stefania Rodica Cnobloch for insightful comments on the working drafts of this paper. Gretchen Donehower has provided invaluable advice on the National Transfers Accounts methodology.
1
1. Background and Motivation
Sri Lanka has been going through a demographic transition triggered by decreasing fertility and increasing life expectancy. The demographic transition is marked by two stages. During the first stage, the drop in new births reduces the under-age dependency ratio, while the proportion of working age population expands. This reduction in dependency ratio due to declining fertility, frequently referred to as the demographic bonus, is associated with an increased pace of economic development due to the larger share of working age population relative to the total population, and the smaller pool of dependents that workers have to support. In the second stage of the demographic transition, the consistently low fertility rates in combination with increased life expectancy for the elderly, lead to the relative expansion of the old-age dependency ratio. As the demographic transition enters the second stage, the demographic bonus deteriorates.
The extent to which Sri Lanka can benefit from the demographic transition depends in many ways on labor policies. In the first stage, the demographic transition naturally creates a larger labor force which – other things constant – will increase the output in the economy as a whole.
However, policies that promote labor productivity will augment the magnitude of the demographic bonus, e.g., investment in education, vocational and skills training, incentives to households to invest in children’s education etc.
As Sri Lanka is going through a demographic transition, it is important to take stock of the ways labor income is produced and consumed by different age groups. Similarly, when a deficit or a gap between consumption and labor income emerges, it is important to know what type of expenditures drive it and how it is financed. This paper documents labor income and consumption patterns by age group in Sri Lanka, in a manner that is comparable to work carried out for other countries that participate in the National Transfer Accounts Project.1
1 Seethe documentation provided by www.ntaccounts.org
2
2. Brief Summary of the National Transfer Accounts Methodology
This paper relies on the National Transfer Accounts (NTA) methodology (Lee and Mason, 2004;
Mason, Lee et al, 2006) in assigning expenditure and income to different age groups. This methodology makes it possible to evaluate the magnitude of difference between the amount of labor income earned by each age group and its consumption level, or the “life cycle deficit.” For working age adults, the lifecycle deficit is usually positive because their age group receives more income from labor than it consumes. Age cohorts unable to work – usually the very young and the very old – run a negative deficit, consuming more than their labor earnings. Their lifecycle deficit is then financed through a combination of public and private transfers and asset reallocation, consisting of income from assets (rents, dividends) and dissaving (e.g., sale of properties).
Following the NTA methodology, the flow of age reallocations can be described as follows:
(1) YL + YA + TGIN + TFIN = C + S + TGOUT + TFOUT .
On the left-hand side, YL stands for labor income; YA represents asset income; while TGIN and TFIN denote incoming government and private transfers. On the right-hand side C is household consumption, S stands for savings and TGOUT and TFOUT represent outgoing government (i.e., taxes) and private transfers. Private transfers in and out include inter- and intra-household reallocations.
Life-cycle deficit, or the difference between labor income and consumption can be written as (2) LCD = YL – C .
However, rearranging (1), LCD can be defined as
(3) LCD = S + TGOUT + TFOUT – YA – TGIN – TFIN = S – YA + TGNET + TFNET .
Essentially, the life-cycle deficit is the sum of net asset reallocations (savings minus net asset income) and net total transfers.
Calculations of age-specific reallocations involve two key steps: (i) calculation of age profiles – or the distribution of each NTA component (consumption, labor income, transfers) by age group – and (2) application of macro controls. While the calculation of age profiles routinely relies on household surveys, macro controls come from national accounts data.
In the case of Sri Lanka, we construct age profiles for income, household consumption, and transfers using the data from the 2007 Sri Lanka Household Income and Expenditure Survey (HIES 2007), the most recent representative household dataset. The details of creation of specific NTA components are discussed in Appendix A.
3
3. Discussion of Results
Life cycle deficit aggregate view
The vast majority of the labor income is earned by working age individuals 19 to 59 years old, who earn nearly 85 percent of all labor income. In the aggregate, consumption is heavily skewed toward the younger cohorts (see Figure 1). Children and youth under 19 account for 22 percent of private and 26 percent of total (private plus public) consumption, while contributing 2.5 percent of labor income.
Figure 1: Total Labor Income and Consumption
Thus, Sri Lanka’s aggregate age reallocation exhibits a strong downward trend with greater proportion of resources flowing toward children. This pattern reflects the large share of children in consumption, reflects their large proportion in Sri Lanka’s total population, as well as the fact that Sri Lanka is in the relatively early stage of demographic transition. Economies that have reached advanced stages of demographic transition, such as the United States or Japan, are characterized by the net upward flow of resources toward the elderly, who represent a larger proportion of population in developed countries and whose benefits are rather costly (Lee 2002).
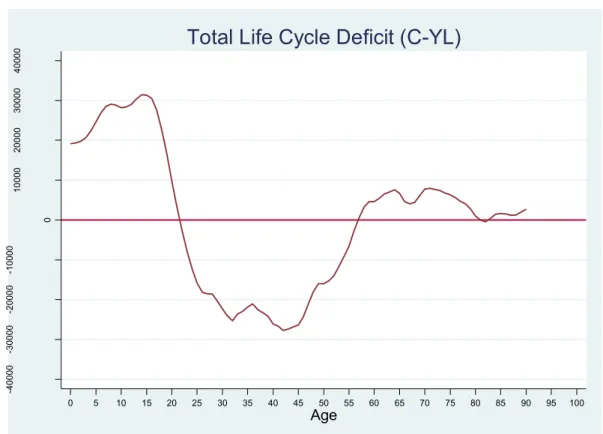
By comparison with other countries, Sri Lanka’s life cycle is characterized by a relatively early age of negative life cycle deficit. In Sri Lanka, the total life cycle deficit remains positive (i.e., total consumption exceeding labor income) through age 21 (see Figure 2). In Germany and the Philippines, for example, labor income begins to exceed consumption only by the age 27,
0
20000400006000080000
Rs millions
0 5 10 15 20 25 30 35 40 45 50 55 60 65 70 75 80 85 90 95 100
Age
Labor inc Priv cons Priv + pub cons
Total Labor Income and Consumption
4
versus 22 in Sri Lanka (Mason et al., 2009). In a series of cross-country comparisons, Austria in 2000, China in 2002, Korea in 2000 and Kenya in 1994 display comparably early age thresholds at which youth LCD disappeared (Tung, forthcoming, in Mason, 2009). For majority of the countries, the life-cycle deficit turns into surplus between the ages of 24 and 27. In some extreme cases – Mexico in 2004 and Brazil in 1996 – the surplus emerges around the age of 30.
On the income side, this pattern is driven by the relatively early age of labor force entry. On the consumption side, it is likely linked to a relatively low enrolment rate in local institutions of higher learning. Public education expenditure accounts for a sizable share of total consumption at younger ages, yet the low supply of opportunities leads Sri Lankan students to seek enrolment at colleges and universities abroad.
The total income of persons age 22 to 56 remains higher than their total consumption, but after age 57, the life deficit turns positive again. The timing of the old-age deficit is similar to that found in Germany and the Philippines.
Notably, the aggregate LCD for the elderly is small, corresponding to the relatively low level of old-dependency due to the small share of the elderly in total population. However, as the fertility rates decline and life expectancy increases, the children’s share in life cycle deficit will decline and the share of the elderly will grow. The relative expansion of the elderly age group will put pressure on the working age population to finance the upward transfers, which will require considerable improvements in labor force productivity, or – should productivity remain the same – expansion of the labor force, for instance through the increase participation of women, or increasing the amount of time one works.
The latter two options are less attractive, from the economic point of view, than the first one.
Expanding labor force participation only provides a short- to medium-term solution to the increasing old-dependency problem, since eventually even a labor force with 100 percent participation would have to increase productivity to finance the benefits of a continuously aging population. Expanding the amount of work is also problematic; Figure 2 indicates that the life cycle deficit already turns negative earlier than in a number of comparator economies reflecting the fact that an average Sri Lankan starts to work relatively early. Even earlier entry into the labor force is often associated with underinvestment in human capital (due to foregone schooling), leading to a less skilled labor force, unless complemented by work-study arrangements, and loss of productivity since a low-skilled labor force would be unlikely to engage in high-value added activities.
Extending the effective time of retirement from the labor force can “transfer” the burden of financing the old-age benefits to the elderly themselves. In fact, we already see some of this in Sri Lanka: the life-cycle deficit of individuals over 72 begins to shrink – to some extent due to continued participation of the elderly in self-employment, which generates moderate income flow for some of them while their consumption declines.2 However, delaying retirement from the labor force can put a considerable stress on the elderly and lead to adverse health outcomes. It is likely to be a more viable option when there are robust social safety nets for the elderly already in place, e.g., health care, retraining, etc.
2 Another contribution comes from civil service pension payment to former civil servants.
5
Thus, from the economic point of view, increasing productivity of the labor force offers the best way to address increasing old-dependency, but it requires additional investment in education and vocational training.
Figure 2: Total Life Cycle Deficit (C-YL)
Lifecycle deficit - per capita view
The per capita life cycle deficit reveals a different picture. The deficit for children and youth under 19 is still high, reflecting the fact that the per capita total consumption at lower ages is still high due to higher large private and public spending on health, and especially on education.
However, the per capita value of the life cycle deficit of the elderly is much higher than the aggregate view of the life cycle deficit would suggest, driven in large part by the low numbers of the elderly. Even though the elderly are able to earn income from their labor activities, their per capita expenditures (public and private) are higher as well. Thus in per capita terms, consumption by the elderly far exceeds their income and the older they are the greater the deficit.
Figures 3 through 6 illustrate these trends in per capita deficit, consumption and labor. Note that to facilitate the cross-country comparisons the y-axis reports the monetary value of per capita deficit scaled by the mean labor income of mature working age adults 30 to 49 year old. The same scaling adjustment, commonly used in NTA studies, is applied to all figures depicting per capita trends.
The high per capita deficit of the elderly implies that as the population ages and old- dependency ratio grows, the aggregate old-dependency burden will expand more than proportionately, assuming the levels of labor income and consumption remain constant.
-40000-30000-20000-10000 0
10000200003000040000
Rs Millions
0 5 10 15 20 25 30 35 40 45 50 55 60 65 70 75 80 85 90 95 100
Age
Total Life Cycle Deficit (C-YL)
6
Figure 3: Sri Lanka NTA: Life cycle deficit
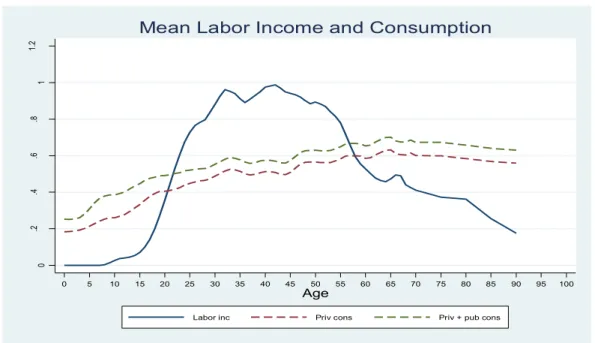
The per capita life cycle deficit of the younger population under 20 reflects their high consumption of public services (Figure 4). The nutritional needs of children are lower than those of adults, which are reflected in the use of adult equivalence scales in allocating consumption between household members. Consequently children’s total level of private consumption is low; notwithstanding the fact that their private consumption of health and education is relatively high (see Figure 5). Yet their consumption of public education – and to a lesser extent public health – is disproportionately high, which accounts for the high total consumption of children and youth.
Total consumption increases with age until the mid-60s, despite higher public consumption of persons under 25 as a result of continuous growth of private consumption and increasing public spending on health after the age of 17.
Increased private consumption reflects the progressively higher private healthcare faced by people as they age. This is understandable since aging is associated with more serious health problems. Specifically, Figure 6 indicates that per capita private expenditure on healthcare rapidly rises in absolute terms for people age 25 and older, reaching 6 percent of median labor income of 30 to 49 year olds.
The trend for private healthcare costs to rise in age is observed in many economies. Governments usually seek to offset the climbing cost through public provision and or financing health services, and Sri Lanka is no exception: per capita public spending on health steadily increases for persons 17 years of age and older. An important policy question is whether the government spending on health is sufficient to control the rising private costs as people age. Figure 6 seems to suggest that
-.5-.3-.1.1.3.5 0
Mean deficit scaled by mean labor income of 30-49 year olds
0 5 10 15 20 25 30 35 40 45 50 55 60 65 70 75 80 85 90 95 100
Age
Sri Lanka NTA: Life cycle deficit
7
public health spending grows in age, but fails to keep pace with the increasing cost of healthcare. After the age of 47, private expenditure accounts for more than half of total spending on health; and the private share in financing health care costs is even higher for older individuals.
Figure 4: Mean Labor Income and Consumption
Figure 5: Private health and education consumption
0.2.4.6.8 11.2
Value scaled by mean labor income
0 5 10 15 20 25 30 35 40 45 50 55 60 65 70 75 80 85 90 95 100
Age
Labor inc Priv cons Priv + pub cons
Mean Labor Income and Consumption
8
Another driver of private expenditure is private spending on education. Unsurprisingly, private spending on education is high among school-age children and young adults; but what is more interesting is that adults age 40 to 55 have the highest per capita private education expenditures (Figure 6). The trend reflects the fact that children’s education is heavily subsidized by public sources, while very little public support is available for adult education, mostly in the form of informal and vocational training. Figure 6 suggests that there is demand for adult learning that is currently being met by private expenditure; however, there may be scope for additional public investment in adult and informal learning as a way to increase the quality and productivity of the labor force.
Figure 6: Private expenditure on health and education
Our model of private education expenditure estimates that the elderly also report an increased spending on education. Recall that the allocation of private education expenditure is estimated indirectly by regressing total household education expenditure on the number of persons of a given age group associated with change in education consumption. Higher consumption spending in households with more elderly members may reflect contributions of grandparents to the schooling costs of their grandchildren.
Cross-country comparisons of per capita life cycle deficit
One of the benefits of the NTA methodology is the ability to draw cross-country comparisons.
Comparator countries, divided into three sets according to the stage of demographic transition, are reported in Figures 9 through 11. The comparator graphs of labor income and public and private consumption are expressed, as in Figure 3, in scaled units. The available graphs cover a wide range of countries and periods corresponding to various stages of economic development
0.02.04.06.08
Value scaled by mean labor income of 30-49 year olds
0 5 10 15 20 25 30 35 40 45 50 55 60 65 70 75 80 85 90 95 100
Age
Priv exp on health Priv exp on educ Pub exp on health Pub exp on educ
Private expenditure on health and education
9
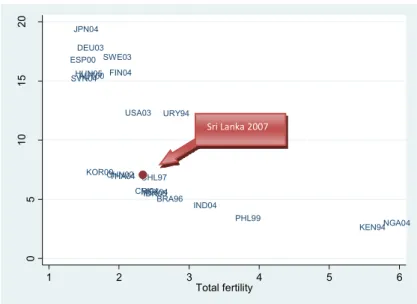
and demographic transition. Figure 7 plots the available countries with respect to their total fertility rate and proportion of the elderly (65 and older).
European economies (during 2000-2005), USA (2003), and Uruguay (1994) are obviously at more advanced stages of the demographic transition. On the other hand, Kenya in 1994 and Nigeria in 2004 are at much earlier stages of demographic transition.
In terms of demographic trends, Sri Lanka is closest to Chile in 1997, China in 2002, Costa Rica in 2004 and Indonesia in 2005; Brazil in 1996 is also reasonably close. India in 2004 and Philippines in 1999 have considerably higher fertility and a lower share of elderly population.
Despite the fact that Korea is often seen as a relevant example of successful demographic transition applicable to Sri Lanka, Korea (2000) is a bit of an outlier in that it has a relatively low proportion of the elderly (7.3 percent) for its low fertility rate (1.47). The elderly represent the same proportion of the population in Sri Lanka (7.1 percent), but its fertility rate is much higher (2.34).
Figure 7: Share of the elderly population and total fertility rate
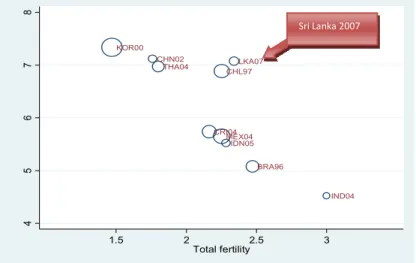
However, even economies at comparable stages of demographic transition dramatically differ in terms of economic performance and characteristics of the labor force. Figure 8 plots only countries with TFR below 3.5 and less than 10 percent of the elderly; the size of the circle corresponds to per capita income expressed in constant 2005 PPP dollars. Thus, even though Sri Lanka is comparable to Chile (1997) in terms of the elderly share in population and the total fertility rate, its GDP per capita is less than one half of Chile’s. Per capita income, in turn, has important implications for the allocation of public and private resources to health, education, and social protection.
AUT00
BRA96 CHL97 CHN02
CRI04 FIN04 DEU03
HUN05
IND04 IDN05
JPN04
KEN94 KOR00
MEX04
NGA04 PHL99
SVN04 ESP00 SWE03
THA04
USA03 URY94
05101520
Population 65 and older
1 2 3 4 5 6
Total fertility Sri Lanka 2007
10
Figure 8: Share of elderly population and total fertility rate (expanded view)
International comparisons – presented in Figures 9 through 11 – point to several patterns.
Sri Lankans start earning income earlier than their peers in other countries and become net earners relatively early as well. As one would expect, labor income remains effectively zero in the early ages since relatively few children work for pay, and when they do, they are paid little. Labor income increases beyond the negligible levels around the age of 15 in most countries, even later in developed countries where schooling is close to universal, returns to schooling are sizable, and the average household income is high, making the opportunity cost of early entry in the labor force an unattractive option. But even compared to most comparable countries or even poorer countries at earlier stages of the demographic transition, Sri Lanka stands out in terms of the relatively young age of earners. China in 2002 comes closest to Sri Lanka; in China, labor income becomes non-negligible relatively early too, around 12 years old.
In Sri Lanka’s case, children 10-11 years old already earn 3 to 4 percent of the wages of prime working age adults. Many of these are not wageworkers but work in their families’ businesses or farming. According to the NTA methodology, all household members who report working are imputed labor income based on the average wage for their age group, even if they did not explicitly report wages. Variation in household surveys may also affect the comparability of data across countries since the age threshold for asking labor related questions varies from survey to survey and from country to country. Some surveys are better at picking up child and youth employment than others.
Similar to other countries, the labor income curve in Sri Lanka shows a steep increase around the age of fifteen, as a considerable proportion of young people enter the labor force in low-skilled occupations after completing primary and lower secondary schooling. Mexico, Brazil, Costa Rica and Indonesia, among others, display a similar pattern. Yet Sri Lankan youth still remain net total consumers until the age of 21, a relatively young age by international standards, an outcome of early age of labor market entry (on the labor income side), and low secondary and especially tertiary enrolment rates (on the consumption side).
The elderly Sri Lankans work longer and earn considerable amounts of labor income well into their seventies and eighties. In most other countries, for which national transfer accounts graphs are available, labor income declines more drastically for the people after 65. This is
BRA96 CHL97 CHN02
CRI04
IND04 IDN05
KOR00
MEX04 LKA07 THA04
45678
Population 65 and older
1.5 2 2.5 3
Total fertility
Sri Lanka 2007
11
especially true of developed countries, where generous public spending on the elderly substitutes for the declining labor income. In Sri Lanka, however, public spending flows upward toward the young and is centered on education, while persons of advanced age receive little public support.
Additionally, government and semi-government sectors are large in Sri Lanka, accounting for approximately 30 percent of formal labor force; high labor income after 65 reflects a large number of relatively high pension payments to public sector retirees.
Among countries of comparable demographic stage and level of income, Brazil (1996), China (2002), and less so India (2004) report significant labor income among the seventy and eighty year olds; but still they earn less (as proportion of earnings of prime working age adults) than their Sri Lankan peers. However, Brazil has nearly double the per capita income of Sri Lanka and favors the elderly in public expenditure allocations. Only Nigeria’s elderly (in 2004) worked as long as their peers in Sri Lanka and earned similar levels of income. Notably, Nigeria’s public spending on the elderly was virtually non-existent.
Sri Lanka’s overall level of public spending is low, but similar to many countries in its comparator group: India (2004), China (2002), Thailand (2004), Indonesia (2005), Chile (1997), Uruguay (1994). Only Brazil (1996) and Taiwan (1998) have markedly higher public spending across all age groups.
Education is the biggest public expenditure item and the greatest source of public assistance Sri Lankans receive during their life course. It is concentrated around the primary and secondary levels with relatively small per capita expenditure on tertiary schooling. In this, Sri Lanka’s early age profile of consumption resembles that of the Philippines (1999) most closely: in both cases, education expenditure is lumped around primary schooling. Other countries of comparable demographic stage and per capita income allocate more public resources toward tertiary schooling, including Thailand (2004), Indonesia (2005), China (2002), India (2004), Mexico (2004), and Korea (2000).
However, the general shape of the consumption curve for age 0 through 25 is similar to those of many other developing countries, in that past the school age, public expenditure remains constant and rather low. By contrast, in OECD and some middle income economies (Brazil in 1996, Costa Rica in 2004) public per capita consumption is higher at both tails of the age distribution: both the young and the elderly receive higher levels of public allocation. For the young, public spending is predominantly focused on schooling, while for the elderly on healthcare.
What accounts for the small size of public spending relative to private expenditure in Sri Lanka?
It does not appear that the level of consumption is inordinately large, making the public share appear small in comparison. In fact, private consumption levels between 40 and 60 percent of labor income among 20 to 60 year olds in Sri Lanka prove to be on the low side. Among other countries, only Kenya and China have private consumption significantly lower than Sri Lanka’s.
So public consumption is low either because of low supply or weak demand for public services, or both. On the supply side, the evidence suggests that there exists demand for skills and training among 40 to 55 year olds, which is presently met through only private financing. The provision of higher education slots also does not meet the demand for tertiary schooling. Similarly, the results reported above indicate that public financing of health, especially for the elderly, was not keeping pace with the growing cost of healthcare, which had to be absorbed by out-of-pocket
12
expenditures. On the demand side, problems of access and quality of publicly provided services in health and education discourage people from using them.
Figure 9: Sri Lanka versus Developed Countries
GDPPC=40565; TFR=2.0; % Elderly=12.3 GDPPC=31697; TFR=1.4; % Elderly= 15.5 GDPPC= 30654; TFR=1.7; % Elderly=17.1
GDPPC=30731; TFR=1.3; % Elderly=17.8 GDPPC=29738; TFR=1.3 ; % Elderly=19.4 GDPPC=29917; TFR=1.8; % Elderly=15.7
GDPPC=25129; TFR=1.2; % Elderly=16.8 GDPPC=22527; TFR=1.2; % Elderly=15.3 GDPPC=16955; TFR=1.3; % Elderly=15.6
GDPPC=4008; TFR=2.3; % Elderly=7.1
Shaded area = labor income
Top curve = total consumption (public + private) Second from top curve = private consumption Bottom curve = public consumption
0 .3 .6 .9 1.2 1.5
0 10 20 30 40 50 60 70 80 90
Sri Lanka 2007
13
Figure 10: Sri Lanka versus Developing Countries at Similar Stage of Demographic Transition and Economic Development
GDPPC=18730; TFR=1.5; % Elderly=7.3 GDPPC=12326; TFR=2.3; % Elderly=5.6 GDPPC=10162; TFR=2.3; % Elderly=6.9
GDPPC=8645; TFR=2.2; % Elderly=5.7 GDPPC= 8746; TFR=2.6; % Elderly=12.3 GDPPC=7771; TFR=2.5; % Elderly=5.1
GDPPC= 6520; TFR=1.8; % Elderly=7 GDPPC= 6519.7; TFR=1.8; % Elderly=7 GDPPC=3217; TFR=2.3; % Elderly=5.5
GDPPC=3108; TFR=1.8; % Elderly=7.1 GDPPC=2141; TFR=3.0; % Elderly=4.5
GDPPC=4008; TFR=2.3; % Elderly=7.1 Shaded area = labor income
Top curve = total consumption (public + private) Second from top curve = private consumption Bottom curve = public consumption
0 .3 .6 .9 1.2 1.5
0 10 20 30 40 50 60 70 80 90
Sri Lanka 2007
14
Figure 11: Sri Lanka versus Developing Countries at Earlier Stages of Demographic Transition and Economic Development
GDPPC=2491; TFR=3.6; % Elderly=3.4 GDPPC=1687; TFR=5.7; % Elderly=3 GDPPC=1294; TFR=5.4; % Elderly=2.7
GDPPC=4008; TFR=2.3; % Elderly=7.1
Shaded area = labor income
Top curve = total consumption (public + private) Second from top curve = private consumption Bottom curve = public consumption
Transfers
Within the national transfer accounts, the life cycle deficit is financed either by transfers or by asset reallocation (saving and drawing on savings, or purchasing a house and selling it). In Sri Lanka’s context, it is especially important to consider the role of transfers. On the one hand, as a matter of policy, the Sri Lankan government pursues an ambitious agenda of social investments.
On the other, Sri Lanka is a big exporter of labor force, and remittances from Sri Lankan residents working abroad represent a significant amount. In the tables below, we consider the role of private and public welfare transfer sources, first relative to labor income and then in relation to private consumption.
Before considering transfers, two remarks are in order. First, note that public transfers refer to social welfare transfers only (dominated by Samurdhi, and disability benefits to soldiers, and other household welfare transfers, such programs as Triposha); they do not include flows of subsidized health or education services already included under health or education spending (e.g., transportation subsidies to students, school meals, textbooks or free checkups).
Secondly, private transfers are by and large recorded as household head’s income, even when the intended beneficiary is another household member. Therefore, their age distribution does not adequately reflect the age distribution of final consumers of transfers. This is, for instance, true of children who legally cannot be recipients of some transfers (e.g., money wired from abroad).
For this reason, private transfers have been assigned to the household head across the board. This explains the zero level of remittance income before the age of 15, and the abrupt increase in private remittance after the age of 20. Misallocation of transfers away from the elderly presents less of a problem since in the HIES, transfers are recorded at the individual level.
0 .3 .6 .9 1.2 1.5
0 10 20 30 40 50 60 70 80 90
Sri Lanka 2007
15
Following the NTA methodology, however, public transfers are assigned to the intended beneficiary, who in our case is the recipient reported in the HIES. Consequently, Figure 12 shows that public transfers play a greater role up to the age of 20 than private transfers.
In light of this pattern of assignment of transfers, it is not surprising that both public and private transfers play a much smaller role among the younger age groups, with one exception – relative to labor income, public transfers prove high among 10 to 15 year olds. The importance of public transfers for that age group is due to the low labor income of 10 to 15 year olds. Apart from this exception, the contribution of public and private transfers to labor income and consumption is greater among older age cohorts (see Figure 13).
Figure 12: Private and public transfers, % private consumption
16
Figure 13: Private and Public transfers, % labor income
Despite the fact that Sri Lanka is a net receiver of remittances from abroad, the role played by remittances is rather modest. They contribute between 4 and 7 percent of labor income after the age of 56 and 2.5 percent to 4.5 percent of consumption for the same age group. But the relative importance of remittances increases as the labor income declines and the old-age life deficit turns positive after the age of 56.
Remittances also record a spike relative to consumption and labor income for the working age group of 25 to 40 year olds, whose income from labor is high - the fact that does not fit the logic of substitution between transfers and labor income. This is likely an artifact of assigning remittances to household heads, who are often the biggest earners in the household.
Public transfers are also modest in size relative to consumption and labor income; even for the elderly over the age of 60, they range from just over 2 percent to just under 5 percent of labor income and around 2 percent of consumption. This is hardly surprising given that schemes included in public transfers tend to target underprivileged groups and do not have large coverage. Another reason for low public transfers has to do with the social assistance strategy Sri Lanka pursues: it centers on health and education services and some of the education and health programs, while programs explicitly designated as public transfers are “top ups” to them. Yet after the age of 40, the share of transfers relative to consumption plateaus at about 2 percent, despite the intuition that poverty is more prevalent among the elderly.
17
4. Projections
Population growth and aging have serious implications for the size and distribution of the life cycle deficit. On the one hand, the growing share of the working age population will expand the amount of labor income; on the other, expansion of the elderly share of the population will augment the deficit among the elderly.
Projections, based on expected age specific population growth trends,3 illustrate the growth of total labor income and consumption for different age groups (Figure 14). These projections assume that the current age profile of labor income and consumption remains constant; the only variable that drives the differences between the observed and projected curves is the differential population growth for different age groups. Thus, the total labor income expands as the share of working persons grows. Since the elderly earn a considerable amount of income, their income would also expand, but the total consumption of the elderly will increase even faster.
Figure 14: Observed and Projected Total Labor Income and Total Consumption (Public and Private)
As a result, the total life cycle deficit will expand substantially for the elderly, especially for the 60 to 75 year olds (Figure 15). For people over 60 years old, demographic change will increase the life cycle deficit by more than three fold. The deficit of the young will also grow, but to a much smaller extent (9 percent for people under 20) due to low fertility.
3 Projections are based on UN estimates of age specific population growth for 5-year age groups between 2007 and 2040.
0
20000400006000080000
Rs millions
0 5 10 15 20 25 30 35 40 45 50 55 60 65 70 75 80 85 90
Age
Observed YL 2007 Projected YL 2040 Observed C 2007 Projected C 2040
Observed and Projected Total Labor Income and Total Consumption (Public and Private)
18
Figure 15: Observed and Projected Total Life Cycle Deficit (C-YL)
It is important to reiterate that these projections do not attempt to take into account possible changes in the cost of services, such as health, which – if they were to change – would impact the biggest users of health services, the elderly and the very young disproportionately, and would alter the projected deficit at the old age. Similarly, no possible additional effects on labor income, e.g., due to increased worker productivity, are accounted for.
-40000-20000 0
2000040000
Rs Millions
0 5 10 15 20 25 30 35 40 45 50 55 60 65 70 75 80 85 90
Age
Observed 2007 Projected 2040
Observed and Projected Total Life Cycle Deficit (C-YL)
19
5. Conclusion
Sri Lanka’s aggregate age reallocation exhibits a strong downward trend with greater proportion of resources flowing toward children than the elderly, reflecting the large share of children in Sri Lanka’s total population. Yet as the demographic transition continues, the share of the elderly in the aggregate consumption will increase dramatically to reflect the greater number of the elderly surviving to older ages and the higher cost of health care in old age. The life cycle deficit projections support this view and predict the deficit for the elderly (65 and older) would grow by 246 percent, assuming the current pattern of distribution of total labor income and consumption.
Naturally, the expected expansion of old-age deficit will have to be financed one way or another.
Contrary to expectations, the role played by remittances in financing the life cycle deficit is rather limited overall. Even though the transfers play a greater role in financing consumption among the elderly, they only account for 2.5 to 4.5 percent of consumption of the elderly.
The contributions of public transfers are also low, even though they do play a greater role for people in higher age brackets.
Despite the progressive pattern of remittances and public transfers with age, there are reasons to believe that these may be inadequate to offset the growing costs associated with aging, especially the cost of healthcare. Given the low public spending on the elderly and modest public transfers and remittances, household members have to finance the deficit through a combination of intra- household transfers, and asset reallocation (dissaving, sale of assets). Sri Lanka’s elderly also seek to reduce the deficit by working well past their retirement age.
However, regardless of the nature of the reallocation mechanism, the solution to the problem of financing the projected growing numbers of the elderly must center on increasing the productivity of the labor force. Income must be generated before it is allocated. Productivity, in turn, could be stimulated through increased investment in education and vocational training, both for the younger cohorts of low-skilled workers just entering the labor force and for those middle- aged workers who require retraining.
At the current stage, the lifecycle deficit financing seems to rely less on productivity and more on early entry into the labor force and late retirement (driven by informal sector employment, since formal sector retirement ages are low) with a non-trivial proportion of the elderly continuing to work into their seventies. This is not a sustainable arrangement and efforts to increase labor productivity should be made. Public investment in education and vocational training is a key means toward this end.
20
Appendix A: Estimation of NTA components for Sri Lanka
Labor income
The age profile for labor income is calculated from the HIES survey data. It includes income from wage employment and agricultural and non-agricultural self-employment, as well as civil servants’ pensions.4 Consistently with the NTA methodology, 1/3 of self-employment income is attributed to labor, and the remaining 2/3 are attributed to assets.
Macro controls on labor income were calculated as follows: compensation to employees plus labor’s share of income taxes and taxes on good and services. While the large part of the taxes on goods and services (VAT and import taxes) is assigned to consumption, other taxes on production should be assigned to labor in proportion to labor income’s share in taxable income.5 The latter share is calculated from the survey data and is equal to 61 percent.
Table A1 summarizes the macro-control parameters used for aggregate controls on income.
Labor income should also be adjusted upward to account for some taxes on production and income, which are passed on to workers in the form of lower wage rates.
Table 1: Aggregate Control Parameters for Income, 2007, Millions Rs.
Labor income aggregate controls Millions Rs.
Compensation to employees (a) 1869325
Development subsidies (b) 11239
Sources: (a) CEIC dataset of SL National accounts.
(b) Treasury of GoSL (2008) Financial Statements for the Year Ending on December 31, 2007.
4In HIES, social pensions are not distinguished from civil servant pensions. To distinguish between the two we applied the cutoff value of 7200 rupees per year. The cutoff was calculated as follows: since there are two social pensions, which pay approximately 200 to 300 rupees per month, any given individual is unlikely to receive more than 600 rupees per month in social pensions; the annual cutoff amount for the two pensions is 600*12=7200 rupees.
5 Taxable income is defined as income from all sources, except welfare payments (but including civil servants' pensions).
21
The following aggregate controls were applied to the calculation of taxes (Table A2).
Table 2: Aggregate Control Parameters for Taxes, 2007, Millions Rs.
TAXES
Taxes related to consumption 324273
(1) VAT/G&S 187452
Alcohol 23723
Tobacco 31437
Petrol 17126
(2) Stamp Duties/ Cess Levy/ Social Responsibility Levy/RIDL/SCL
25715
(3) Port and AirPort Development Levy 26700
Taxes on foreign trade 84406
Tax related to both labor and assets
Other taxes on production 46290
of these the labor part is 60.691% 28094
Income tax 107168
of these the labor part is 60.691% 65041
Taxes related to labor only
Social security contributions 8777
TOTAL TAXES FOR ADJUSTING LABOR INCOME 101912
Consumption
We distinguish between private and public consumption, and within each of these, three distinct components are identified: expenditure on health, expenditure on education, and other
expenditure. Separate age profiles are calculated for each of these components.
Private consumption. To calculate private health expenditure age profile, we assign household- level health expenditure to individual members based on their health service utilization rate from the HIES data. The total household health expenditure is regressed on the number of household members within a given age group, which used inpatient and outpatient services.
Private expenditure on education - collected at the household level - is allocated to individual household members indirectly using and OLS regression analysis. Household expenditure on education is modeled as a function of the number of household members enrolled at each level of schooling (primary, secondary, tertiary, not-enrolled6) by age category. The regression
coefficient in then interpreted as the cost associated with attendance at a given level of schooling of an additional household member of a given age.
Other private consumption is allocated according to the consumption age profile based on adult equivalency weights.
Aggregate controls on private consumption are summarized in Table A3. Because the
disaggregation of household consumption into health and education was not available for 2007, 2006 values were used to make 2007 projections.
6 Non-enrolled members can still have education expenditures on informal schooling.
22
Table 3: Private Consumption Aggregate Controls, Millions Rs
Total household consumption (2007) 2403167
Household consumption, health (2006) 72827
Household consumption, education (2006) 30346
Total household consumption (2006) 1988378
Adjustment to 2006 levels of private consumption of health services and education (a)
2403167/1988378
Private consumption, health (2007) 88019
Private consumption, education (2007) 36676
(a) Proportionate to increase in total private consumption Sources: Sri Lanka National Accounts from CEIC database
Public consumption. Public health expenditure age profile is based on age-specific utilization rates of inpatient and outpatient care, which were then applied to the current public spending on inpatient and outpatient services. Public preventative services expenditures were allocated proportionately to population size; while expenditures on medical goods and other health expenditures are allocated proportionately to the utilization rates of inpatient and outpatient services.
Public education is financed from the central government budget at the tertiary level, while primary and secondary schooling is financed from central and provincial government budgets.
Thus, we consider general government spending, the total of central and provincial expenditures, allocated to age groups based on the age profile for enrolment at each age.
Public expenditure on education includes the cost of tuition, subsidized transportation,7 and - for primary and secondary students - supplies, and uniforms, and nutritional support for underprivileged children. Free uniforms and nutritional support could also be classified as transfers; however, we consider them together with educational spending because they are financed by the ministry of education and counted as part of education expenditure; furthermore, their allocation is consistent with the age profile for enrolment.
7 School transportation is subsidized at 90 percent of regular transportation costs for primary and secondary students and at 70 percent for university students.
23
Table 4: Aggregate Control Parameters for Current Public Expenditure on Education in Primary, Secondary and Tertiary Education, 2007, Millions Rs.
Category Millions Rs.
Personal Emoluments 58,467
Welfare programs 13886
Text books 2,250
Uniforms 1,067
Scholarships 185
Nutritional food 1,925
Season tickets 250
Other 8,209
Total 72,353
Source: Sri Lanka Ministry of Finance and Planning (2007). Annual Report 2007. Page 121.
24
Detailed macro-level inputs for calculating public expenditure are reported in Table A5.
Table 5: Aggregate Controls on Public Expenditure, 2007, Millions Rs.
Total current expenditure of general government (a) 622758
Public spending on education (b) 76343
Primary 22304
Central 20475
Provincial 1829
Secondary 39584
Central 31643
Provincial 7942
Special education 2231
Central 129
Provincial 2102
Vocational 1867
Tertiary 10357
Public spending on health (2007) (a) 54737
Total current spending (public and private) on health (2005) (c)
inpatient 39864
outpatient 24869
medical goods 26139
preventive care 6476
other 7653
Overall 105001
Share of public by type of health services (2005) (c)
inpatient 0.72
outpatient 0.35
medical goods 0.1
preventive care 0.86
other 0.24
Public spending on health by type of health service, imputed for 2007
inpatient 14962
outpatient 4537
medical goods 1363
preventive care 2903
other 957
Source: (a) Ministry of Finance and Planning (2007) Annual report 2007;
(b) Provided by Sri Lanka team, but consistent with Annual report 2007;
(c) Health Policy Research Institute (2007). Population Ageing and Health Expenditure: Sri Lanka 2001-2101.
Transfers: public, private
Private transfers are calculated as a total of foreign and domestic remittances, as well as in-kind gifts.
Domestic and foreign remittances data are collected in the income section of the HIES survey;
the values of the two types of remittances is collected separately. The aggregate controls for