Time Use and Happiness
Karma Galay
Part one: Introduction
Time is an important resource for everyone. It is also a limited resource in that we have only 24 hours in a day to put to competing uses. How we use this limited resource is important and has implications to our economic and social well-being.
Given this importance, the use or allocation of time has been studied by academics and policy analysts since the early twentieth century (Harvey & Pentland, 1999). However, more systematic collection of time use data originated only in 1924 when significant quantities time use data were collected by Soviet Union (Juster & Stafford, 1991). Since then, smaller “bits and pieces of information” on time use were collected with a focus on specific activities such as leisure and travel patterns, but it was not until 1960s that more systematic attempts was made to collect comparable data for large group of countries. The first such study was conducted by Alexander Szalai in 1963 for a group of 13 countries (Harvey & Pentland, 1999).
Eventually as research progressed, academics formulated a theory of time allocation, providing a proper framework to study time. In 1965, Gary S. Becker introduced the theory of allocation of time in which time was considered to have a cost on the same footing as the cost of market goods. At the heart of his analysis were households which were seen as both producers and consumers.
He propounded that households produced commodities by
combining inputs of goods and time according to the cost-
of commodities produced are determined by their utility maximization function subject to prices and constraints on resources. In other words, time is seen as a scarce input which is allocated between alternative productive activities as determined by utility maximization and its cost in relation to other factors.
Since the 1960s, time use studies have been carried out in most of the industrialized countries, and lately in developing countries as well, in five to ten year intervals (Juster & Stafford, 1991). Much bigger multinational time use studies have been carried out recently; the EUROSTAT conducted time use studies in 18 European countries in 1996 and 1997 (Harvey & Pentland, 1999).
Turning now to the context of the study, i.e. the rationale of choosing time use as an indicator for Gross National Happiness, let me begin by saying that time use studies provide useful information missing in conventional economic accounts. System of National Accounts which is used to calculate GDP does not measure productive activities accurately. A national accounting system that fails to recognize the total productive capacities could lead to conception and implementation of policies that are useless and harmful. In addition to paid work, productive activities include a series of unpaid activities such as household work, childcare, care of sick and old, and time allocated to various other activities for the upkeep of societies. In addition to activities done for oneself and members of one’s household, productive activities also include voluntary activities carried out for members of the community or for people outside one’s community. These activities are fundamental to the well-being of both those who provide and receive such services. A true picture of well-being can be obtained only if these activities are taken into account. Time use studies provide information on such activities that are fundamental to the well-being of society.
The detailed nature of information collected by time use studies
enables policy makers to understand the needs of special groups
of people such as the old or disabled. As people age, their demands for assistance and care increase. If these demands are not satisfied, the well-being of the old and sick will deteriorate (Andorka, 1987). Similarly, it is important to have adequate information on time parents devote to their children. The quality of care children receive is correlated with their cognitive development (Hill and & Stafford, 1980). Sound policies related to these issues can only be formulated with the help of such detailed information.
Time use studies give information on what people actually do in their lives and, therefore, provide information on work and labor allocation (including that of children) within households both at a point of time and over a period of time. Time use studies are therefore, very useful for understanding the overall transformation or change experienced by societies. Such information is useful for designing comprehensive and balanced economic and social policies; needless to mention, the well-being of societies can only be improved by informed policy formulation.
Time use studies provide information on work life balance of individuals in society. They provide information on the number of hours an individual spends on work and other activities such as socialization with family and friends, sports, and other leisure activities. Imbalance in time allocation between work and other activities is caused by a number of factors amongst which the increased number of work hours is the most prominent. An increase in work hours, in turn, is, among others, caused by one’s desire to make more money. Money becomes the focus or the driving force behind long hours of work to many individuals.
These individuals exaggerate the importance of money to their well-being and get into a situation of what has been called
“focusing illusion”. As they devote more time to work they do not
find time to do things that they enjoy. Such people are not happier
but are much more stressed than others (Kahneman et al., 2006).
correlation between time use and subjective well-being. In most of the countries covered by the survey, it was found that people who had long work hours and poor work-life balance generally had low subjective well-being (Böhnke, 2005).
As individuals juggle to do so many things, they easily become stressed. Research has documented a series of stress related impacts on the health of workers. Workers in high-strain jobs have been shown to have a higher variety of disease than their fellow workers who are not or less stressed. Cardiovascular disease, gastro-intestinal disorders, musculoskeletal problems, and the immune system are all affected by stress. Behavioral problems such as poor relations with colleagues, absenteeism, and loss of self-confidence and self-esteem are often caused by stress. All these consequences affect both actual as well as perceived well- being of individuals.
Time use data enables academics, policy analysts as well as policy
makers and implementers to understand poverty better. “A
significant part of the survival of poor households in developing
countries is through home production”, for which time available
to their members constitutes the main resource (Ilahi, 2000). The
more time they spend at work, the less time they have for leisure
and, to the extent leisure is important to well-being, it could be
said that the poor not only suffer from economic poverty but also
from time poverty and therefore low well-being. This has been
substantiated in the findings of studies by the World Bank in Sub-
Saharan Africa. These studies revealed that poor farmers,
especially women, face competing demands for their time use
(Blackden et al., 2005). They work in the farm, cook, attend to the
sick, fetch water, tend to animals and do a host of other household
activities. They do not find time to take up other productive
activities even if there are opportunities to do so. They are often
unable to take their sick children to health clinics because they are
tied to several activities. They are not able to send their children to
school even if there is an opportunity to do so. Children are
required to stay back to help their parents who are caught up in unending cycles of work. In such cases, time poverty reinforces economic poverty. Understanding such situations would enable formulating better policies to combat poverty.
In addition to the above utilities of time use studies, it merits to be included as an index of Gross National Happiness for a number of direct linkages they provide to assessing the well-being of individuals. Juster, Courant and Dow (1985) developed a concept called “process benefits” which refers to well-being derived from doing an activity independently of its end results. According to these scholars, “time plays a crucial role not only as an input into a variety of market and non-market production activities, including leisure, but that time use is equally important as a direct source of satisfaction.” In other words, activities that an individual engages in not only yield “observable and measurable outcomes in the form of market and non-market goods” but outputs in the form of satisfaction from doing those activities. Such information can be obtained and understood through time use studies.
In 2004 Kahneman, Krueger, Schkade, Schwarz, and Stone
developed a method called Day Reconstruction Method (DRM) to
quantify subjective well-being. Respondents, which comprised of
909 working women from Texas were asked to reconstruct their
previous day in terms of how they spent their time and how they
experienced a particular activity. It asked the participants to rate
different activities in terms of levels of enjoyment they had and it
was found that socializing with friends and other leisure activities
topped the enjoyment scale while being with boss and commuting
to work were at the bottom of the scale. They next used the scale
to characterize effects of variety of circumstances and observed a
very strong positive correlation between the scale of enjoyment
and circumstances. For instance, women who did not sleep well
the previous night did not enjoy activities they engaged in the next
day. By enabling researchers to determine the way people spend
their time and experience their activities, time use studies provide a meaningful lead to assess the well-being of individuals.
In 2006, Kahneman and Krueger developed another method to quantify or measure well-being. They developed a concept called U-Index which is defined as “the proportion of time an individual spends in an unpleasant state”; “an episode is classified as unpleasant if the most intense feeling reported for that episode is negative.” Using time use data, they show that respondents “who report less life satisfaction as a whole spend a greater fraction of their time in an unpleasant state.”
From the above review of literature it is clear that time use studies provide critical information related to allocation of time (a scarce resource) and its distribution among different members of households. It provides data which could be used to assess the impacts of policies, compare cultures and societies, gauge lifestyle changes, and to assess the needs of special groups of people such as the old and disabled. From the perspective of the present study, time use studies address several shortcomings of GDP-based measures of progress or development. They provide information on unpaid work, voluntary work and other community activities.
These activities are all very vital to the well-being of individuals.
More importantly, time use studies enable researchers to assess or understand the well-being of individuals directly.
Within the context of above literature, this study intends to
address three objectives: i) to find out amount of time respondents
allocated to various activities and, by doing so, to identify the
amount of household work, care work and other unpaid work
normally not included in conventional economic accounts, ii) to
find out how patterns of time use differ by gender, age, and other
social and demographic characteristics of respondents, and iii) to
assess how patterns of time use relate to reported levels of
happiness. The remaining part of the paper is organized into parts
three through seven. Part three provides an overview of the
survey questionnaire and describes the methodology of the survey and its analysis. Part four reports the time spent on various activities. Part five discusses time allocation to these activities in terms of demographic, economic and social characteristics of the respondents. Part six studies the relationship between time use and the reported level of happiness or well-being that people enjoy in their life. Part seven summarizes the findings and points out some policy implications as well as some directions for future time use surveys in Bhutan.
Part two: The survey
The survey was conducted between October 2006 and January 2007. It was carried out in nine districts of Dagana, Tsirang, Wangduephodrang, Samtse, Zhemgang, Samdrupjongkhar, Pemagatshel, Trashigang, Trashi Yangtse, Gasa, Haa, and Thimphu. Within districts, careful attention was paid to select samples from both urban as well as rural areas. A total of 950 individuals were interviewed but for the purpose of this paper, data for only 937 respondents could be used.
Data collection
Data on activities carried out by the respondents during the day preceding the interview and the amount of time spent on each of them was collected through recall method. People were asked to recall in sequential order all the activities that they carried out during the day before the interview with the begin time and end time for each activity.
Data classification
Unlike conventional time use surveys, activities were not
classified before hand. In order to classify them, various
classification systems used in time use surveys both in developed
as well as developing countries were referenced. Classification
basis of activities in fully monetized economies and often had a specific focus such as to capture unpaid or non-economic work.
The purpose of this survey, however, was to capture all economic and non-economic activities performed by respondents. So, the classification system used by developed countries was not relevant. Of the ones from developing countries, those used by India provided a good insight (Hirway, 1999). Drawing ideas from this, activities were classified according to the type of sectors they belonged to. The following categories of activities were obtained.
1) Agriculture related activities; 2) Livestock related activities; 3) Forestry and horticulture; 4) Processing of food and drinks; 5) Construction and repairs) 6) Craft related activities 7) Business, trade, and service; 8) Household maintenance; 9) Quarrying; ; 10) Care of children, old and sick household members; 11) Community participation; 12) Social and cultural activities; 13) Religious activities; 14) Education and learning; 15) Sports, leisure and mass media use; 16) Personal care; 17) Travel/commute; and 18) Waiting
The above activities can be furthered categorized into two broad categories: work activities (activities 1-10) and non-work activities (activities 11-18). The following sections first analyze time use in terms of these broad categories and eventually in terms of detailed activities.
Part three: Empirical results
4.1. Analysis of time use by broad categories of work and non-work 4.1.1 Gender analysis of time use
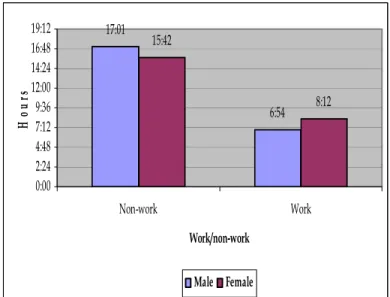
Data shows that burden of work is significantly higher for women
than that for men. Women worked an average of 8:12 hours
during the day preceding the interview while their male
counterparts worked only 6:54 hours. Contrarily, men spent much
longer time (17:01 hours) at non-work activities as compared to
women (15:42 hours). As the data clearly shows, the cushion for this excessive amount of time that women spent on work came from reductions in non-work activities.
Figure 1: Time allocated to work and non-work by gender
4.1. 2 Age analysis of time use
Skills and strengths that one commands play an important role in determining what one does. The skills and strengths in turn vary by one’s age. For instance, participation in active sports or strenuous farm work will vary substantially by one’s age.
Data shows that respondents in the age group of 31-45 years, i.e.
people who were in their prime working age, worked the longest (8 hours and 32 minutes). The shorter duration of work is recorded for respondents below 15 (5 hours and 30 minutes) and those above 60 (6 hours and 35 minutes).
Figure 2: Time allocated to work and non-work by age group 17:01
6:54 15:42
8:12
0:00 2:24 4:48 7:12 9:36 12:00 14:24 16:48 19:12
Non-work Work
Work/non-work
Ho u rs
Male Female
18:23
16:47 15:31 16:04 17:19
5:30 7:07 8:23 7:51 6:35 0:00
4:48 9:36 14:24 19:12 0:00
< 15 16-30 31-45 46-60 > 60 Age group
Ho u rs
Non-work Work
4.1.3 Time use by area of residence and gender
What one does is often decided by where one is located or based.
For instance, in areas where farming is a predominant activity (due to favorable climatic factor) or absence of alternative activities, it is likely for people of such areas to spend long hours working on their farm as compared to people of other areas.
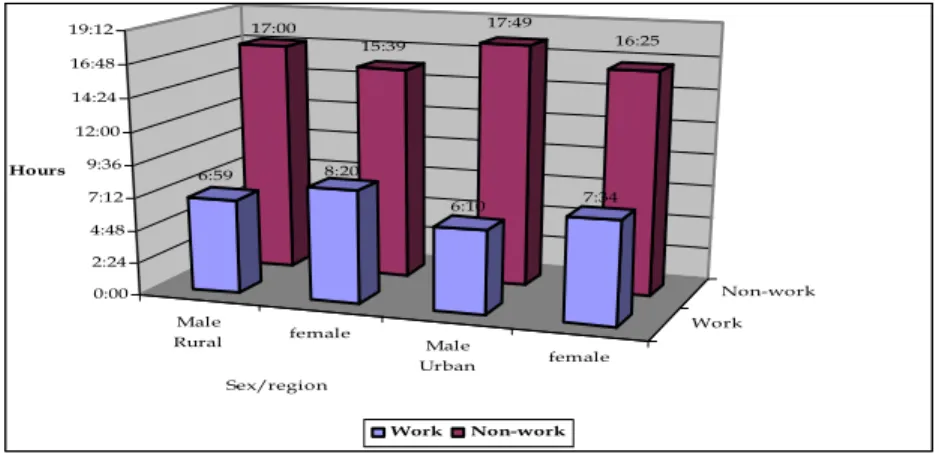
When work and non-work hours are analyzed in terms of
respondents’ area of residence and gender, we observe that
women in rural areas worked the longest (8:20 hours). Women in
urban areas have the next longest work hour (7 hours and 34
minutes). Men in rural areas worked longer their counterparts. It
is interesting to note that women in urban areas have longer work
hours than men in rural areas.
Figure 3: Time allocated to work and non-work by gender and area of residence of respondents
Variations in time use can be extended further to districts. When we do so, highest work hour is observed for respondents of Gasa (9 hours and 54 minutes) and shortest work hour is observed for respondents of Trashi Yangtse. However, given the seasonality of activities, variations between districts should not be seen as binding.
Figure 4: Work hours by districts
Male
Rural female
Male
Urban female
Work Non-work 17:00
15:39
17:49
16:25
6:59 8:20
6:10 7:34
0:00 2:24 4:48 7:12 9:36 12:00 14:24 16:48 19:12
Sex/region Hours
Work Non-work
5:15
6:29 6:42 6:45 7:02 7:32 7:39 7:43 8:07 8:10 8:40 9:54
0:00 1:12 2:24 3:36 4:48 6:00 7:12 8:24 9:36 10:48
T/Yangtse Thimp
hu Tsiran
g
Dagana Haa P/gatshel
W/Phodrang Zhemgang
Samtse S/Jongkhar
Tashigang Gasa
Dzongkhags
Work hour
4.1.4 Time use by status of employment
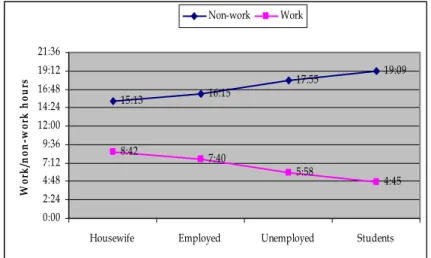
One’s employment status affects the way one allocates time to various activities. Usually, total hours of work or burden of work is more for employed respondents than unemployed, housewife or students. Data shows a finding which is contrary to this a priori expectation. It shows that house wives had worked the longest (8:42 hours) followed by employed people (7:40 hours). It also shows that unemployed respondents worked for fairly long (5:58 hours).
Figure 5: Time use by status of employment
Two issues are quite striking in the above figure: housewives working the longest and unemployed people working for fairly long (5:58 hours); they merit further analysis. When the work hours of unemployed are broken down by activities, it is observed that they spent 3 hours and 44 minutes on household maintenance activities such as cooking, sweeping, dishwashing, etc. This shows that unlike in other countries, unemployed people are not a big burden to the society; they are not unproductive people without any meaningful contributions to the society.
15:13 16:15 17:55 19:09
8:42 7:40
5:58 4:45
0:00 2:24 4:48 7:12 9:36 12:00 14:24 16:48 19:12 21:36
Housewife Employed Unemployed Students
Work/non-work hours
Non-work Work
Figure 6: Time allocation of unemployed to various activities
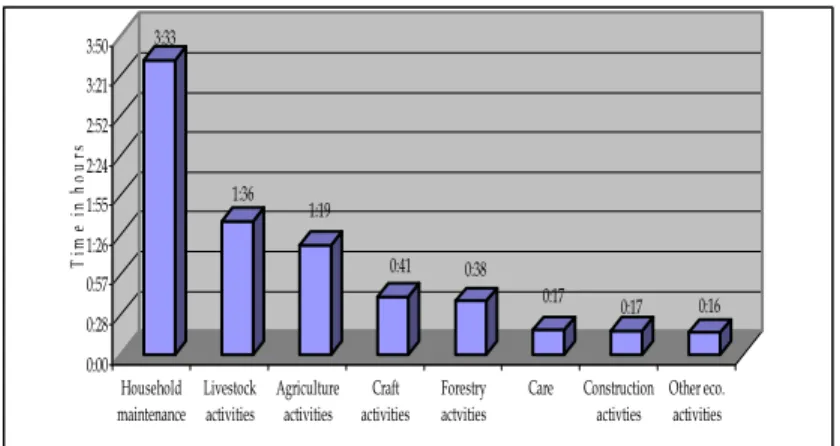
Likewise, when we look at the distribution of time by housewives to various activities, we observe that they spent bulk of their time (3:33 hours) on activities related to household maintenance. This shows the important role that housewives play in upkeep of the wellbeing of members of the family.
Figure 7: Time allocation of housewives to various activities
0:06 0:08 0:12 0:28 0:32 0:45
3:44
0:00 0:28 0:57 1:26 1:55 2:24 2:52 3:21 3:50
Time
Livestock activities Forestry
actvities Agricultural
actvities Care Craft
activities Business Household maintenance
3:33
1:36 1:19
0:41 0:38
0:17 0:17 0:16
0:00 0:28 0:57 1:26 1:55 2:24 2:52 3:21 3:50
Time in hours
Household maintenance
Livestock activities
Agriculture activities
Craft activities
Forestry actvities
Care Construction activties
Other eco.
activities
4.1.5 Time use by structure of family
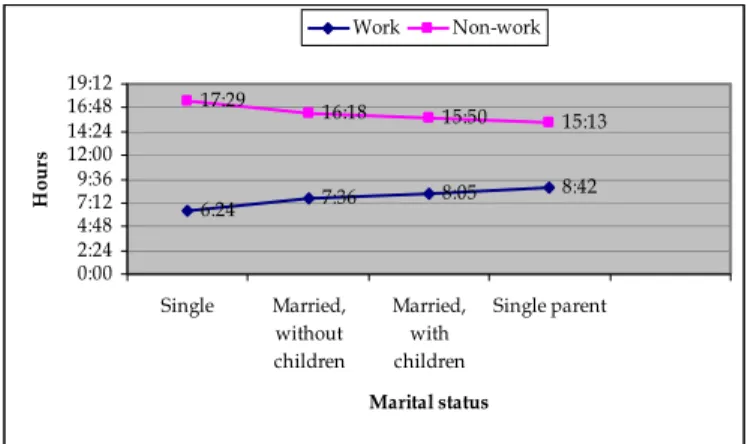
The type of family structure one belongs to could also influence how one allocates time significantly. For instance, studies have found that the presence of ‘young children substantially reduces mother’s sleep time’ (Biddle & Hamermesh, 1990). The study shows that that time spent on work is longest for single parents. It also shows that couples with children work longer than their counterparts without children indicating that the presence of children increases one’s work, particularly those related to household maintenance.
Figure 8: Time use by structure of family
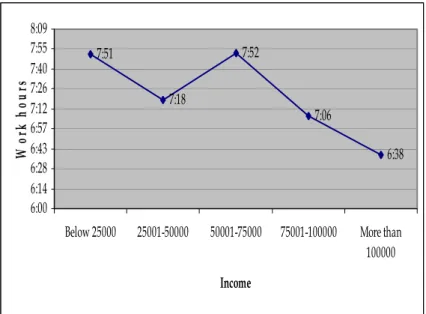
4.1.6 Time use by different income groups
How an individual put his/her time to use is a function of income.
As mentioned earlier, in many developing countries home production constitutes the main source of livelihood for which time available to their members constitutes the main resource. The more time they spend at work, the less time they have for non- work activities such as leisure. Likewise, high income people also face time crunch- multiple things that demand their attention leave them with very little time for family and friends.
6:24 7:36 8:05 8:42
17:29
16:18 15:50 15:13
0:00 2:24 4:48 7:129:36 12:00 14:24 16:48 19:12
Single Married, without children
Married, with children
Single parent
Marital status
Hours
Work Non-work
The study shows an inverse relationship between level of income and hours of work; work decreases as income increases. See figure 9.
Figure 9: Time use by levels of income
4.2 Analysis of time use by disaggregated activities
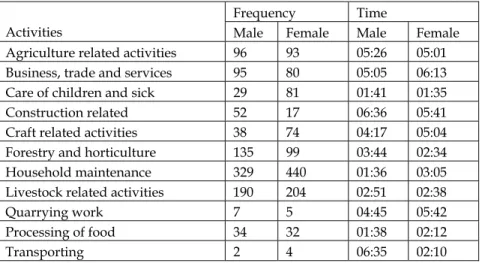
So far the paper analyzed time use at aggregated levels of work and non-work activities. This section will look at time spent on various activities under each of the two categories. Like the aggregated activities, these activities can also be analyzed in terms of gender, age, income, family structure, etc., but the paper would get lengthy and so the analysis is confined only to gender differences. Table 1 presents the distribution of respondents and the amount of time spent on various work activities.
7:51
7:18
7:52
7:06
6:38
6:00 6:14 6:28 6:43 6:57 7:12 7:26 7:40 7:55 8:09
Below 25000 25001-50000 50001-75000 75001-100000 More than 100000 Income
Wo rk h ou rs
Table 1: Time spent on various activities under work category
Frequency Time Activities Male Female Male Female Agriculture related activities 96 93 05:26 05:01 Business, trade and services 95 80 05:05 06:13 Care of children and sick 29 81 01:41 01:35 Construction related 52 17 06:36 05:41 Craft related activities 38 74 04:17 05:04 Forestry and horticulture 135 99 03:44 02:34 Household maintenance 329 440 01:36 03:05 Livestock related activities 190 204 02:51 02:38 Quarrying work 7 5 04:45 05:42 Processing of food 34 32 01:38 02:12
Transporting 2 4 06:35 02:10
4.2.1 Agriculture related activities
This category includes activities such as clearing fields, digging or plowing fields, applying manure, weeding fields, and the harvesting, and threshing. 96 men and 04 women were involved in agriculture related activities. Time spent on these activities by male and female respondents is not significant.
4.2.2 Business, Trade and Services
This category includes activities such as selling vegetables, fruits, and other farm products; selling livestock products such as butter, cheese and meat; selling food and drinks; tending to shop;
activities of officials of government and private organizations (office work); driving and ferrying people; and travels related to them. 95 men and 80 women reported engaging in these activities.
Time spent on these activities is slightly higher for women than men. See table 1.
4.2.3 Care of children & sick household members
Included in this category are activities such as feeding children,
bathing and dressing children, looking after children, putting
children to sleep, accompanying them to playgrounds and parks, transporting children to and from schools, supervising or helping children with their homework, and teaching children. Various forms of help provided to sick or old members of the households are other activities that constitute this category. Number of women (81) engaged in these activities is significantly more than men indicating the important role women play in providing care work in our society.
4.2.4 Construction and repairs
This category comprises of activities such as the construction of a new house, animal sheds, and toilets, minor or major repair of dwellings, and woola
φactivities- construction and repair of public infrastructure such as bridges, schools, health clinics, drinking water supply scheme, mule tracks, roads, temples, offices of community leaders, etc. In these activities, not only more men are engaged but also spend longer time on them as compared to women.
4.2.5 Craft related activities
Painting, knitting, spinning wool or yarn, dyeing wool/yarns, making yarn rolls, setting up looms, weaving, making bamboo baskets, making ropes, carpentry, and blacksmithing. As we see in table 1, these activities are dominated by women in both numerical representations as well as in terms of time spent on them.
4.2.6 Forestry and Horticulture
Activities included under this category comprise two sub-groups.
Under forestry related activities are included chopping or sawing of wood, collection of timber, and fetching of fodder, firewood, leaf litter, and other forest products. Horticulture related activities
φ
include the preparation of beds for horticulture plants, weeding, irrigation of orchards, and the harvesting of fruits. These activities are dominated by men; 135 men reported undertaking these activities and spent an average of 3 hours and 44 minutes while only 99 women were engaged in these activities and spent 2 hours and 34 minutes.
4.2.7 Household Maintenance
Household maintenance activities include cooking, setting up and serving meals, washing dishes, cleaning the inside and outside of the house, making fire, fetching water, and laundry related activities (washing, drying and folding clothes). Also included under this category are shopping, packing and arranging household stuffs. This set of activities is clearly domain of women;
more of them were engaged in these activities and spent much longer time on them than men. Refer table 1.
4.2.8 Livestock related activities
Activities included under this category are preparing feed, feeding animals, milking cows, grazing animals in forests, putting animals to shed, cleaning sheds, shifting cattle from one pasture to other, mating of animals, and putting up tents for the herders. In these activities too, more women were involved and spent longer time on them than men. See table 1.
4.2.9 Processing of food and drinks
This category consists of activities such as grading or sorting of
grains, drying grains, pounding of paddy, grinding maize, milling
paddy or maize, churning milk, and brewing alcohol. Normally,
these activities are dominated by women but the data shows that
more men were involved in them although time spent on them by
women is much longer.
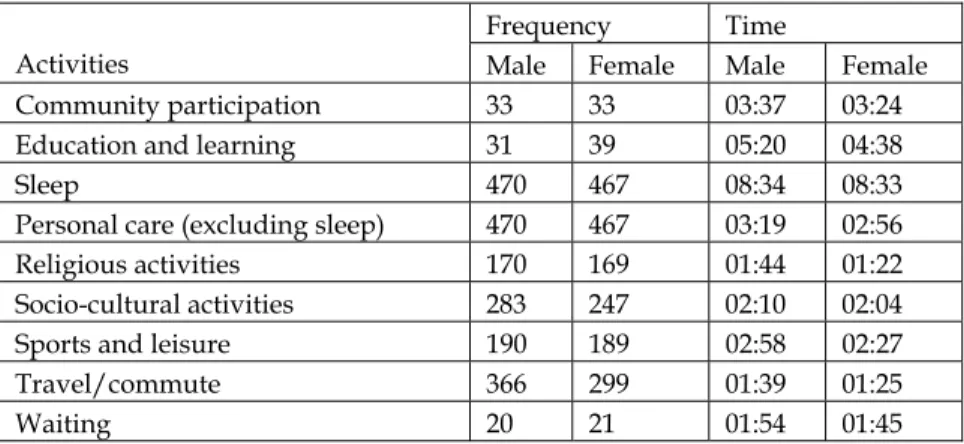
Table 2: Time spent on various activities under non-work category Frequency Time Activities Male Female Male Female Community participation 33 33 03:37 03:24 Education and learning 31 39 05:20 04:38
Sleep 470 467 08:34 08:33
Personal care (excluding sleep) 470 467 03:19 02:56 Religious activities 170 169 01:44 01:22 Socio-cultural activities 283 247 02:10 02:04 Sports and leisure 190 189 02:58 02:27
Travel/commute 366 299 01:39 01:25
Waiting 20 21 01:54 01:45
4.2.10 Community Participation
Community participation includes participation in community meetings, briefings by government officials on various issues, political activities such as voting, voluntary work and informal help provided to neighbors and other households in the community. There is no significant difference between male and female respondents both in terms of frequency and amount of time devoted to community participation.
4.2.11 Education and learning
This category includes time devoted to both activities of formal and informal learning. Attendance of class, doing homework, reading and studying for the class (either at home or school), attendance of non-formal education (NFE) class, group work and discussions, and informal education such as oral narration of information are included. Here too, there isn’t much difference between men and women respondents. See table 2.
4.2.12 Personal Care
Personal care comprises activities such as sleeping, eating and
care of self, looking for job for oneself, rest and relaxation. Since this category comprises of biologically necessary activities such as sleeping and eating, the rate of participation is 100% (937 respondents). Average time spent on personal care is high is largely due to of sleep in this category.
There is no significant difference between male and female respondents in hours of sleep. However, there is significant difference between men and women in other personal care activities which include activities such as eating, rest and relaxation.
4.2.13 Religious Activities
Religious activities consist of reciting prayers and mantras, offering water and incense to the altar, lighting butter lamps, burning incense outside the house, conducting or organizing rituals, meditation, prostrations, and hoisting prayer flags. Other activities such as attendance of religious teachings, pilgrimages to religious sites or lamas within and outside the community, and circumambulation of chortens or lhakhangs are included in this category. No significant difference is observed between men and women in their time devoted to religious activities. See table 2.
4.2.14 Social and Cultural Activities
Social and cultural activities include socializing with members of the family, relatives, friends and neighbors, attendance of tsechus, festivals, religious ceremonies of neighbors, community religious ceremonies, cultural shows, and the spectatorship of sports activities. It also includes going to see a new born and celebrating losar (New Year) with families, friends and neighbors, and attending funeral ceremonies. In terms of time spent on these activities, the difference between men and women is very small.
However, more men (283) reported engaging in these activities
than women (247), indicating that their extended work hours keep
them away from social and cultural activities. See table 2.
4.2.15 Sports, leisure, & mass media use
The sports and leisure category includes both active and passive leisure activities. Active leisure comprises activities that require physical exertion such as playing archery, khuru, tennis, taekwon- do, snooker, and going for a walk. Passive leisure include activities such as watching TV and video, listening to radio and music, reading books, telephonic conversations, writing diaries, and playing cards. Hobbies such as playing guitar and other musical instruments are included here. Not much difference is observed between men and women in these activities. Refer table 2
4.2.15 Travel and commute
This sub-category includes travel undertaken for all categories of work and non-work activities. For instance it includes travel to and from work, visiting public offices and functionaries such as:
the gup’s office to pay tax, obtain permits for firewood and timber or resolve disputes; the court to settle disputes; and the tshogpa’s house for his/her views on certain matters. More men reported undertaking this activity and also the amount of time spent travel and commute by men is higher than that of women’s. See table 2.
4.2.15 Waiting
This category includes time spent on waiting to see a doctor, extension agent, census and immigration officials, gups, civil servants, etc. 41 respondents reported spending close to two hours on waiting for the delivery services by public officials.
Part five: Relationship between time use and happiness
Analysis so far has focused on patterns of time use and various factors that determine them. In doing so, we have been able to find the average amount of time allocated to all categories of activities.
These findings present a good picture of the nature of economic
and non-economic activities that are commonly pursued by
Bhutanese. The findings also show how activities differ by age,
family one belongs to. This section looks at how the use of time in different areas of life interacts with subjective well-being or happiness of the respondents. Following the past studies on this topic, I discuss below how time spent on work, socialization, community participation, religious activities, and sports and leisure by the respondents relate to their reported level of happiness.
5.1 Total hours of work and reported level of happiness:
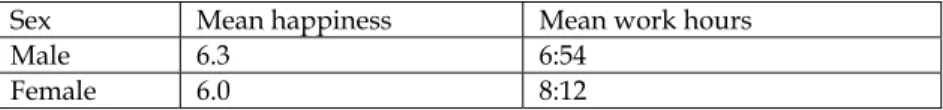
A brief review of studies that revealed strong association between time use and happiness was provided at the beginning of this report. These studies found that people who worked long hours were usually less happy or satisfied with their life in general compared to people who worked fewer hours. Our study reveals findings that are consistent with these studies. It shows that women respondents who worked much longer than their male counterparts are less happy. See table 3.
Table 3: Cross tab between work hour and mean happiness Sex Mean happiness Mean work hours
Male 6.3 6:54
Female 6.0 8:12
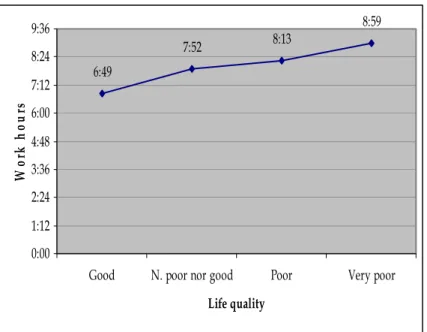
It is also observed that respondents who work for long have poor
quality of life. See figure 10.
Figure 10: Work hours vs. life quality
The channels through which long duration of work affects well- being are stress and the related health problems that people suffer.
Studies carried out in Japan revealed a positive correlation between long work hours and ‘karoshi’ (a syndrome of cardiovascular attacks such as strokes, myocardial infarction or acute cardiac failure). Uehata (1991) studied over 200 karoshi victims and found that two-thirds of the victims had worked more than 60 hours a week and more than 50 hours overtime work per month prior to the attack. This study shows similar link between time use and health problems. Respondents who worked for longer duration reported higher stress level and did not rate their health as high as their counterparts who worked for shorter duration. See table 4.
6:49
7:52 8:13
8:59
0:00 1:12 2:24 3:36 4:48 6:00 7:12 8:24 9:36
Good N. poor nor good Poor Very poor
Life quality
Wo rk h ou rs
Table 4: Relationship between work hour, stress and health status Work hour Stress level Health status
07:42 Very Good
07:37 Somewhat Excellent 07:27 Not at all Excellent
The other channel through which long duration of work affects well-being is not being able to maintain a balance between work and other aspects of life such as spending time with family and friends, doing exercise, praying, and other activities that one enjoys.
Figure 11.a: Work hours vs. frequency of Praying
Work hour
7:05
7:46
8:07
6:28 6:43 6:57 7:12 7:26 7:40 7:55 8:09 8:24
Daily Occasionally Not at all
Prayer recitation
W o rk hour
Figure 11.b: Work hours vs. visit to spiritual places
As we see in the above charts, respondents that have longest hours of work did not pray or visit religious places. Being unable to pursue such activities does affect one’s wellbeing. See figure 12.
Figure 12: Happiness vs. frequency of praying
6:33
7:32
8:56
0:00 1:12 2:24 3:36 4:48 6:00 7:12 8:24 9:36
Daily Occasionally Not at all
Visit places of spiritual places
Mean work hour
6.15
6.12 6.16
6.10 6.11 6.12 6.13 6.14 6.15 6.16
Daily Occasionally Not at all
H a p p in ess l evel s
5.2 Socialization vs. reported level of happiness
Participation in social and cultural activities is “a resource which contributes to social cohesion and enables communities and societies to survive and grow”. Social capital, which contributes to the well-being of the society, arises out of participation in informal social networks such as interactions with friends, colleagues or families, and participation in community events. Social networks that one develops through such interactions help one in times of adversities.
The importance of social network or social capital to one’s well- being can be found in several recent research publications.
European Quality of Life Survey (2005) found that subjective well- being declined significantly in population groups who could not count on social support compared to those who were socially integrated. The study also found that people with limited opportunities to contact friends suffered low subjective well- being.
Apart from instrumental support such networks provide during times of difficulties, they also provide intrinsic benefits. One always enjoys time with family and friends and being able to enjoy one’s time is crucial to well-being or happiness. One study found that people with higher rate of social participation had a higher frequency of positive feelings, and that contacts with friends tended to increase positive feelings more than other contacts (Phillips, 1967).
The survey reveals finings that are in conjunction with above
studies. Respondents who socialized during the previous day
reported higher level of happiness than those who did not
participate in any social and cultural activities. The mean
happiness score for those who participated in some social and
cultural activities was 6.3 points whereas it was 6.1 points for
those who did not engage in any social and cultural activities. See figure 13.
Figure 13: Mean happiness vs. socio-cultural activities 6.3
6.1
6 6.05 6.1 6.15 6.2 6.25 6.3
M ea n ha ppine ss
Yes No
Participation in socio-cultural activities
5.3 Community participation vs. happiness
Participation in community meetings and political activities are seen to yield both intrinsic and extrinsic benefits that eventually affect the happiness of individuals. Intrinsically, through participation in such community meetings and events people experience self-worth and self-efficacy. Extrinsically, community participation in development activities and political events are expected to yield results that are balanced and sustainable.
The data reveals a finding that is in contrast to these a priori
expectations. We observe that respondents who participated in
community activities reported lower happiness (6.1 points) than
those who didn’t (6.2).
Figure 14: Mean happiness vs. community participation
6.1
6.2
6.04 6.06 6.08 6.1 6.12 6.14 6.16 6.18 6.2
Mean happiness
Yes No
Com m unity Par ticipation
What could be the reasons behind why Bhutanese dislike participation in meetings? More research would be required to find out the exact reasons but I would dare to state here that participation in such events distract people from doing their farm work. People see participation in such meetings as more of a burden than a privilege. Another possible reason could be low political consciousness among the Bhutanese population, especially the rural residents. People are yet to associate any kind of pride or meaning to time they are required to spend in participating in such meetings. Also, the number of people who participated in community activities is very small as compared to those who didn’t and so a true picture would require more comprehensive data.
5.4 Sports and leisure vs. level of happiness
The role of sports and leisure in affecting the well-being of individuals has been widely studied. These studies have found sports and leisure, particularly the active ones, to have positive causal effects on the well-being of individuals. Schnohr et al.
(2005) found people with sedentary leisure patterns to report high
levels of stress, dissatisfaction and less psycho-social well-being.
In their study of working Brazilian women, Ponde and Santana (2000) found that those with active leisure schedules in addition to their commitments to work, childcare and household maintenance, tended to test higher on routine measures of mental health than those without much or no involvements in leisure and sports. A study by Biddle and Mutrie (1997) found that exercise such as aerobics for 8 to 10 weeks, two to four times a week, increased happiness and reduced clinical depression and anxiety.
Exercise and sports are effective through the release of endorphins, social interaction, and the experience of success and self-efficacy.
Leisure activities such as dance and music affect well-being by inducing positive moods and social interaction. Cinema attendance has been found to have positive effects on happiness and negative effects on self-reported anxiety and depression (Uhrig, 2005). The type of visual stimulation that films provide provokes an emotive response holding therapeutic properties.
“The collective and controlled experience of this emotive response promotes well-being generally.” On the other hand, excessive engagement in leisure activities such as watching television have been found to affect well-being or happiness negatively. Frey et al.
(2005) found that heavy television watchers experienced lower well-being than others. Many individuals lose control over their behaviour and watch TV in excess. Such behaviour leads individuals to regret when the opportunity cost of their time is high. Long hours of TV watching leads to higher anxiety and material aspirations, thereby lowering life satisfaction. Also, excessive watching of TV crowds out other activities, particularly relational activities, which matter significantly to one’s well-being (Bruni and Stanca, 2005).
Supporting the general idea of a positive relationship between
sports and leisure and happiness, the data reveals that
respondents who engaged in sports reported higher levels of
Figure 15: Mean happiness and participation in sports and leisure
6.4
6.0
5.8 5.9 6 6.1 6.2 6.3 6.4
Mean happiness
Yes No
Participation in sports and le isure activities
5.5 Religious activities
Studies have found engagement in religious activities to affect happiness of the people positively. Barkan and Greenwood (2003) cites three channels through which religious activities affect wellbeing or happiness of individuals. First, engagements in religious activities facilitate building social contacts. These social ties yield emotional and instrumental support during times of difficulties and problems. Second, by turning to their faith, people are better able to cope with stress and other problems in their life.
Engaging in religious activities bolster self-esteem and efficacy.
Religious engagements offer a sense of meaning in life leading to increase in perceived wellbeing of individuals. Third, through denouncement or discouragement of unhealthy behaviors such as use of alcohol, tobacco and drugs, engagement in religious activities promote healthy life styles.
Data reveals results that support the above findings. Respondents
who engaged in religious activities reported a mean happiness of
6.2 points as opposed to 6.1 points for those who did not engage in religious activities. See figure 16.
Figure 16: Religious activities and mean happiness
6.2
6.1
6.04 6.06 6.08 6.1 6.12 6.14 6.16 6.18 6.2
Mean happiness
Yes No
Participation in religious activities