Review
Metabolomics Biomarkers of Prostate Cancer:
A Systematic Review
Marouane Kdadra
1,†, Sebastian Höckner
1,†, Hing Leung
2,3, Werner Kremer
4and Eric Schiffer
1,*
1
Numares AG, Am BioPark 9, 93053 Regensburg, Germany; marouane.kdadra@numares.com (M.K.);
Sebastian.Hoeckner@numares.com (S.H.)
2
Institute of Cancer Sciences, College of Medical, Veterinary and Life Sciences, University of Glasgow, Glasgow G61 1QH, UK; h.leung@beatson.gla.ac.uk
3
CRUK Beatson Institute, Bearsden, Glasgow G61 1BD, UK
4
Institute of Biophysics and Physical Biochemistry, University of Regensburg, 93053 Regensburg, Germany;
Werner.Kremer@biologie.uni-regensburg.de
* Correspondence: eric.schiffer@numares.com
† These authors contributed equally to this work.
Received: 23 January 2019; Accepted: 14 February 2019; Published: 19 February 2019
Abstract: Prostate cancer (PCa) diagnosis with current biomarkers is difficult and often results in unnecessary invasive procedures as well as over-diagnosis and over-treatment, highlighting the need for novel biomarkers. The aim of this review is to provide a summary of available metabolomics PCa biomarkers, particularly for clinically significant disease. A systematic search was conducted on PubMed for publications from July 2008 to July 2018 in accordance with PRISMA guidelines to report biomarkers with respect to their application in PCa diagnosis, progression, aggressiveness, recurrence, and treatment response. The vast majority of studies report biomarkers with the ability to distinguish malignant from benign prostate tissue with a few studies investigating biomarkers associated with disease progression, treatment response or tumour recurrence. In general, these studies report high dimensional datasets and the number of analysed metabolites often significantly exceeded the number of available samples. Hence, observed multivariate differences between case and control samples in the datasets might potentially also be associated with pre-analytical, technical, statistical and confounding factors. Giving the technical and methodological hurdles, there are nevertheless a number of metabolites and pathways repeatedly reported across various technical approaches, cohorts and sample types that appear to play a predominant role in PCa tumour biology, progression and recurrence.
Keywords: prostate cancer; metabolomics; biomarkers; systematic review; metabolites; profiling
1. Introduction
Prostate cancer (PCa) is the most common cancer in males aged over 70 years and the second most common cause of cancer death in men [1]. Annually, there are more than 1.1 million newly diagnosed patients worldwide. Curative treatment consists primarily of surgery and various forms of radiation therapy [2,3]. Nevertheless, globally each year about 270,000 men die from PCa [4].
Moreover, costs occurring in developed nations in the first year after diagnosis are high. On the one hand, overtreatment of indolent tumours, besides having a negative impact on quality of life, is a major burden on public health care systems. There is a growing body of evidence indicating that an important proportion of patients with high-risk disease may be undertreated, leading to further and often costly treatments for more advanced or metastatic disease [5]. As incidence rates are expected to rise due to demographic changes, improved clinical management of PCa would improve patient
Diagnostics2019,9, 21; doi:10.3390/diagnostics9010021 www.mdpi.com/journal/diagnostics
outcomes and reduce the cost-burden to health care systems. Most patients with early-stage PCa are asymptomatic [1]. Signs of locally advanced or metastatic disease include unspecific lower urinary tract symptoms that can also arise from benign hyperplasia of the prostatic gland. To date, digital rectal examination (DRE) and testing for prostate specific antigen (PSA) are still the most common clinically used tools for early detection, which however fail to predict clinical behaviour [1]. As PSA has a low specificity and is associated with a high number of false positive rates [1], any nodularity or induration of the prostate gland or increase in PSA-level will consecutively lead to further evaluation by biopsy or via imaging technologies.
While multiparametric magnetic resonance imaging (MRI) holds some potential with continued evaluation to improve prognostic information [6], current clinical practice still relies on histopathological evaluation of biopsy specimens using the Gleason scoring system, which is based on the glandular architecture [1]. Biopsies, albeit the most reliable, remain a problematic assessment of the tumour extent and biology, as the procedure with up to 20 cores taken constitutes a substantial burden and has significant potential side effects and complications. Patients are assigned into clinical risk groups (low, intermediate, or high-risk), depending on PSA-level, Gleason grade and clinical tumour-lymphnode-metastasis (TNM) staging [1]. The extent of PCa may be supplemented with bone scanning, computed tomography (CT) staging or MRI according to clinical risk groups. Unfortunately, this scoring system suffers from a high inter-observer variability [7] and the inherent risk of missing more progressed/aggressive areas of the tumour, leading to misclassification. More importantly, these classifications used for clinical decision-making cannot consider distinct tumour phenotypes and hence fail to reliably predict patients’ individual risk.
The majority of PCa detected by screening have PSA levels between 4–10 ng/mL and moderate Gleason sum scores. These patients are considered to have low to moderate risk disease, and their treatment decisions should ideally be tailored to their anticipated tumour behaviour. “Active surveillance” that defers initial treatment in favour of close monitoring and reassessment of non-aggressive low-Gleason score PCa was introduced. However, it still requires repeated PSA-testing coupled to re-biopsies (often at multiple time points) with additional risks and costs.
Depending on the findings and the psychological distress, clinicians and patients often tend to opt for intense therapy in the absence of any decisive indication for the presence of aggressive disease, which significantly contributes to widespread overtreatment. According to current estimates, up to 50% of PCa patients are subjected eventually to intense therapy, while only 20% are suffering from aggressive disease [1]. Thus, PCa is a common but not particularly aggressive form of cancer.
Once a clinical decision for intense therapy has been made, patients will initially receive surgery or various forms of radiation therapy, which is associated with severe side effects, impacting negatively on quality of life [2,3]. Up to 50% of men treated with surgery or radiation in curative intent will eventually relapse based on evidence of a detectable or rising level of PSA [8]. The current standard of care for metastatic disease is anti-hormonal therapy (+/ − docetaxel chemotherapy or second generation androgen receptor pathway inhibitor), as most tumours are hormone-dependent and therefore respond initially well to various forms of androgen deprivation therapy. Unfortunately, most PCas will recur after 18–33 months to develop castration-resistant prostate cancer (CRPC). This cancer subtype requires a multidisciplinary approach and involves counselling of the individual patient to discuss the viable treatment options such as second line hormonal treatment or chemotherapy. Despite ongoing research efforts, including studies with modern tyrosine kinase inhibitors, modern strategies to control CRPC have shown clinical benefits that are not sustained beyond two years [9]. This is mainly due to the fact that stratification of PCa patients based on molecular characteristics has not been implemented, which in turn is explained, at least in part, by the genetic complexity of PCa [10].
All these facts underline the urgent need for novel biomarkers [11] to improve clinical decision
making and management of PCa. The rapid advances in molecular technologies allowed identification
of various potential biomarkers for PCa. These technologies include genetic sequencing, transcriptomic
expression profiling, proteomic and metabolomic profiling. The metabolome represents the complete
set of metabolites as end products of cellular processes in a biological cell, tissue, organ or organism.
Metabolomics can be considered as a downstream or end-result measure of activities on the level of the genome, epigenome, transcriptome and proteome, and their interactions with the environment [5].
Tumour cells are particularly reported to express distinct metabolic signatures [10] and their interactions with the environment are more and more described as tumour microenvironment and carcinoma-associated fibroblasts that are emerging fields of research [12,13]. Accordingly, over the last decade, an increasing number of studies have attempted to capture metabolomic biomarkers for PCa and these were most recently discussed in several narrative review articles. However, none of these were systematic. Therefore, the aim of this review is to provide a systematic qualitative summary of current evidence relevant to metabolomics biomarkers for prediction, diagnosis, progression, prognosis, or recurrence of PCa according to PRISMA (Preferred Reporting Items for Systematic Reviews and Meta-Analyses) guidelines.
2. Methods
This systematic review follows the PRISMA guidelines and is reported in accordance with the PRISMA statement.
2.1. Search Strategy
A systematic search was conducted on PubMed for all publications with relation to metabolomics biomarkers of prostate cancer reported from July 2008 to July 2018, using the following combinations of MeSH terms: prostate cancer (tiab) intervention with (metabolite OR metabolomic OR metabolomics) intervention with (marker OR biomarker). Initially, titles and abstracts of all identified studies were screened and reviewed on the basis of the established selection criteria.
2.2. Selection Criteria
English articles were selected based on their titles and abstracts for full-text review according to their relevance to the issue of interest. The following inclusion criteria were applied with no restriction to the bio-specimen used: identification of human PCa specific metabolites; indication on PCa diagnosis, prognostics, aggressiveness or recurrence; evidence for the clinical utility of the biomarkers; level of standardization of the analytical platforms used and their limitations. Only metabolomics studies were included; other “omics” results were excluded. In addition, reviews and studies made on animal models of PCa or on cell model systems were excluded. Finally, a screening of the reference lists of included articles resulted in reviewing additional titles and abstracts for potential inclusion.
2.3. Data Extraction
The selected studies were thoroughly examined and the following information were extracted from each article: name of first author, year of publication, sample size (specifying the number of cases and controls), analytical platform used, use case, relevant biomarkers candidates, validation of biomarkers, statistical details and relevant comments about the study. Data were independently extracted by two different reviewers (M.K., S.H.) and disagreements regarding the selected information were solved by further review and discussion among them.
3. Results
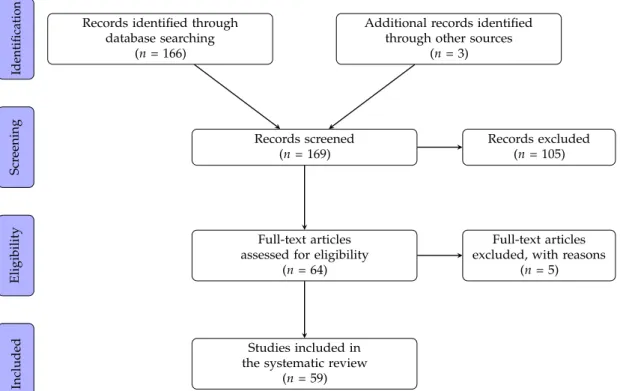
A total of 169 articles were identified in the literature search (Figure 1). The full text was obtained
for 64 articles after screening and exclusion on the basis of titles and abstracts. Five of these article were
excluded from the analysis after the full text reading. The remaining 59 are summarized in Tables 1–4.
Records identified through database searching
(n= 166)
Additional records identified through other sources
(n= 3)
Records screened (n= 169)
Records excluded (n= 105)
Full-text articles assessed for eligibility
(n= 64)
Full-text articles excluded, with reasons
(n= 5)
Studies included in the systematic review
(n= 59) IdentificationScreeningEligibilityIncluded
Figure 1. PRISMA flow diagram of the literature search process.
3.1. Study Characteristics
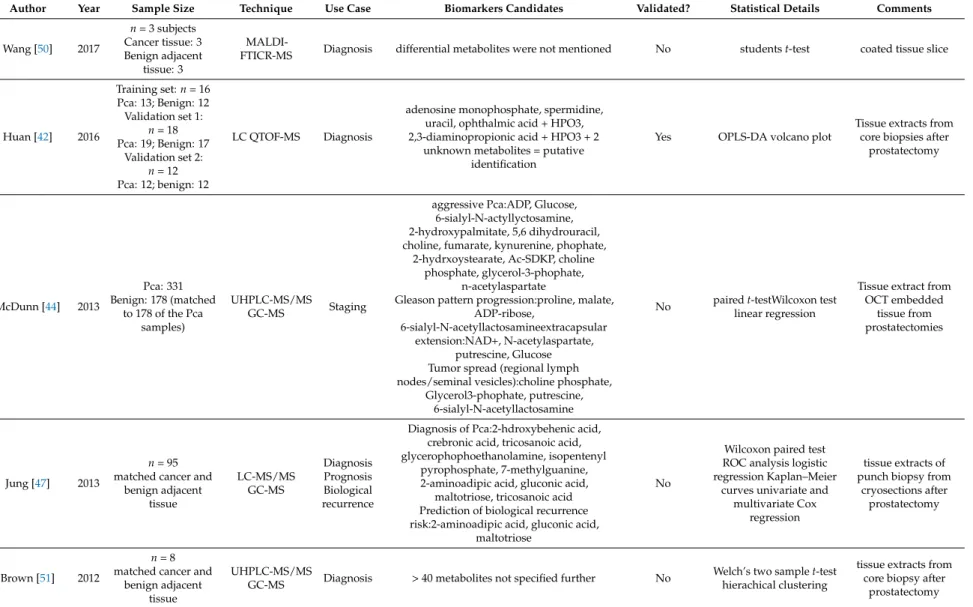
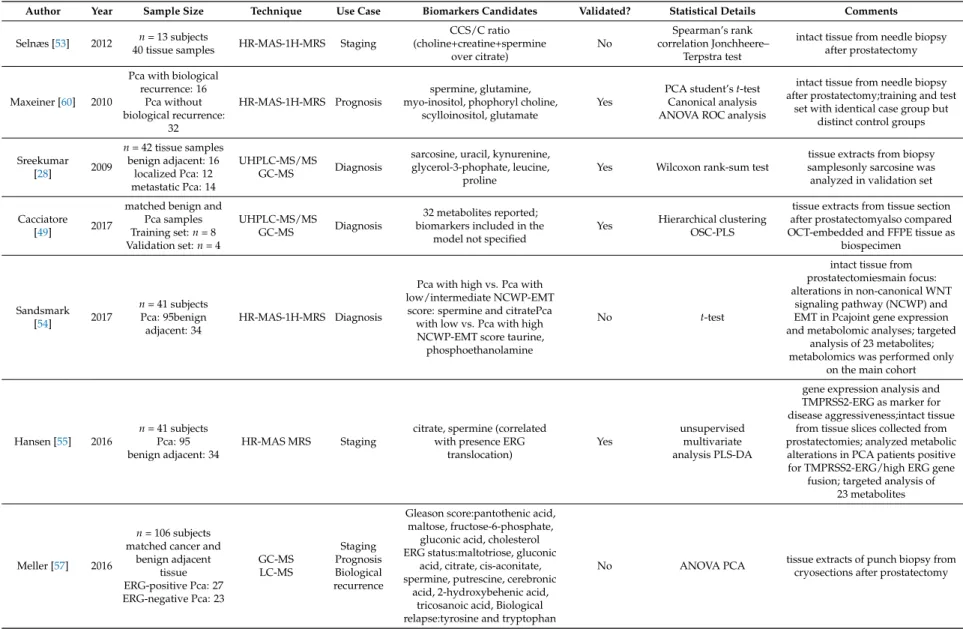
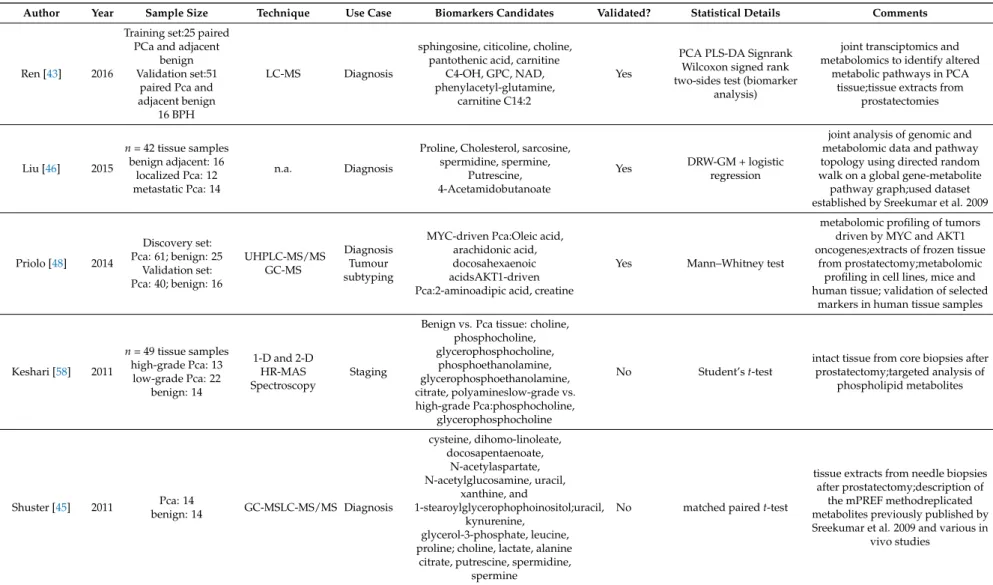
Of all the 59 selected reports, a total of 43 studies were conducted on only one bio specimen as follows: 14 studies were conducted on blood samples, 10 on urine samples and 19 on tissue samples.
Eight studies have used more than one of the aforementioned bio specimen in their analysis and thus were reported in more than one table. nine reports analysed other types of biospecimens, such as seminal fluid, or did in vivo magnetic resonance spectroscopy imaging (MRSI), i.e., spectroscopic analysis of the prostate in situ using MRI scanners.
3.2. Outcomes
3.2.1. Blood Based Biomarkers
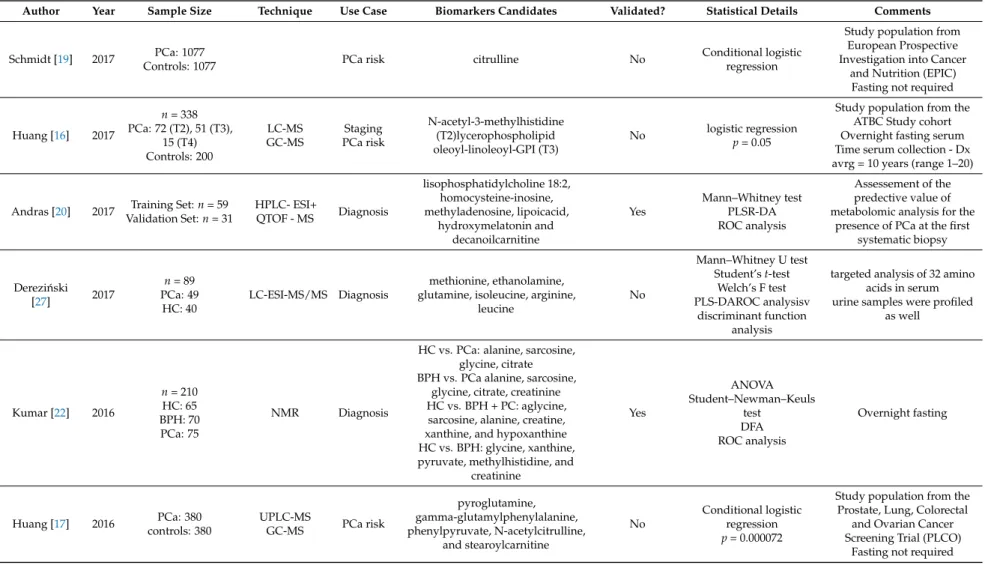
In total, seventeen metabolomics studies were conducted on blood samples (Table 1). Six publications attempted to identify biomarkers of prostate cancer risk. Three of the six studies were nested within the Alpha-Tocopherol, Beta-Carotene Cancer Prevention Study (ATBC) [14–16], while one was part of the Prostate, Lung, Colorectal, and Ovarian Cancer Screening Trial (PLCO) [17], another embedded in the JANUS cohort [18] with a further study incorporated within the European Prospective Investigation into Cancer and Nutrition (EPIC) [19]. Ten studies focused on the assessment of biomarkers for diagnostic and/or staging purposes. Only one study focused on the identification of prognostic metabolites. Likewise, only one study reported on biomarkers for therapy prediction was found.
Blood Biomarkers Associated with PCa Risk
The ATBC study was a cancer prevention trial that enrolled 29,133 Caucasian male smokers
from Finland. These men were aged between 50–69 years at baseline, smoked at least 5 cigarettes
per day, and were assigned to one of four distinct intervention groups. The aim of the study was to
examine whether the vitamin supplementation with alpha-tocopherol and beta-carotene, either alone
or in combination, would prevent lung and other cancers compared to Placebo. All metabolomics
studies within the ATBC cohort were conducted by Demetrius Albanes and co-workers with the aim
to identify metabolomic profiles associated with the risk of prostate cancer up to 20 years prior to
diagnosis. The group applied ultrahigh performance liquid chromatography/mass spectrometry (LC-MS) and gas chromatography/mass spectrometry (GC-MS) for metabolic profiling of fasted serum samples collected at baseline. In their first study, Mondul et al. analysed sera from 148 participants [14].
The case group comprised 74 patients who developed PCa up to 23 years after blood collection, while 74 participants without PCa diagnosis in the same period were selected to match the collection date and age to serve as controls. The authors found a significant (corrected p < 0.000119) inverse association of 1 stearoylglycerol with overall prostate cancer risk (Odds ratio 0.34, p = 0.00006). Additional biomarker candidates identified included glycerol and alpha-ketoglutarate, but their associations did not reach statistical significance when corrected for multiple comparisons.
In their second study within the ATBC cohort [15], the authors repeated the metabolomics analysis using an additional set of 200 confirmed cases of PCa and 200 controls that were independent of the sample set of the first study. Notably, they were unable to replicate the association of 1-stearoylglycerol and glycerol with increased PCa risk. Additionally none of the detected metabolites achieved statistical significance after correction for multiple testing (p = 0.00008). Nevertheless, strong risk associations between molecules involved in energy and lipid metabolism and risk of aggressive cancer were observed. In addition, the previously reported association between alpha-ketoglutarate and risk of aggressive prostate cancer (defined as TNM stage III-IV, AJCC stage ≥ 3, or Gleason ≥ 8) was confirmed with a significance level of p = 0.00008 (Odds ratio = 0.69, p = 0.02). In addition, the authors identified citrate, a large number of glycerophospholipids, including oleoyl-linoleoyl-glycerophosphoinositol, and long chain fatty acids (LCFA) among the top metabolites associated with risk of aggressive Pca.
Most of these biomarkers were inversely related to aggressive PCa risk, with inositol-1-phosphate, a precursor of myo-inositol, showing the strongest association (Odds ratio = 0.56, p = 0.002). When stratified by median time from blood collection to diagnosis, distinct metabolites were found to be associated with risk of aggressive PCa. Furthermore, high risk of aggressive Pca was associated with elevated levels of thyroxine and trimethylamine N-oxide (TMAO), a liver metabolite biosynthesised from trimethylamine which in turn is produced from dietary phosphatidylcholines and carnitine by gut bacteria. In contrast, the pyrimidine-nucleoside 2
0-deoxyuridine and adenosine 5
0-monophosphate, a constituent of ribonucleic acid, appeared related to more indolent forms of PCa.
Using the same sample set, the authors performed a secondary analysis in order to test, whether men diagnosed with ≥ T2 tumours exhibit different metabolite profiles up to 20 years prior to clinical diagnosis [16]. Compared to controls, qualitative differences in metabolite profiles were found for tumour groups and various metabolites were reported; however, most of them did not reach statistical significance after correction for multiple testing. Solely the glycerophospholipid oleoyl-linoleoyl-glycerophosphoinositol already identified in the primary analysis turned out to be significantly associated with subsequent diagnosis of locally advanced (T3) PCa (Odds ratio = 0.49, p = 0.000017), but surprisingly not with later diagnosis of T4 disease. Apart from that, non-significantly elevated serum levels of metabolites in histidine metabolism, including the nucleoside 2’-deoxyuridine also found in the primary analysis, and an inverse association with certain glycerophospholipids were found in men with T2 tumours. Men with T3 prostate cancers showed increased sphingolipids and as well as lower glycerophospholipid signals. Men with a later diagnosis of T4 tumour exhibited elevated signals for secondary bile acid lipids, sex steroids and caffeine-related metabolites, while the carboxylic acids fumarate and citrate were decreased in this group compared to controls. Moreover, the authors found consistent lower levels of glycerophospholipids stearoyl-arachidonoyl-glycerophospho-ethanolamine (GPE) and stearoyl-linoleoyl-GPE as well as a positive signal for euricoyl sphingomyelin in T2 and T3, but not in T4 cases. Serum levels of the histidine metabolite 4-imidazoleacetate and the secondary bile acid glycolithocholate sulfate were found to be elevated across all tumour stages.
The same group performed metabolomics profiling using serum samples from the PLCO trial [17],
which was a large randomized-controlled trial to evaluate the efficacy of screening methods for
different cancers including PCa. Participants were enrolled from 10 centres in the USA between 1993
and 2001 and randomly assigned to either the screening or non-screening arm. From the screening arm, non-fasting serum samples and data on serum total PSA measurement and DRE examination (in contrast to the ATBC studies) were available for analysis. 380 participants with PCa diagnosis during the post-screening trial period, i.e., 4.4–17.0 years after baseline, and 380 controls matched by age, race, study centre, study year, and date of blood collection were included. Numerous metabolites were reported to be associated with PCa risk, but none demonstrated statistical significance following correction for multiple comparisons. They observed an inverse association with overall risk of PCa and risk of aggressive PCa (T3, T4 or Gleason ≥ 8) for several amino acids and their derivatives, while stearoylcarnitine was positively associated. Alpha-tocopherol, primary bile acid, and steroid hormone metabolites were inversely associated with risk of indolent PCa. Positive associations of lipids with overall risk of PCa as well as risk of aggressive PCa were also reported and were inconsistent with findings in the ATBC cohort. Notably, alpha-ketoglutarate and citrate did not replicate and had even opposite regulation in the PLCO cohort. Moreover, previous associations with aggressive PCa observed for e.g., thyroxine and TMAO were not confirmed. However, the association of 2’-deoxyuridine with overall prostate cancer risk could be replicated, as well as the associations of the glycerophospholipid 1-palmitoleoyl-2-linoleoyl-GPC and the bile acid tauro-beta-muricholate.
The JANUS study conducted by de Vogel and colleagues investigated the association of sarcosine and metabolites along the choline oxidation pathway, i.e., from betaine down to serine, with risk of incident PCa [18]. For this study, serum samples were analysed from 317,000 Norwegian men either participating in health screening surveys or blood donation. LC-MS and GC-MS were used for targeted analysis of six distinct metabolites in 3000 serum samples from patients with incident PCa with a mean time to diagnosis of 15.6 years. 3000 control samples were available, being matched by age, date of serum sampling, and county of residence. The results suggested that men with high serum sarcosine (p = 0.03) or glycine (p = 0.07) levels have modestly reduced PCa risk, whereas serum betaine, dimethylglycine, and serine were not associated with prostate cancer risk. However, the association of sarcosine and glycine only held true when folate concentration was above 13.7 nmol/L. In addition, a high glycine/serine ratio was related to a decreased PCa risk (p = 0.001), while other metabolite ratios containing betaine, dimethylglycine, sarcosine or glycine were not.
Schmidt et al. reported various metabolites from several metabolite classes associated with risk of PCa, advanced stage disease and death from PCa using blood samples from the EPIC study [19].
This trial was a European multi-center cohort study aiming to examine how diet is associated with cancer risk. Case group comprised 1077 men diagnosed with PCa after blood collection matched to 1077 controls by the study center, length of follow-up, age, time of day, and fasting status at blood collection.
Using a targeted mass spectrometry approach, 122 metabolites were evaluated. Their strongest findings were an inverse association of citrulline with overall risk of prostate cancer diagnosis within the first five years of follow-up, whereas 12 different glycerophospholipids were inversely related to advanced stage disease (TNM stage T3, T4 and/or N1-3 and/or M1). All these associations were significant after correcting for multiple testing. In addition, conventionally significant associations (p < 0.05) were seen for three acylcarnitines, two amino acids and a glycerophospholipid with overall risk of prostate cancer, for 29 metabolites including 20 different glycerophospholipids with risk of advanced disease, for 13 metabolites with risk of aggressive PCa (T4 and/or N1-3 and /or M1 or Gleason ≥ 8), and for seven metabolites with death from prostate cancer. However, none of these markers have been validated in an independent sample set.
Blood Biomarkers for Diagnosis and Staging of PCa
Andras and colleagues published a study that aimed to identify a metabolomic score for PCa
using 90 serum samples from patients who were suspected to have PCa and underwent prostate
biopsy [20]. In contrast to most other studies, where specimens were preserved at − 80
◦C, serum
was stored at − 20
◦C. The data set was split into a training/discovery set (n = 59) and a validation
set (n = 31), with 25 patients suffering from benign prostatic hyperplasia (BPH) and 34 patients
diagnosed with PCa in the training set and 17 patients with BPH and 14 PCa patients in the validation group. High-performance liquid chromatography coupled to electrospray ionization quadropole Time-of-Flight mass spectrometry (HPLC-ESI-QTOF MS) was performed for a targeted analysis of 18 amino acids and 33 metabolites. No amino acid was significantly different between PCa and BPH patients in the training cohort (p < 0.05). However, several of the 33 metabolites were significantly altered, including glycerol-3-phosphate, glycerophosphocholine, distinct lysophosphatidylcholines, retinoic acid, and prostaglandin. Due to a high grade of multicollinearity between metabolites, six metabolites with p < 0.02 and the lowest correlations with other compounds were selected for partial least square regression. The resulting score incorporating lysophosphatidylcholine 18:2, homocysteine-inosine, methyladenosine, lipoic acid, hydroxymelatonin and decanoilcarnitine as markers showed an area under the curve (AUC) value of 0.779 (p < 0.001) with a sensitivity of 74% and a specificity of 76% for discriminating PCa from BPH in the training set. In the validation set, the score distinguished PCa from BPH with a sensitivity of 88% and specificity of 60%. Including PSA to the metabolomic score did not significantly increase its AUC-value.
Kumar et al. conducted two metabolomics studies using NMR spectroscopy to identify diagnostic PCa biomarkers in serum [21,22]. Both studies lacked independent validation cohorts, but some results of the first report were replicated in their second study. In their first publication [21], the group analysed 102 serum samples obtained from 70 PCa patients (30 harboured high grade (Gleason ≥ 8) and 40 low grade (Gleason ≤ 7) PCa) and 32 healthy controls (HC) after an overnight fast. Bin-based orthogonal projections to latent structures-discriminant analysis (OPLS-DA) models established on 70% of the data as training set. These models yielded accuracies of 90%, 95%, 94%, and 99% for discriminating between HC and PCa patients, HC and low-grade PCa, HC and high-grade PCa, and low grade and high grade cancer, respectively, in the test set (remaining 30% of data). Several statistical approaches, including ANOVA followed by a post hoc Student–Newman–Keuls multiple comparisons test, were applied to identify important metabolites. Alanine, glycine, pyruvate, and sarcosine were found to be statistically significant (p < 0.01) and discriminated between HC and PCa samples with an AUC of 0.966 in receiver operating characteristic (ROC) analysis following calculation of discriminant predicted probability scores. While the combination of alanine, glycine, and sarcosine provided the highest AUC (0.970) for differentiating HC and low grade tumours, glycine and sarcosine showed best discriminative power when comparing HC to high-grade tumours (AUC 0.997). Alanine, pyruvate, and glycine were able to distinguish low grade from high grade cancers with an AUC value of 0.978.
Unfortunately, it is unclear whether the reported performances in ROC analyses refer to the whole data set or the test set only.
In their second study [22], the same authors profiled 210 fasted serum samples obtained from
65 HC, 70 BPH patients and 75 PCa patients. In contrast to their previous study, proteins and
lipoproteins were removed using centrifugal filtration prior to NMR analysis. Univariate analysis
(ANOVA followed by Student–Newman–Keuls test) of 52 assigned compounds revealed 13 metabolites
that were significantly altered between the three patient groups. These 13 markers were used for
multivariate linear discriminant function analysis. Based on this, alanine, sarcosine, and glycine
were replicated as markers for discriminating HC from PCa patients and, together with citrate,
correctly classified 97% of patients. The same four metabolites in combination with creatinine
showed an accuracy of 88% when comparing PCa cases to BPH. Moreover, glycine, sarcosine, alanine,
creatine, xanthine, and hypoxanthine appeared important markers to distinguish HC from BPH and
PCa patients (86%). Glycine, xanthine, pyruvate, methylhistidine, and creatinine were important
metabolites for distinguishing HC from BPH (86%). Metabolomic patterns performed better than
clinical parameters (PSA, digital rectal exam, and transrectal ultrasound) in each classification category
and consistently showed higher AUC values. When using 75% of the data set as training set and the
remaining 25% of samples as test set, categorizations of 83%, 82%, 94% and 89% were achieved in the
test set for HC vs. BPH and PCa, HC vs. BPH, HC vs. PCa, and BPH vs. PCa, respectively.
Tessem and co-workers explored the value of combined serum and plasma metabolomics analysis to differentiate 29 PCa patients from 21 control patients with BPH using various techniques [23].
Serum samples were profiled by NMR and GC and identified 28 metabolites, 105 lipoprotein-related variables, and 34 fatty acids. In addition, LC-MS/MS contributed 142 metabolites from plasma samples for analysis. Although several metabolites from the distinct analyses were conventionally significant (p < 0.05), none reached statistical significance after correction for multiple testing (Benjamini Hochberg correction, q > 0.05). Using OPLS-DA, only data acquired by NMR and MS resulted in significant classification models. A combination of 14 and 12 metabolites from NMR and MS gave best classification results and their discriminative power was assessed in ROC analyses.
Among these 26 markers, the carnitine derivatives decanoylcarnitine (C10:0), tetradecenoylcarnitine (C14:1), octanoylcarnitine (C8) as well as the sulfur compound dimethylsulfone, and the amino acids phenylalanine and lysine were all increased in PCa and of high importance for classification.
The phosphatidylcholine diacyl C34:4, and lipid signals from (CH2)n -CH2-CH2-CO were increased BPH and also contributed substantially to separation of BPH and PCa groups.
Fan et al. applied random forests to identify metabolite alterations in serum for the detection and the staging of PCa [24]. They reported nine metabolites identified using NMR analysis in serum samples from 42 patients diagnosed with PCa (20 with Gleason 5; 22 with Gleason 7) and 14 men with BPH and PSA follow up for 4–5 years were available. Among the NMR-detected metabolites, only glutamate and formate were significantly elevated in PCa compared to BPH patients (ANOVA, p < 0.05). AUC values calculated using random forests with 10-fold cross-validation were 0.876 and 0.532 for distinguishing BPH from PCa and Gleason 5 from Gleason 7, respectively. However, the authors did not mention the most important NMR metabolites for these classifications.
Osl et al. developed a novel feature selection algorithm termed associative voting for identifying biomarker candidates in PCa [25]. Flow injection analysis-MS/MS and LC-MS/MS were applied to serum samples obtained from 114 men screened negative for PCa and 206 patients diagnosed with PCa for targeted analysis of 112 metabolites. Among the PCa patients, 121 men had low grade PCa (Gleason 6) and 85 were diagnosed with high grade (Gleason ≥ 8) PCa. The new algorithm outperformed existing feature selection methods with respect to AUC values in most comparisons of patient groups. For distinguishing PCa from controls, two lysophosphatidylcholines, C16:0 PC and C18:0 PC as well as serotonine, aspartate, and ornithine were top-ranked metabolites. Notably, the two lysophosphatidylcholines, ornithine, and serotonin were selected by at least one of the existing feature selection methods, while aspartate was highly ranked in all three methods tested. No reliable marker candidates were found for discriminating low from high grade tumours.
Zang et al. developed a metabolite-based in vitro diagnostic multivariate index assay (IVDMIA) using serum samples from a cohort of 64 PCa patients and 50 age-matched healthy controls [26].
Metabolomic analysis was performed using UPLC-MS which yielded a total of 480 features. The data set was split into a training (70%) and a test set (30%). An optimum set of 40 discriminative features identified by support vector machine classified PCa patients and healthy controls with an average accuracy of 93% from 10 distinct iterations. Likewise, a good separation between these groups was achieved when principal component analysis as an unsupervised approach was applied to the best 40 features. Additional support vector machine models were built using smaller sub-panels of the 40 metabolites. When only 13 features that were confidently assigned to metabolites were used for modelling, PCa and controls were still distinguished with an accuracy of 85%. Several differential metabolites were identified as fatty acids, amino acids, lysophospholipids, and bile acids.
Derezi ´nski and colleagues performed a targeted analysis of amino acids (proteinogenic and
non-proteinogenic) in serum and urine samples to identify potential biomarkers of PCa [27]. By using
LC-ESI-MS/MS, they profiled both urine and serum samples from 49 patients diagnosed with PCa
and 40 healthy controls without cancer or chronic diseases. In serum, 32 amino acids were detectable
in all 89 samples. In univariate analysis, 18 amino acids were significantly different (p < 0.05) between
serum samples from PCa and those from control patients with 14 amino acids being reduced in PCa
patients. These included methionine, ethanolamine, glutamine, isoleucine, arginine, and leucine (all p < 0.00002), all of which had AUC values above 0.75 in univariate ROC analyses. Sarcosine (p = 0.006), 3-methylhistidine (p = 0.008), β-alanine (p = 0.013), and aspartate (0.034) were detected at higher levels in PCa patients but showed higher p-values and poorer performance in ROC analyses.
Methionine, sarcosine, and 3-methylhistidine, together with serine and proline, were the most significant metabolites in multivariate PLS-DA according to their VIP scores. The same metabolites were also most frequently found in models built on two-thirds of the dataset and validated in the remaining third of samples in multivariate ROC analyses based on a Monte Carlo cross-validation approach. In a stepwise discriminant function analysis, sensitivity of 68% and specificity of 100%
were observed for classifying PCa and control patients. Among the most important metabolites in serum, ethanolamine and arginine were also reported as potential biomarkers in urine (details see urine section below).
In addition to the above mentioned publications, we found two studies that analysed blood samples but mainly focused on data generated using other biospecimens. In 2009, Sreekumar and colleagues profiled tissue, blood, and urine samples using GC-MS and LC-MS [28]. However, they focused on their tissue data, since they detected most robust differences using this specimen type, and did not report details of their metabolomics plasma profiles (for details see tissue section). The goal of the other report was to discover biomarkers for metastatic PCa [29]. The main work was done using GC-TOF-MS of tissue samples from bone metastases and primary tumours. However, plasma samples derived from patients with high-risk tumours with (M1, n = 7) and without bone metastases (M0, n = 6) and from patients with benign prostates (n = 17) were analysed as well. Using OPLS-DA, ANOVA and Mann–Whitney U-test, seven of 27 identified metabolites were significantly altered, including pseudouridine (an isomer of the nucleoside uridine), creatinine, glucose, glutamate, taurine, phenylalanine, and stearate, the last four of which were also identified as markers of metastatic PCa in bone tissue. In addition, sarcosine was specifically measured using a targeted approach, but no significant differences in sarcosine levels were observed when comparing patients with PCa to patients with benign prostate biopsies or metastatic PCa to non-metastatic PCa.
Blood Biomarkers for Therapy Prediction and Prognosis in PCa
The only study focusing on blood biomarkers for predicting treatment response was conducted by Huang and colleagues and published in 2014 [30]. They analysed serum from 18 patients with newly diagnosed PCa (untreated group) and 18 healthy controls (control group) by LC-MS. In addition, serum samples collected from 36 PCa patients who received androgen deprivation therapy (ADT) at the time of CRPC (castration-resistant prostate cancer) diagnosis were examined. Among the treated PCa patients, 18 responded to treatment for less than one year (poor response group) while 18 were sensitive for more than two years (good response group). Based on OPLS-DA, the authors selected 100 and 60 ions showing the largest significant differences (VI p-values > 1.5 and p < 0.05) between healthy controls and PCa groups and between poor and good responders to ADT, respectively. When comparing these 160 features, 20 ions were common in the two OPLS models and had less than 20%
relative standard deviations in each group. Tandem MS identified two bile acids deoxycholic acid and glycochenodeoxycholate, the omega-3 fatty acid docosapentaenoic acid (all involved in cholesterol metabolism), tryptophan, the omega-6 fatty acid arachidonic acid, the nucleotide deoxycytidine triphosphate, and pyridinoline (released from cross-linked collagen fibers during bone loss) as potential biomarkers for predicting response to ADT. All these markers were altered in PCa compared to healthy controls. However, their serum levels in patients who responded to ADT reverted close to the levels observed for the control group. This suggests that serum levels of these metabolites are potential markers for the early response to endocrine therapy.
Like in the field of therapy prediction, only one of the identified studies dealt with prognostic
biomarkers in blood [31]. In their work published in 2011, Stabler and colleagues used GC-MS for
targeted analysis of metabolites of the methionine metabolism, including sarcosine, dimethylglycine,
methionine, homocysteine, cystationine, cysteine, methylmalonic acid and methylcitrate, in serum with the aim to identify markers that predict biochemical recurrence after radical prostatectomy. To this end, they compared pre-surgical serum samples from 30 patients without biochemical recurrence for at least five years after prostatectomy (“recurrence-free”) to pre-surgical sera from 28 patients with biochemical recurrence within two years (“recurrent”). Among the metabolites analysed, only homocysteine, cystathionine, and cysteine were significantly different (p < 0.001) between the two populations in Wilcoxon rank sum tests. Each of these metabolites was able to rapidly separate recurrent from recurrence-free patients in Kaplan–Meier curves with cysteine being the most discriminating marker. The same three markers were also independent predictors of recurrence-free survival in Cox proportional hazard regression models. Likewise, these metabolites were the top predictors for recurrence in multiple logistic regression models. The addition of serum homocysteine to a basic model with serum PSA and Gleason score resulted in the greatest improvement in discriminating between recurrence-free and recurrent patients (p = 0.0007). The AUC values for models including one of the markers were similar (AUC = 0.86) and superior to the basic model with an AUC of 0.81.
Interestingly, when urine samples were analysed, only cysteine along with sarcosine (p = 0.03), was
found to be significantly different (p = 0.007) between the two groups (see below), while homocysteine
and cystathionine were not.
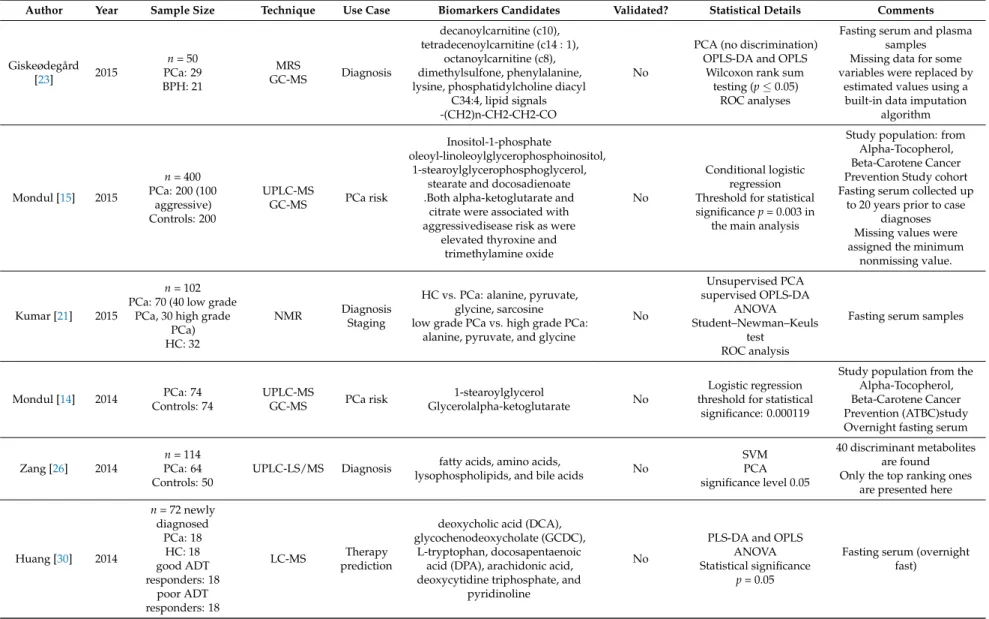
Table 1. Results of the metabolomics studies conducted on blood samples.
Author Year Sample Size Technique Use Case Biomarkers Candidates Validated? Statistical Details Comments
Schmidt [19] 2017 PCa: 1077
Controls: 1077 PCa risk citrulline No Conditional logistic
regression
Study population from European Prospective Investigation into Cancer
and Nutrition (EPIC) Fasting not required
Huang [16] 2017
n= 338 PCa: 72 (T2), 51 (T3),
15 (T4) Controls: 200
LC-MS GC-MS
Staging PCa risk
N-acetyl-3-methylhistidine (T2)lycerophospholipid oleoyl-linoleoyl-GPI (T3)
No logistic regression p= 0.05
Study population from the ATBC Study cohort Overnight fasting serum Time serum collection - Dx avrg = 10 years (range 1–20)
Andras [20] 2017 Training Set:n= 59 Validation Set:n= 31
HPLC- ESI+
QTOF - MS Diagnosis
lisophosphatidylcholine 18:2, homocysteine-inosine, methyladenosine, lipoicacid,
hydroxymelatonin and decanoilcarnitine
Yes
Mann–Whitney test PLSR-DA ROC analysis
Assessement of the predective value of metabolomic analysis for the
presence of PCa at the first systematic biopsy
Derezi ´nski
[27] 2017
n= 89 PCa: 49 HC: 40
LC-ESI-MS/MS Diagnosis
methionine, ethanolamine, glutamine, isoleucine, arginine,
leucine
No
Mann–Whitney U test Student’st-test
Welch’s F test PLS-DAROC analysisv
discriminant function analysis
targeted analysis of 32 amino acids in serum urine samples were profiled
as well
Kumar [22] 2016
n= 210 HC: 65 BPH: 70 PCa: 75
NMR Diagnosis
HC vs. PCa: alanine, sarcosine, glycine, citrate BPH vs. PCa alanine, sarcosine,
glycine, citrate, creatinine HC vs. BPH + PC: aglycine,
sarcosine, alanine, creatine, xanthine, and hypoxanthine HC vs. BPH: glycine, xanthine, pyruvate, methylhistidine, and
creatinine
Yes
ANOVA Student–Newman–Keuls
test DFA ROC analysis
Overnight fasting
Huang [17] 2016 PCa: 380 controls: 380
UPLC-MS
GC-MS PCa risk
pyroglutamine, gamma-glutamylphenylalanine, phenylpyruvate, N-acetylcitrulline,
and stearoylcarnitine
No
Conditional logistic regression p= 0.000072
Study population from the Prostate, Lung, Colorectal
and Ovarian Cancer Screening Trial (PLCO)
Fasting not required
Table 1. Cont.
Author Year Sample Size Technique Use Case Biomarkers Candidates Validated? Statistical Details Comments
Giskeødegård
[23] 2015
n= 50 PCa: 29 BPH: 21
MRS
GC-MS Diagnosis
decanoylcarnitine (c10), tetradecenoylcarnitine (c14 : 1),
octanoylcarnitine (c8), dimethylsulfone, phenylalanine, lysine, phosphatidylcholine diacyl
C34:4, lipid signals -(CH2)n-CH2-CH2-CO
No
PCA (no discrimination) OPLS-DA and OPLS
Wilcoxon rank sum testing (p≤0.05)
ROC analyses
Fasting serum and plasma samples Missing data for some variables were replaced by
estimated values using a built-in data imputation
algorithm
Mondul [15] 2015
n= 400 PCa: 200 (100
aggressive) Controls: 200
UPLC-MS
GC-MS PCa risk
Inositol-1-phosphate
oleoyl-linoleoylglycerophosphoinositol, 1-stearoylglycerophosphoglycerol,
stearate and docosadienoate .Both alpha-ketoglutarate and
citrate were associated with aggressivedisease risk as were
elevated thyroxine and trimethylamine oxide
No
Conditional logistic regression Threshold for statistical significancep= 0.003 in
the main analysis
Study population: from Alpha-Tocopherol, Beta-Carotene Cancer Prevention Study cohort Fasting serum collected up
to 20 years prior to case diagnoses Missing values were assigned the minimum
nonmissing value.
Kumar [21] 2015
n= 102 PCa: 70 (40 low grade
PCa, 30 high grade PCa) HC: 32
NMR Diagnosis
Staging
HC vs. PCa: alanine, pyruvate, glycine, sarcosine low grade PCa vs. high grade PCa:
alanine, pyruvate, and glycine
No
Unsupervised PCA supervised OPLS-DA
ANOVA Student–Newman–Keuls
test ROC analysis
Fasting serum samples
Mondul [14] 2014 PCa: 74 Controls: 74
UPLC-MS
GC-MS PCa risk 1-stearoylglycerol
Glycerolalpha-ketoglutarate No
Logistic regression threshold for statistical
significance: 0.000119
Study population from the Alpha-Tocopherol, Beta-Carotene Cancer Prevention (ATBC)study Overnight fasting serum
Zang [26] 2014
n= 114 PCa: 64 Controls: 50
UPLC-LS/MS Diagnosis fatty acids, amino acids,
lysophospholipids, and bile acids No
SVM PCA significance level 0.05
40 discriminant metabolites are found Only the top ranking ones
are presented here
Huang [30] 2014
n= 72 newly diagnosed
PCa: 18 HC: 18 good ADT responders: 18
poor ADT responders: 18
LC-MS Therapy
prediction
deoxycholic acid (DCA), glycochenodeoxycholate (GCDC),
L-tryptophan, docosapentaenoic acid (DPA), arachidonic acid, deoxycytidine triphosphate, and
pyridinoline
No
PLS-DA and OPLS ANOVA Statistical significance
p= 0.05
Fasting serum (overnight fast)
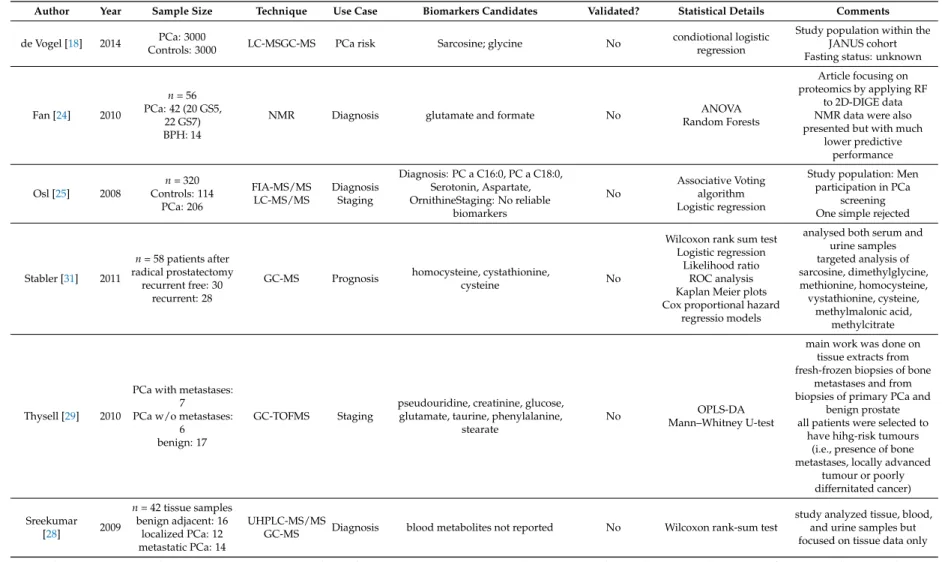
Table 1. Cont.
Author Year Sample Size Technique Use Case Biomarkers Candidates Validated? Statistical Details Comments de Vogel [18] 2014 PCa: 3000
Controls: 3000 LC-MSGC-MS PCa risk Sarcosine; glycine No condiotional logistic
regression
Study population within the JANUS cohort Fasting status: unknown
Fan [24] 2010
n= 56 PCa: 42 (20 GS5,
22 GS7) BPH: 14
NMR Diagnosis glutamate and formate No ANOVA
Random Forests
Article focusing on proteomics by applying RF
to 2D-DIGE data NMR data were also presented but with much
lower predictive performance
Osl [25] 2008
n= 320 Controls: 114
PCa: 206
FIA-MS/MS LC-MS/MS
Diagnosis Staging
Diagnosis: PC a C16:0, PC a C18:0, Serotonin, Aspartate, OrnithineStaging: No reliable
biomarkers
No
Associative Voting algorithm Logistic regression
Study population: Men participation in PCa
screening One simple rejected
Stabler [31] 2011
n= 58 patients after radical prostatectomy
recurrent free: 30 recurrent: 28
GC-MS Prognosis homocysteine, cystathionine,
cysteine No
Wilcoxon rank sum test Logistic regression
Likelihood ratio ROC analysis Kaplan Meier plots Cox proportional hazard
regressio models
analysed both serum and urine samples targeted analysis of sarcosine, dimethylglycine, methionine, homocysteine, vystathionine, cysteine,
methylmalonic acid, methylcitrate
Thysell [29] 2010
PCa with metastases:
7 PCa w/o metastases:
6 benign: 17
GC-TOFMS Staging
pseudouridine, creatinine, glucose, glutamate, taurine, phenylalanine,
stearate
No OPLS-DA
Mann–Whitney U-test
main work was done on tissue extracts from fresh-frozen biopsies of bone
metastases and from biopsies of primary PCa and
benign prostate all patients were selected to
have hihg-risk tumours (i.e., presence of bone metastases, locally advanced
tumour or poorly differnitated cancer)
Sreekumar
[28] 2009
n= 42 tissue samples benign adjacent: 16
localized PCa: 12 metastatic PCa: 14
UHPLC-MS/MS
GC-MS Diagnosis blood metabolites not reported No Wilcoxon rank-sum test
study analyzed tissue, blood, and urine samples but focused on tissue data only ADT: androgen deprivation therapy; ANOVA: one-way analysis of variance; avrg: average; BPH: benign prostate hyperplasia; DFA: discriminant function analysis; Dx: diagnosis;
ESI: electrospray ionization; FIA: flow injection analysis; GS: Gleason score; GC: gas chromatography; HC: healthy control; (HP/UP)LC: (high performance/ultra performance) liquid chromatography; MRS: magnetic resonance spectroscopy; MS: mass spectrometry; MS/MS tandem mass spectrometry; NMR: nuclear magnetic resonance; OPLS-DA: orthogonal projections to latent structures-discriminant analysis; (Q)TOF: (quadrupole) time of flight; PCa: prostate cancer; PCA: principal component analysis; PLS(R)-DA: partial least squares (regression)-discriminant analysis; RF: random forests; ROC: receiver-operating characteristic; SVM: support vector machine; T2,T3,T4: tumor stages according to TNM classification.
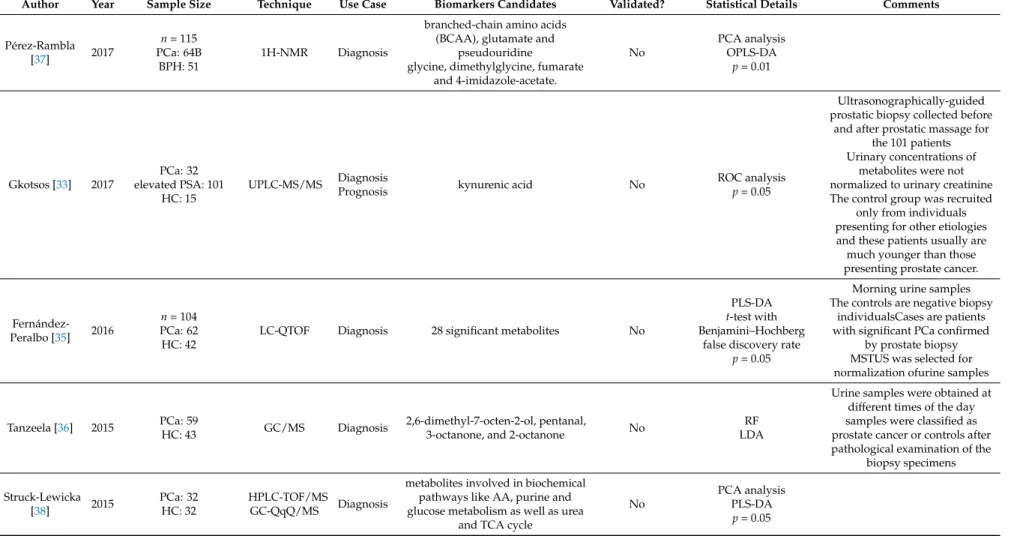
3.2.2. Urine Based Biomarkers
Nine studies used urine samples for metabolomics profiling (Table 2). Eight papers reported discriminating metabolites for diagnostic purposes. Two of them also searched for metabolites related to diseases prognosis. Only one study attempted to identify predictive metabolites.
Urine Biomarkers for Diagnosis and Prognosis of PCa
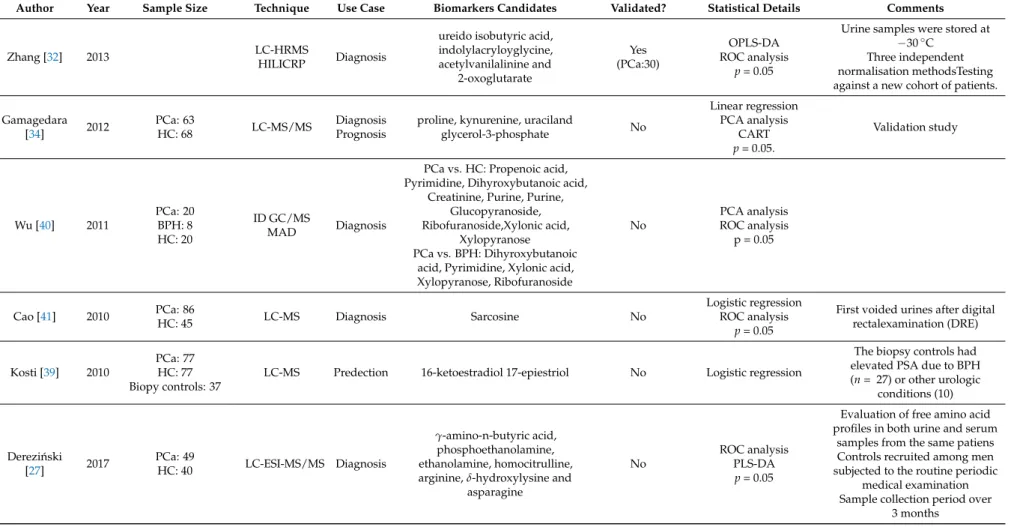
Zhang et al. reported urinary alterations associated with PCa validated in a partially independent cohort [32]. They introduced a protocol based on the use of LC-MS with orthogonal hydrophilic interaction (HILIC) and reversed phase (RP) liquid chromatography methodes. The established protocol was used for the analysis of the urinary metabolome and was then evaluated as a diagnostic tool for PCa. Thirty PCa subjects and 30 controls were included. The authors tested different normalization methods (against creatinine levels, osmolality or MS total useful signals/MSTUS) compared to un-normalised data. Orthogonal partial least square discriminant analysis (OPLS-DA) modelling was applied to 25 PCa subjects and 25 controls as a training set while the remaining five cases and controls served as a test set. The discriminative power was higher with creatinine and MSTUS normalisation compared to osmolality and un-normalised data. Thirty additional PCa patients from a different geographic region were compared to the already used control samples using creatinine normalisation. Fourteen metabolites were significantly (p < 0.05) altered and four of them were identified as ureido isobutyric acid (an intermediate in the thymine catabolism), indolylacryloyglycine (a compound derived from dietary tryptophan or indole compounds), acetylvanilalinine (a catecholamine metabolite) and 2-oxoglutarate (also called alpha ketoglutarate).
The four identified biomarkers had an AUC value of 0.90 which was comparable to the use of the PSA testing (AUC at 0.94). Gkostos et al. measured sarcosine, uracil and kynurenic acid in urine samples of 32 PCa patients prior to radical prostatectomy, 101 patients with increased PSA prior to ultrasonographically guided biopsy. Samples were collected before and after prostatic massage (PM), and 15 healthy volunteers as controls [33]. The objective was to evaluate metabolites as potential biomarkers for PCa detection and progression. The ROC analysis for all participants showed that of the biomarkers, sarcosine (AUC = 0.47) and kynurenic acid (AUC = 0.44) had no diagnostic value.
Uracil (AUC = 0.59) showed the highest diagnostic value but without reaching statistical significance (p = 0.066). Moreover, none of the metabolites detected in pre-PM showed any diagnostic potential in patients undergoing biopsy. In post-PM urine samples, however, kynurenic acid had a significant diagnostic value (AUC = 0.62). ROC curves were used to also investigate the role of the aforementioned metabolites in the monitoring of PCa progression using Gleason score as a cut-off point between high and low aggression. Results from urine samples of all participants did not show any predictive value for sarcosine, kynurenic acid and uracil (p = 0.819, 0.858 and 0.525, respectively).
In a validation study conducted by Gamagedara et al. levels of proline, kynurenine, uracil, and glycerol-3-phosphate were analysed in 126 patients with genitourinary malignancies (PCa and BCa) and were compared to healthy controls (n = 68) having no evidence of malignancy (NEM) [34]. The four metabolites did not exhibit any significant differences (p > 0.005) when comparing PCa to NEM as well as BCa to PCa and NEM. Furthermore, their urine levels were associated neither with tumour grade nor with tumour stage. However, the biomarkers were highly correlated with urinary creatinine levels, suggesting that their occurrence is mainly regulated by renal excretion. The levels of biomarkers in both cancer and normal samples were not correlated to age or PSA.
Fernández-Peralbo et al. performed an untargeted metabolomics analysis of urine from 62 patients with clinically significant PCa and 42 healthy individuals (both groups confirmed by biopsy) [35].
Twenty-eight significant metabolites were reported (unpaired t-test) and used to develop a partial least
squares discriminant analysis model characterized by 88% sensitivity and 93% specificity. The stability
of the model was assessed in a validation set comprising 30% of the entire samples set not used in the
prior training step. Sensitivity and specificity were 63% and 79%, respectively. Several metabolites were
found to contribute to clustering of the PCa patients, such as urea and the purine 7-methylguanine.
In contrast, amino acids, including tyrosine, citrulline and histidine, together with acetylated and methylated amino acids such as acetyllysine, acetylhistidine, dimethyllysine and trimethyllysine were relevant markers in the control group of individuals with a negative biopsy. In another principal component analysis, imidazole lactate, acetylputrescine and dimethylarginine characterized the healthy group, while a heterogeneous group of metabolites including 5-methyldeoxycytidine-5-phosphate, 7-methylguanosine, acetylcitrulline, acetylaspartatylglutamic acid and acetyltaurine supported clustering of the PCa patients group. Derezi ´nski et al. focused on determining urinary amino acids (proteinogenic and non-proteinogenic) profiles as potential biomarkers [27]. Among the 26 amino acids found to be significantly different between PCa and control groups, γ-amino-n-butyric acid, phosphoethanolamine, ethanolamine, homocitrulline, arginine, δ-hydroxylysine, and asparagine showed the lowest p-values (all with p < 0.00002) and AUC values above 0.75 in univariate ROC analyses. A stepwise discriminant function analysis using two-thirds of the samples for training showed a sensitivity and specificity in a test set (remaining third of the samples) of 89% and 73%.
No significant differences in urinary amino acid profiles between patients with different Gleason scores were observed.
Tanzeela et al. investigated volatile organic compounds (VOCs) emanating from urine samples and their ability to discriminate PCa samples (n = 59) from non-cancer ones (n = 43) using random forest (RF) and linear discrimination analysis (LDA) [36]. The diagnostic potential of 2,6-dimethyl-7-octen-2-ol, pentanal, 3-octanone, and 2-octanone were analysed and compared to the diagnostic performance of serum PSA using a repeated double cross validation approach. Serum PSA levels alone were able to classify patients with mean accuracies of 61% and 63% using RF and LDA, respectively. Classification based on the four VOCs, yielded similar mean accuracies of 65%
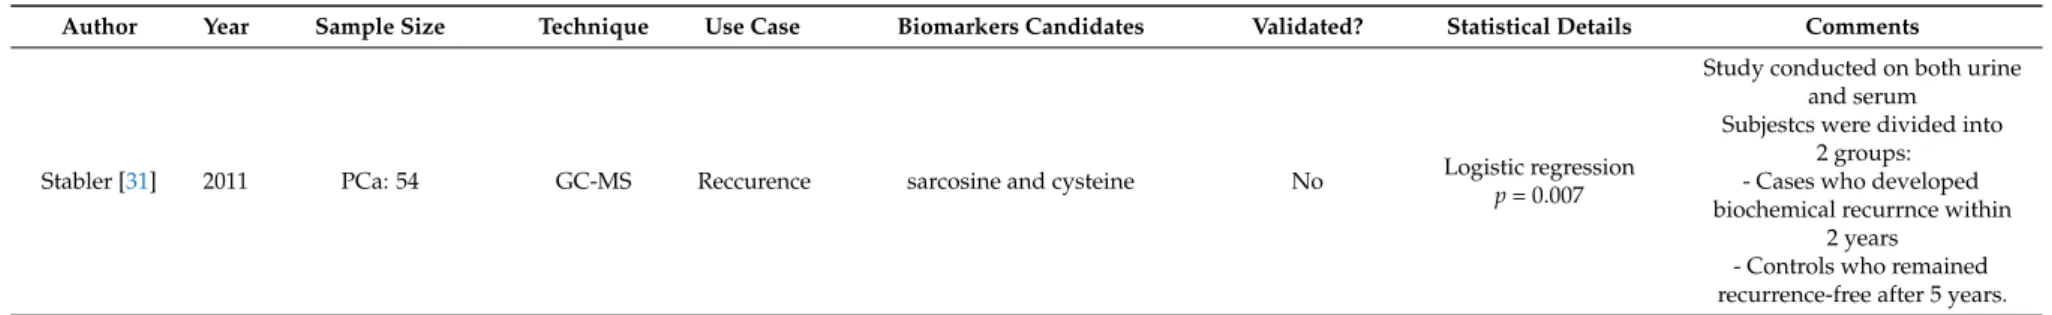
and 63%. A combination of PSA levels with urinary VOCs only gave a marginal improvement with accuracies of 71% and 65%, using RF and LDA, respectively. Pérez-Rambla’s study set out to identify potential non-invasive urinary metabolites discriminating PCa from BPH patients using 1H-NMR spectroscopy [37]. For this purpose, an OPLS-DA model was built but did not exhibit any statistical power. After reducing the number of variables (to overcome potential overfitting) and carrying out further analysis, eight metabolites showed statistically significant differences in their urine concentrations between PCa and BPH patients. Urine from PCa patients was characterized by increased concentrations of the branched-chain amino acids valine, leucine and isoleucine, glutamate and pseudouridine, and decreased concentrations of glycine, dimethylglycine, fumarate, and 4-imidazole-acetate. These results were partially consistent with observations made in a study conducted by Struck-Lewicka et al. who used liquid chromatography–mass spectrometry (LC–MS) and gas chromatography–mass spectrometry (GC–MS) for metabolomics profiling [38]. Although Struck-Lewicka and co-workers used healthy individuals (instead of patients with BPH) as control group, they also reported decreased levels of glycine in urine of PCa patients. In addition, glycine, serine, threonine, alanine, isocitrate, aconitate and succinate as well as several carnitines (including dimethylheptanoyl carnitine, propanoylcarnitine, butyrylcarnitine and octanoylcarnitine) were all decreased in urine of prostate cancer patients compared to healthy controls. Stabler and colleagues report metabolites for prediction of biochemical recurrence in urine samples from 54 patients. Of those patients, 25 developed biochemical recurrence within two years and 29 remained recurrence free after prostatectomy [31]. They reported that urinary sarcosine was significantly elevated at the time of surgery in patients who later developed biochemical recurrence. Likewise, urinary cysteine was found to be significantly elevated in biochemically-recurrent patients compared to recurrence-free patients.
Urinary dimethylglycine and homocysteine were not significantly different between the two groups.
Multiple logistic regression model for prediction of biochemical recurrence was only developed using
serum metabolites.
Urine Biomarkers for Risk Prediction of PCa
Kosti et al. reported the only pilot study of urinary changes associated with PCa risk prediction [39]. They used a liquid chromatography-tandem mass spectrometry method to determine urinary concentrations of 15 estrogen metabolites in 77 incident PCa cases, 77 healthy controls, and 37 subjects without evidence of prostate cancer based on prostate biopsy. The PCa cases were enrolled prior to initiation of treatment. Univariate analysis revealed that 16-ketoestradiol (16-KE2) and 17-epiestriol (17-epiE3) were significantly lower in PCa cases compared to healthy controls. In addition, 17-epiE3 was also found to be lower among biopsy controls compared to healthy controls (p = 0.01).
There was an inverse association between the levels of urinary 16-KE2 and 17-epiE3 and prostate cancer risk (p trend = 0.02), after adjustment for age, race, smoking status, presence of BPH and time of urine collection. Estrogen concentrations were not affected by body mass index, use of non-steroidal anti-inflammatory drugs, presence of diabetes, family history of prostate cancer or presence of BPH.
However, smoking is a modifier of urinary estrogen levels. Men in the lowest quartile of 16-KE2 had a
4.6-fold risk of prostate cancer (Odds ratios = 4.62, 95% confidence interval = 1.34–15.99) compared
with those in the highest quartile. However, larger studies are needed to confirm these findings.
Table 2. Results of the metabolomics studies conducted on urine samples.
Author Year Sample Size Technique Use Case Biomarkers Candidates Validated? Statistical Details Comments
Pérez-Rambla
[37] 2017
n= 115 PCa: 64B
BPH: 51
1H-NMR Diagnosis
branched-chain amino acids (BCAA), glutamate and
pseudouridine
glycine, dimethylglycine, fumarate and 4-imidazole-acetate.
No
PCA analysis OPLS-DA
p= 0.01
Gkotsos [33] 2017
PCa: 32 elevated PSA: 101
HC: 15
UPLC-MS/MS Diagnosis
Prognosis kynurenic acid No ROC analysis
p= 0.05
Ultrasonographically-guided prostatic biopsy collected before
and after prostatic massage for the 101 patients Urinary concentrations of
metabolites were not normalized to urinary creatinine The control group was recruited
only from individuals presenting for other etiologies and these patients usually are much younger than those presenting prostate cancer.
Fernández- Peralbo [35] 2016
n= 104 PCa: 62 HC: 42
LC-QTOF Diagnosis 28 significant metabolites No
PLS-DA t-test with Benjamini–Hochberg
false discovery rate p= 0.05
Morning urine samples The controls are negative biopsy
individualsCases are patients with significant PCa confirmed
by prostate biopsy MSTUS was selected for normalization ofurine samples
Tanzeela [36] 2015 PCa: 59
HC: 43 GC/MS Diagnosis 2,6-dimethyl-7-octen-2-ol, pentanal,
3-octanone, and 2-octanone No RF
LDA
Urine samples were obtained at different times of the day samples were classified as prostate cancer or controls after pathological examination of the
biopsy specimens
Struck-Lewicka
[38] 2015 PCa: 32
HC: 32
HPLC-TOF/MS
GC-QqQ/MS Diagnosis
metabolites involved in biochemical pathways like AA, purine and glucose metabolism as well as urea
and TCA cycle
No
PCA analysis PLS-DA
p= 0.05
Table 2. Cont.
Author Year Sample Size Technique Use Case Biomarkers Candidates Validated? Statistical Details Comments
Zhang [32] 2013 LC-HRMS
HILICRP Diagnosis
ureido isobutyric acid, indolylacryloyglycine, acetylvanilalinine and
2-oxoglutarate
Yes (PCa:30)
OPLS-DA ROC analysis
p= 0.05
Urine samples were stored at
−30◦C Three independent normalisation methodsTesting against a new cohort of patients.
Gamagedara
[34] 2012 PCa: 63
HC: 68 LC-MS/MS Diagnosis
Prognosis
proline, kynurenine, uraciland
glycerol-3-phosphate No
Linear regression PCA analysis
CART p= 0.05.
Validation study
Wu [40] 2011
PCa: 20 BPH: 8 HC: 20
ID GC/MS
MAD Diagnosis
PCa vs. HC: Propenoic acid, Pyrimidine, Dihyroxybutanoic acid,
Creatinine, Purine, Purine, Glucopyranoside, Ribofuranoside,Xylonic acid,
Xylopyranose PCa vs. BPH: Dihyroxybutanoic
acid, Pyrimidine, Xylonic acid, Xylopyranose, Ribofuranoside
No
PCA analysis ROC analysis
p = 0.05
Cao [41] 2010 PCa: 86
HC: 45 LC-MS Diagnosis Sarcosine No
Logistic regression ROC analysis
p= 0.05
First voided urines after digital rectalexamination (DRE)
Kosti [39] 2010
PCa: 77 HC: 77 Biopy controls: 37
LC-MS Predection 16-ketoestradiol 17-epiestriol No Logistic regression
The biopsy controls had elevated PSA due to BPH (n= 27) or other urologic
conditions (10)
Derezi ´nski
[27] 2017 PCa: 49
HC: 40 LC-ESI-MS/MS Diagnosis
γ-amino-n-butyric acid, phosphoethanolamine, ethanolamine, homocitrulline, arginine,δ-hydroxylysine and
asparagine
No
ROC analysis PLS-DA
p= 0.05
Evaluation of free amino acid profiles in both urine and serum
samples from the same patiens Controls recruited among men subjected to the routine periodic
medical examination Sample collection period over
3 months
Table 2. Cont.
Author Year Sample Size Technique Use Case Biomarkers Candidates Validated? Statistical Details Comments
Stabler [31] 2011 PCa: 54 GC-MS Reccurence sarcosine and cysteine No Logistic regression
p= 0.007
Study conducted on both urine and serum
Subjestcs were divided into 2 groups:
- Cases who developed biochemical recurrnce within
2 years - Controls who remained recurrence-free after 5 years.
BPH: benign prostate hyperplasia; CART: classification and regression trees; ESI: electrospray ionization; GC: gas chromatography; HC: healthy control; (HP/UP/HILICP)LC:
(high performance/ultra performance/hydrophilic interaction and reversed phase) liquid chromatography; MS: mass spectrometry; MS/MS tandem mass spectrometry;
NMR: nuclear magnetic resonance; OPLS-DA: orthogonal projections to latent structures-discriminant analysis; QqQ/MS: triple quadrupole mass spectrometry; (Q)TOF:
(quadrupole) time of flight; PCa: prostate cancer; PCA: principal component analysis; PLS(R)-DA: partial least squares (regression)-discriminant analysis; RF: random forests; ROC:
receiver-operating characteristic.