Deciphering the role of mitogen-activated protein kinases in host cell death induced by
Mycobacterium tuberculosis
Inaugural-Dissertation zur
Erlangung des Doktorgrades
der Mathematisch-Naturwissenschaftlichen Fakultät der Universität zu Köln
vorgelegt von Jessica Gräb aus Jammu
Köln 2020
Berichterstatter: Prof. Dr. Hamid Kashkar
Prof. Dr. Karin Schnetz
Tag der mündlichen Prüfung: 23.06.2020
Content
3 Content
1. Abbreviations ... 6
2. Introduction ... 9
2.1 Tuberculosis ... 9
2.2 Mycobacterium tuberculosis ... 11
2.2.1 ESX-1 secretion system ... 13
2.2.2 Immune response to Mtb infection ... 13
2.3 Mtb and its host cell ... 14
2.4 Apoptosis, programmed host cell death ... 15
2.5 Necrosis ... 17
2.5.1 Necroptosis ... 18
2.5.2 Pyroptosis ... 20
2.5.3 Ferroptosis ... 21
2.5.4 Necrotic cell death and mitochondria ... 21
2.6 Aim ... 21
3. Materials ... 23
3.1 Equipment... 23
3.2 Chemicals ... 24
3.3 Consumables ... 25
3.4 Media and buffer... 26
3.5 Kits and reagents ... 27
3.6 Primer ... 27
3.7 Antibodies... 28
3.8 Cell lines ... 28
3.9 Primary mouse cells ... 28
3.10 Bacteria ... 28
3.11 Software ... 29
Content
4
4. Methods ... 30
4.1 Cell biology methods ... 30
4.1.1 Culturing of cell lines ... 30
4.1.2 Isolation of single cell suspensions ... 30
4.1.3 Determination of cell numbers ... 31
4.1.4 Survival Assay ... 31
4.1.5 Fluorescence microscopy ... 32
4.1.6 Isolation of mitochondria ... 32
4.2 Molecular biology methods ... 32
4.2.1 Culture conditions of Mycobacterium tuberculosis ... 32
4.2.2 Determination of colony-forming units ... 33
4.2.3 Lactate dehydrogenase release assay ... 33
4.2.4 Caspase activity assay ... 33
4.2.5 Adenosine triphosphate assay ... 33
4.2.6 Quantification of calcium ... 34
4.2.7 Quantification of reactive oxygen species ... 34
4.2.8 Isolation of RNA ... 34
4.2.9 Synthesis of cDNA ... 35
4.2.10 Quantitative real-time PCR ... 35
4.3 Biochemical methods ... 35
4.3.1 Enzyme-linked immunosorbent assay ... 35
4.3.2 Immunoblot analysis ... 36
4.4 Statistical analysis ... 36
5. Results ... 37
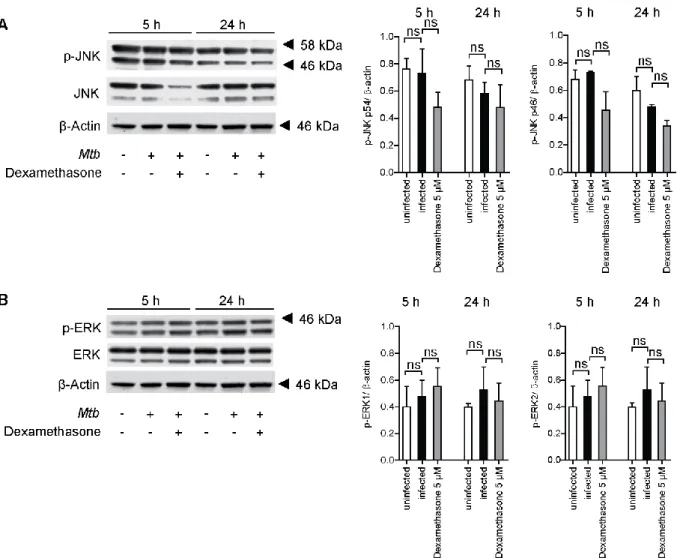
5.1 Inhibition of Mtb-induced cell death by corticosteroids ... 37
5.2 Activation of p38 MAPK initiates host cell death ... 39
5.3 Apoptosis in Mtb-mediated host cell death ... 44
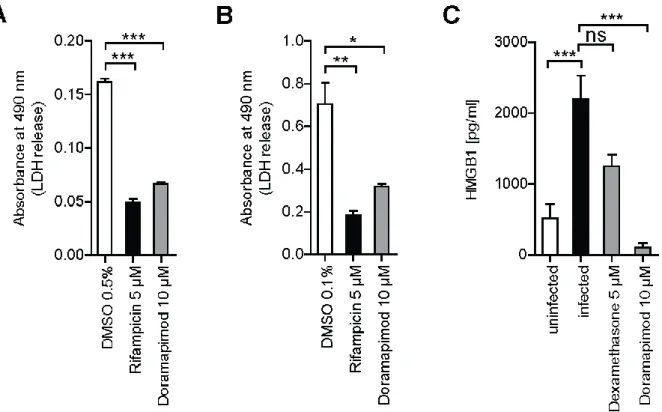
5.4 Induction of necrosis in Mtb-infected cells ... 46
5.4.1 Mtb infection triggers the secretion of necrotic markers ... 46
5.4.2 Necroptosis is not relevant in TB infection ... 47
Content
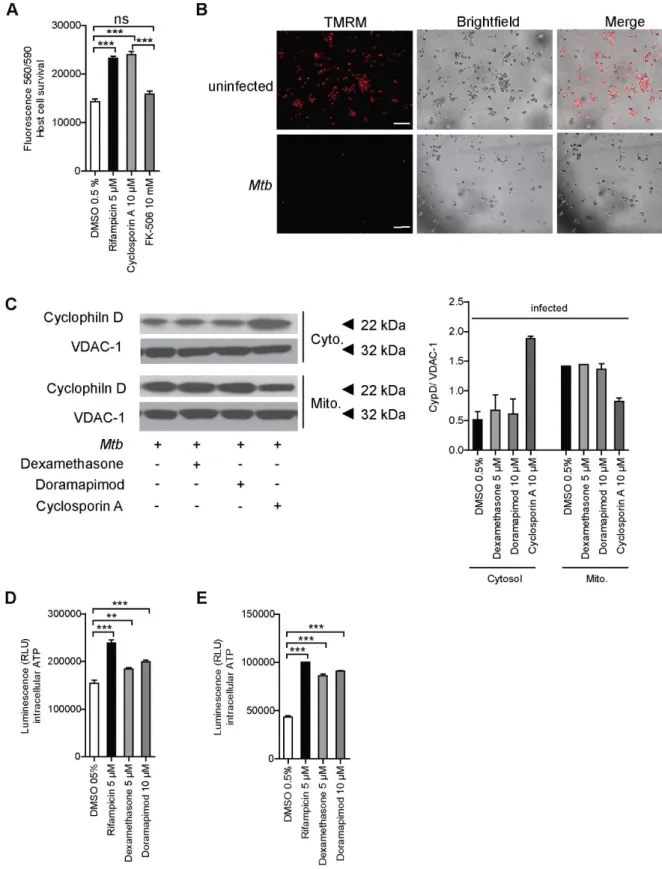
5 5.5 Opening of the mitochondrial permeability transition pore results in host
cell death ... 48
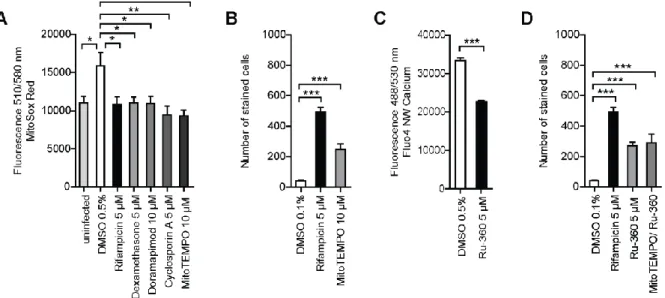
5.5.1 Mitochondrial damage is crucial for Mtb-induced host cell death ... 50
5.5.2 Hexokinase II and p53 are potential regulators of the mPTP ... 51
5.5.3 Overexpression of Bcl-2 prevents mitochondrial damage ... 54
5.6 Model: A p38 MAPK dependent pathway is responsible for necrotic cell death induced by Mtb ... 57
6. Discussion ... 58
6.1 Identification and characterization of Mtb-mediated host cell death ... 58
6.2 Induction of necrosis in Mtb-infected cells ... 61
6.3 Role of mitochondria in Mtb-induced necrosis ... 63
7. References ... 69
8. Summary ... 79
9. Zusammenfassung ... 81
10. List of figures ... 83
11. List of tables ... 84
12. Acknowledgements ... 85
13. Declaration ... 86
14. Curriculum vitae ... 87
Abbreviations
6 1. Abbreviations
°C Degree Celsius
ΔΨm Mitochondrial membrane potential
7H9c 7H9 complete medium
ADC Albumin dextrose catalase
AIM Absent in melanoma
AKT Protein kinase B
ANT Adenosine translocase
ASC Apoptosis-associated speck-like protein ASK Apoptosis signal-regulating kinase
ATP Adenosine triphosphate
BCA Bicinchoninic acid
Bcl-2 B cell lymphoma 2
BMDM Bone marrow-derived macrophage
BSA Bovine serum albumin
Ca
2+Calcium
CARD Caspase activation and recruitment domain
Casp Caspase
CCCP Carbonylcyanid-m-chlorophenylhydrazon CCL Chemokine (C-C motif) ligand
CD Cluster of differentiation
cDNA Complementary DNA
CFP-10 Culture filtrate protein of 10 kDa
CFU Colony-forming unit
CHAPS 3-[(3-cholamidopropyl)dimethylammonio]-1-propanesulfonate
CsA Cyclosporine A
CXCL Chemokine (C-X-C motif) ligand 1
CypD Cyclophlin D
CytoC Cytochrome C
DAMP Danger-associated molecular pattern DAPI 4’,6-Diamidin-2-phenylindol
DC Dendritic cell
DISC Death-inducing signaling complex DMEM Dulbecco’s modified eagle’s medium
DMSO Dimethyl sulfoxide
DNA Deoxyribonucleic acid
EDTA Ethylenediaminetetraacetic acid ELISA Enzyme-linked immunosorbent assay
EMB Ethambutol
ER Endoplasmic reticulum
ERK Extracellular signal-regulated kinase
ERS ER stress
ETC Electron transport chain
FBS Fetal bovine serum
FCS Fetal calf serum
FSA Fibroblast survival assay
g Acceleration of gravity
GAPDH Glyceraldehyde 3-phosphate dehydrogenase
Gpx Glutathione peroxidase
Abbreviations
7
GSDMD Gasdermin D
GSH Glutathione
h Hours
HBSS Hank’s balanced salt solution
HDT Host-directed therapy
HEPES 4-(2-hydroxyethyl) -1-piperazineethanesulfonic acid
HIV Human immunodeficiency virus
HMBS Hydroxymethylbilane synthase HMGB1 High-Mobility-Group-Protein B1
HRP Horseradish peroxidase
IFN Interferon
IL Interleukin
IMM Inner mitochondrial membrane
INH Isoniazid
iNOS Inducible nitric oxide synthase
IRAK Interleukin receptor-associated kinase
JNK c-Jun N-terminal kinase
KD Knockdown
kDA Kilo Dalton
KI Knockin
KO Knockout
LDH Lactate dehydrogenase
LPS Lipopolysaccharide
LTA4H Leukotriene A4 hydrolase LTBI Latent tuberculosis infection
M-CSF Macrophage colony-stimulating factor
Mᴓ Macrophage
MACS Magnetic activated cell sorting
ManLAM Mannose-capped lipoarabinomannan
MAP Mitogen-activated protein
MAP2K MAP kinase kinase
MAPK MAP kinase
MDR-TB Multi-drug resistant TB
MEM Minimum Essential Medium
min Minutes
MKP-1 Mitogen-Activated Protein Kinase Phosphatase 1 MLKL Mixed lineage kinase domain-like pseudokinase MOI Multiplicity of infection
MOMP Mitochondrial outer-membrane permeabilization MOPS 3-(N-morpholino)propanesulfonic acid
MPT Mitochondrial permeability transition mPTP Mitochondrial permeability transition pore
mRNA Messenger RNA
Mtb Mycobacterium tuberculosis mTOR Mammalian target of rapamycin
MW Molecular weight
MyD88 Myeloid differentiation primary response 88
NDH NADH-hydrogenase
NK cell Natural killer cell
NLR NOD-like receptor
NOD Nucleotide oligomerization domain
Abbreviations
8
OD Optical density
OMM Outer mitochondrial membrane
OXPHOS Oxidative phosphorylation
PAMP Pathogen-associated molecular patterns PBMC Peripheral blood mononuclear cells
PBS Phosphate buffered saline
PCR Polymerase chain reaction
PDE2 Prostaglandin E2
PDIM Phthiocerol dimycocerosate
PFA Paraformaldehyde
PGL Phenolic glycolipid
pH potenia Hydrogenii, negative decadic logarithm of the H
3O
+concentration
PRR Pattern recognition receptors
PZA Pyrazinamide
RD1 Region of difference 1
RIF Rifampicin
RIPA Radio immunoprecipitation assay RIPK Receptor‐interacting protein kinase
RNA Ribonucleic acid
ROS Reactive oxygen species
rpm Revolutions per minute
RPMI Roswell Park Memorial Institute
s Seconds
SDS Sodium dodecyl sulfate
T7SS Type VII secretion system
TB Tuberculosis
TBS Tris-buffered saline
TBST TBS Tween 20
TCA Tricarboxylic acid
TDM Trehalose di-mycolate
TIR Toll/interleukin receptor
TLR Toll- like receptor
TMM Trehalose mono-mycolate
TMRM Tetramethylrhodamine
TNF Tumor necrosis factor
TNFR TNF receptor
TNT Tuberculosis necrotizing toxin TRADD TNFR-associated death domain TRAIL TNF‐related apoptosis‐inducing ligand
TRIF TIR-domain containing the adapter-inducing interferon VDAC Voltage-dependent anion channel
w/o Without
WT Wild type
VDAC Voltage-dependent anion channel
XDR-TB Extensively-drug resistant TB
Introduction
9 2. Introduction
2.1 Tuberculosis
Tuberculosis (TB) is an airborne disease which is spread through the inhalation of droplets containing Mycobacterium tuberculosis (Mtb). According to the WHO Global Tuberculosis Report approximately 1.7 billion people are infected with Mtb and 1.5 million people died in 2018 (WHO, 2019). Hence, Mtb is the major killer among infectious agents and the ninth cause of death worldwide. TB can infect most organs within the body, including the bones, the central nervous system, the lymph nodes and the genitourinary tract. However, the most common form of active TB is pulmonary TB (Kaufmann, 2001).
Following inhalation of the bacteria, Mtb migrates through the respiratory tract to settle in the host alveoli. The bacteria are engulfed by alveolar macrophages (Mᴓ) and restrained within the phagosome in a process called phagocytosis (Mack et al., 2009).
However, phagocytosis of Mtb by Mᴓ does not lead to complete clearance of the bacteria. Therefore, Mᴓ recruit other immune cells through the secretion of pro- inflammatory cytokines and chemokines, like tumor necrosis factor (TNF), to the site of infection to induce a local immune response (Russell, 2007). Potentially, novel recruited immune cells represent a new host for Mtb. Subsequently, a secondary immune response is triggered in the lymph nodes to recruit and activate T cells, resulting in the formation of granuloma. Granuloma consist of Mᴓ, B cells, T cells and fibroblasts surrounding the infected Mᴓ (Fig. 1). Hence, the bacteria are contained within the granuloma, preventing dissemination of the disease. Simultaneously though the bacteria cannot be eliminated by the immune system of the host (Russell, 2007).
This homeostasis can exist for decades until an immunosuppressive condition, such
as an infection with the human immunodeficiency virus (HIV), causes an immune
imbalance and a reactivation of the disease. Therefore, the role of the granuloma is
either protective by containing the bacteria or detrimental by allowing the survival of
the bacteria and persistence of infection (Russell, 2007).
Introduction
10 Figure 1. Pathology of Mycobacterium tuberculosis (Mtb) infection. Inhalation of droplets containing Mtb leads to phagocytosis by alveolar macrophages (Mᴓ) and induction of a local immune response. The recruitment of other immune cells, such as lymphocytes, results in the formation of granuloma. These consist of infected Mᴓ surrounded by mononuclear cells and lymphocytes as well as a fibrous cuff of extracellular matrix structures. At later stages of infection, a fibrous sheath is built while the amount of blood vessels is reduced, creating a hypoxic environment in which the infection is contained. Immunosuppressive conditions can reactivate the disease leading to caseating granulomas and the release of the bacteria (Russell, 2007).
A latent, asymptomatic infection (LTBI) is developed in approximately 90% of infected
people, while only 10% develop an active primary TB. Thus, a TB infection has three
possible outcomes. An active disease (primary TB), an asymptomatic LTBI or a
Introduction
11 reactivation of a LTBI and progression to an active form of the disease even months to years after infection (post-primary TB) (Kaufmann, 2001). The treatment period for drug-susceptible TB strains lasts 6 months in most cases and results in cure of the disease in up to 95% of the cases. During the first two months, four first-line drugs, namely rifampicin (RIF), isoniazid (INH), pyrazinamide (PZA) and ethambutol (EMB), are administered to the patients, followed by four months of RIF and INH (Yew et al., 2011). A major problem in recent years has been the spread of multi-drug resistant (MDR-) and extensively-drug resistant (XDR-) TB strains. These MDR-strains are resistant to the first-line antibiotics RIF and INH. Approximately 484,000 cases of MDR- TB were reported in 2018 and about 6.2% of them were caused by XDR-TB strains, which are in addition resistant to most second-line antibiotics. Therefore, the WHO declared TB a public health crisis (WHO, 2019).
2.2 Mycobacterium tuberculosis
Mycobacterium tuberculosis (Mtb), the causative agent of TB, is an aerobic, rod shaped, acid fast bacterium. Mtb belongs to a complex of mycobacterial species which causes TB in mammals. These include M. bovis and M. caprae (cattle), as well as M.
microti (voles) and M. pinnipedii (pinnipeds). Other mycobacteria include Mycobacterium leprae, the causative agent of leprosy (Herdman and Steele, 2004). In addition there is large number of ubiquitous so called non-tuberculous mycobacteria (NTM) which may cause disease primarily in the immunocompromised patient population (Porvaznik et al., 2017).
Mycobacteria have a unique cell wall, which consists of a peptidoglycan layer,
arabinogalactan and mycolic acid (Fig. 2). The thick peptidoglycan layer resembles
that of Gram-positive bacteria and the waxy outer layer resembles that of Gram-
negative bacteria. The peptidoglycan layer outside of the cytoplasmic membrane is
covalently bound by phosphodiester bonds to the arabinogalactan layer, while the
mycolic acids are attached between the arabinogalactan and trehalose, forming mono-
or di-mycolate (TMM, TDM). Finally, the cell envelope is surrounded by a
polysaccharide-rich capsule-like structure (Alderwick et al., 2015).
Introduction
12 Figure 2. Mycobacterial cell wall. Schematic of the mycobacterial cell wall, containing peptidoglycan, arabinogalactan and mycolic acids.
It has been reported that components of the mycobacterial cell wall are involved in the manipulation of the host immune response and the formation of granuloma. The lipoarabinomannan and the arabinomannan are released inside the infected cells by a passive, undirected process. These bacterial lipids are taken up by uninfected immune cells, allowing mycobacteria to influence host cells even beyond the actively infected cells (Beatty et al., 2000). Hence, the cell wall of mycobacteria is a major virulence factor. Furthermore, the cell wall is also important in intrinsic antibiotic resistance. For instance, the peptidoglycan layer covered by arabinogalactan is hydrophilic and thereby prevents the transport of hydrophobic molecules. Similarly, the mycolic acids, which are long chain fatty acids, build a waxy layer to limit the transport of hydrophilic molecules, such as the tetracycline antibiotics (Brennan and Nikaido, 1995). The manipulation of genes involved in cell wall synthesis by transposon mutagenesis has resulted in increased antibiotic sensitivity of Mtb (Gao et al., 2003). In addition to these passive resistance mechanisms, Mtb also possesses specialized mechanisms to actively neutralize antibiotics (Nguyen, 2016). One mechanism is the modification of the drug targets by a modulation in the methylation pattern of ribosomal ribonucleic acid (RNA), resulting in resistance to cyclic peptide antibiotics (Maus et al., 2005).
Another mechanism is the enzymatic degradation of antibiotics, such as β-lactam
antibiotics, which are hydrolyzed by β-lactamases (Chambers et al., 1995). Finally,
mycobacteria use efflux pumps to actively expel antibiotics. Rv1473 is such an efflux
pump encoding gene that is induced by the transcription regulator WhiB7 upon
exposure to macrolides and tetracyclines (Duan et al., 2019).
Introduction
13 These mechanisms as well as a robust cell wall and a slow replication rate of approximately 20 hours are essential for persistence of mycobacteria inside the host cell (Nguyen, 2016).
2.2.1 ESX-1 secretion system
Mycobacteria further evade and subvert the host immune system through the secretion of virulence factors via secretion systems. In mycobacteria five type VII secretion systems (T7SS; ESX-1 to ESX-5) have been identified (Shah and Briken, 2016). The first T7SS discovered, was the ESX-1 system, which is encoded by a genetic locus called region of difference 1 (RD1). This locus is deleted in the TB live vaccine strain M. bovis BCG resulting in attenuation of the bacterium (Pym et al., 2002). The ESX-1 system is a multi-component translocation system consisting of transmembrane proteins, adenosine triphosphate (ATP)ases and accessory proteins. ESX-1 secreted proteins have been shown to be important for host-cell invasion, prevention of phagosome maturation and intracellular replication (Wong, 2017). One of the most essential ESX-1 substrates is the heterodimeric complex comprised of a 6 kDa protein EsxA (ESAT-6) and a culture filtrate protein of 10 kDa (CFP-10). Both proteins are responsible for induction of host cell death and subsequently dissemination of Mtb (Wong, 2017) .
2.2.2 Immune response to Mtb infection
The host responds with both the innate and the adaptive immune system to TB
infection. The bacterium is recognized by the immune cells via the expression of
pathogen-associated molecular patterns (PAMP), such as lipoproteins and glycolipids,
on the bacterial surface. These antigens are bound by pattern recognition receptors
(PRR) (Ferraris et al., 2018). The most important PRR in Mtb infection are the Toll- like
receptor (TLR) 2 and TLR4, which recognize different components of the bacterial cell
wall, as well as the nucleotide oligomerization domain (NOD)-like receptors (NLR) 1
and 2, which are cytoplasmic PRR (Ferraris et al., 2018). Upon recognition of a PAMP,
TLR2 activates the myeloid differentiation primary response 88 (MyD88) and
interleukin-1 receptor-associated kinase (IRAK) pathway, resulting in the release of
pro-inflammatory cytokines. These pro-inflammatory cytokines (TNF) and chemokines
(CXCL9,10 and CCL2,3,4,5) recruit Mᴓ and lymphocytes to kill the bacteria by
phagocytosis and the production of reactive nitrogen intermediates (Ferraris et al.,
2018).
Introduction
14 TLR4 can also trigger the toll/interleukin receptor (TIR)-domain containing the adapter- inducing interferon-β (TRIF) pathway, leading to the secretion of interferon (IFN)-β, while NOD receptors mainly induce inflammation by activating mitogen-activated protein (MAP) kinase (MAPK) pathways (Shaw et al., 2008). MAPK are a family of serine/ threonine kinases, consisting of the extracellular signal-regulated kinase (ERK), the c-Jun NH2-terminal kinase (JNK) and p38 MAPK. MAPK are activated by dual phosphorylation of threonine and tyrosine residues by MAPK kinases (MAP2K) and are deactivated by MAPK phosphatases (MKP). Phosphorylation of these kinases is triggered in response to growth stimuli and environmental stresses, such as UV irradiation and inflammation (Johnson and Lapadat, 2002). p38 MAPK has four isoforms, p38α, p38β, p38γ and p38δ, which differ in their expression patterns and their specific substrates (Cuenda and Rousseau, 2007). The two main activators of p38 MAPK are the MAP2K MKK3 and MKK6. Downstream of the signaling cascade, p38 MAPK regulates the expression of many cytokines, such as TNF and interleukins (IL), as well as the expression of intracellular enzymes, like inducible nitric oxide synthase (iNOS), which are important in inflammation and host cell death (Zarubin and Han, 2005). p38 MAPK is postulated to play a role in the immune response against Mtb (Aguilo et al., 2013). However, the exact role in host defense and manipulation of host signaling pathways by Mtb is not well described so far.
2.3 Mtb and its host cell
Unlike many other bacteria Mtb is highly dependent on the human host for survival, growth and spread. Therefore, a host-pathogen adaptation was essential for the survival of Mtb. The bacterium exploits, evades and modulates the immune system to persist inside the host (Cambier et al., 2014).
After reaching the alveolar spaces in the lung, Mtb uses phthiocerol dimycocerosate (PDIM) on its surface to evade recognition by PRR. Simultaneously, the bacterium expresses phenolic glycolipid (PGL) to trigger CCL2 expression in Mᴓ for further recruitment of additional Mᴓ that can be infected (Cambier et al., 2014).
Moreover, Mtb is highly adapted to survive inside Mᴓ by preventing phagosome
acidification and phagolysosomal fusion (Deretic et al., 2006). Phagocytosis, a form of
endocytosis, is an important mechanism of the innate immunity. Under normal
conditions, the pathogen is engulfed by the phagosome, which subsequently fuses with
the lysosome to form the phagolysosome. The phagolysosome is acidified to pH 5.2
and enzymes are activated to degrade bacteria. However, Mtb is able to interfere with
Introduction
15 this process. The cell wall component mannose-capped lipoarabinomannan (ManLAM) inhibits phagolysosomal fusion, possibly via the secretion of EsxA, and allows Mtb to reside in non-acidified endosomes (Cambier et al., 2014). Similarly, Mtb uses proteins secreted through the ESX-1 secretion system, such as EsxA, to permeabilize the phagosomal membrane, which enables Mtb to be released out into the cytosol (Wallis and Hafner, 2015). Furthermore, EsxA is involved in the inhibition of autophagy, a process that normally leads to bacterial killing (Romagnoli et al., 2012). Nevertheless, prior activation of the Mᴓ can overcome the interference of Mtb, resulting in phagosome acidification and death of the bacteria (Schaible et al., 1998). At later stages of infection, the adaptive immune system is induced to help to control the disease. However, Mtb also has mechanisms to evade adaptive immunity. For instance, the bacterium delays the priming and activation of T cells by reducing the migration of dendritic cells (DC) to the lymph nodes, as well as limits the responsiveness of Mᴓ to IFN-γ secreted by T cells at the site of inflammation (Pagan and Ramakrishnan, 2014). IFN-γ signaling is also responsible for intracellular tryptophan starvation, which restricts bacterial growth. Mtb responds with production of its own tryptophan and thereby is not dependent on the host (Zhang et al., 2013).
Taken together, these mechanisms enable Mtb to survive inside the Mᴓ and the granuloma.
2.4 Apoptosis, programmed host cell death
In order to escape the granuloma, the bacterium is depended to induce host cell death.
TB-infected Mᴓ die either by apoptosis or necrosis. Apoptosis is an immunologically
silent process, which results in the uptake of dead cells by other immune phagocytes
(Ramakrishnan, 2012). In general, the two pathways of apoptosis, the intrinsic and the
extrinsic pathway, induce the activation of effector cysteine proteases (caspases)
leading to the degradation of cellular organelles and fragmentation of deoxyribonucleic
acid (DNA). The extrinsic or death receptor pathway, is activated in response to
extracellular stimuli recognized by TLR or the TNF receptor superfamily. After
recognizing a ligand the receptors recruit caspase 8 to form the death-inducing
signaling complex (DISC) and to complete apoptosis (Elmore, 2007). Subsequently,
the components of the apoptotic cell are engulfed by apoptotic bodies and
phagocytosed by other Mᴓ (Fig. 3). Therefore, these Mᴓ represent new potential hosts
for Mtb, allowing the bacterium to avoid extracellular host defenses and to spread via
cell-to cell spread (Hotchkiss and Nicholson, 2006).
Introduction
16 Most intracellular pathogens, including Mtb, have developed strategies to modulate host cell death to their own benefit. The role of apoptosis in Mtb infection has been a matter of debate for years. Evidence for both, the inhibition (Divangahi et al., 2009) or activation (Aporta et al., 2012) of apoptosis has been provided. It has been shown that Mtb may trigger apoptosis through the secretion of EsxA. EsxA induces an intracellular increase of reactive oxygen species (ROS) and calcium (Ca
2+) to promote the activation of endoplasmic reticulum (ER)-stress-associated pathways. These pathways are regulated by apoptosis signal-regulating kinase 1 (ASK1) and p38 MAPK and result in intrinsic apoptosis (Davis and Ramakrishnan, 2009). The phosphorylation of p38 MAPK leads to the activation of pro-apoptotic B-cell lymphoma 2 (Bcl-2) family proteins, such as Bim and Bcl-2 associated X protein (Bax). The proteins of the Bcl-2 family are essential for maintaining the mitochondrial function and integrity. Upon phosphorylation of Bim or the tumor-suppressor protein p53, the expression of pro- apoptotic proteins is promoted, while anti-apoptotic proteins are repressed, resulting in the accumulation of pro-apoptotic proteins at the mitochondria (Marchenko and Moll, 2014; Perfettini et al., 2005). Subsequently, intrinsic apoptosis induces mitochondrial outer-membrane permeabilization (MOMP) leading to the release of cytochrome c (CytoC), the activation of the initiator caspase 9 and finally the activation of the effector caspases 3,6 and 7 (Elmore, 2007).
In contrast, it has been shown that Mtb encodes anti-apoptotic genes, like nuoG, which
expresses the NuoG subunit of NDH-1, a type I NADH-hydrogenase. NDH-1 inhibits
phagosomal ROS and TNF secretion and thereby abrogates apoptosis (Miller et al.,
2010). In addition, recently published data show that only attenuated Mtb strains
promote apoptosis and that virulent Mtb strains favor necrotic cell death, making Mtb
an ideal model organism to study the effects of different cell death pathways (Gräb et
al., 2019; Zhao et al., 2017).
Introduction
17 Figure 3. Pathways of apoptosis. Extrinsic apoptosis is triggered by pathogen-associated molecular patterns (PAMP) on the bacterial surface, which are recognized by pattern recognition receptors (PRR). Subsequently, caspase (Casp-) 8 is recruited to activate Casp-3 and 7 to complete apoptosis. Intrinsic apoptosis is mediated by cytochrome c (CytoC) released after mitochondrial outer membrane permeabilization (MOMP). CytoC recruits Casp-3 and 7 via Casp-9. Finally, the apoptotic cell is engulfed by apoptotic bodies and phagocytosed by Mᴓ.
2.5 Necrosis
Necrosis was first described as an accidental form of cell death in response to
environmental insults, clearly separating necrosis from the regulated and programmed
apoptosis. Cells undergoing necrosis are characterized by a swollen morphology and
random degradation of DNA, resulting in the release of cellular contents into the
surrounding tissues (Fig. 4). Therefore, necrosis is considered a highly pro-
inflammatory and energy independent form of cell death (D'Arcy, 2019). Unlike
apoptosis, no distinct markers have been identified in necrotic cells, leading to the
assumption that necrosis is an unstoppable and undruggable process (Ying and
Padanilam, 2016). However, in recent years many advances have been made in the
research field of cell death, challenging the perception of necrosis. By now,
programmed forms of necrosis have been identified, such as necroptosis, pyroptosis
and ferroptosis (Abe and Morrell, 2016; Shimada et al., 2016). These types of cell
death demonstrate that regulated cell death is not restricted to apoptosis and that the
different cell death pathways are interconnected. Furthermore, regulated necrosis may
Introduction
18 present new opportunities to pharmacologically intervene with necrotic cell death (Conrad et al., 2016).
Mtb promotes necrosis by impeding the synthesis of prostaglandin E2 (PGE2) and thereby influences the plasma membrane repair mechanisms. These are especially important for the repair of lysosomal membranes, which rupture during necrosis (Divangahi et al., 2009). Lysosomes contain around 80 hydrolases that upon release into the cytoplasm inhibit energy metabolism in the cytoplasm and reduce ATP production and oxidative phosphorylation of the mitochondria (Ferri and Kroemer, 2001). Thus, virulent Mtb delays host cell death at an early stage of infection to hide from the host immune system and promotes cell death at later stages to escape from the confines of the Mᴓ into the residing tissues and start a cycle of re-infection (Russell, 2007).
Figure 4. Necrosis. Environmental stress leads to opening of the mitochondrial permeability pore (mPTP) and the release of mitochondrial reactive oxygen species (ROS), as well as the depletion of adenosine triphosphate (ATP). Necrotic cell death is accompanied by nuclear swelling and rupture of the cell membrane resulting in the release of all cellular content into residing tissues.
2.5.1 Necroptosis
Until recently necrosis was only described as an unregulated form of cell death. By
now, other forms of cell death have been described, which are regulated but have
characteristics of necrosis. One such form is called necroptosis. Necroptosis is
Introduction
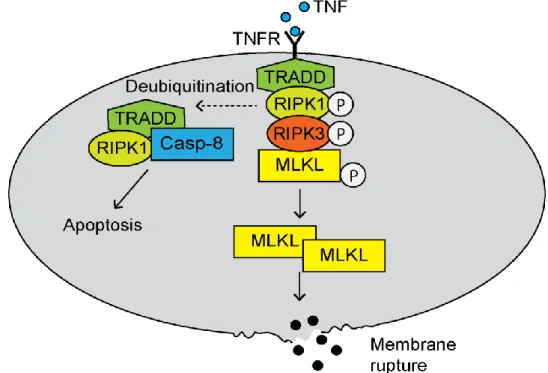
19 mediated either by TNF receptor 1 (TNFR1) or by TNF‐related apoptosis‐inducing ligand (TRAIL) and Fas receptors. Afterwards, the receptor‐interacting protein kinase (RIPK)1 and RIPK3 are activated. TNFR1 recruits RIPK1 to the TNFR-associated death domain (TRADD) to build complex I (Fig. 5). De-ubiquitination of RIPK1 normally activates caspase 8 and subsequently apoptosis. However, if caspase 8 is inhibited, RIPK1 and RIPK3 are phosphorylated and trigger the formation of the necrosome. The phosphorylated RIPK3 recruits and phosphorylates the mixed lineage kinase domain- like pseudokinase (MLKL). This kinase oligomerizes and migrates to the cell membrane where it binds to cardiolipin and phosphatidylinositol lipids, resulting in membrane permeabilization (Vandenabeele et al., 2010).
The role of necroptosis in Mtb-mediated host cell death is still a matter of debate. While proof for the induction (Roca and Ramakrishnan, 2013; Zhao et al., 2017) of necroptosis has been provided, others have demonstrated that Mtb-induced host cell death is independent of MLKL activation (Gräb et al., 2019; Stutz et al., 2018).
However, the different findings regarding the role of necroptosis in Mtb-mediated host cell death are potentially influenced from cell-type-specific differences, such as the origin of the cells and their maintenance of molecular pathways in culture, and therefore need to be further investigated (Stutz et al., 2018).
Figure 5. Necroptosis. Recognition of tumor necrosis factor (TNF) by the TNF receptor
(TNFR) leads to the assembly of the necrosome. The necrosome consists of the TNFR-
associated death domain (TRADD), the receptor‐interacting protein kinase (RIPK)1 and 3 and
the mixed lineage kinase domain-like pseudokinase (MLKL). Oligomerized MLKL migrates to
Introduction
20 the cell membrane and leads to membrane permeabilization. Deubiquitination of RIPK1 activates caspase 8 and triggers apoptosis.
2.5.2 Pyroptosis
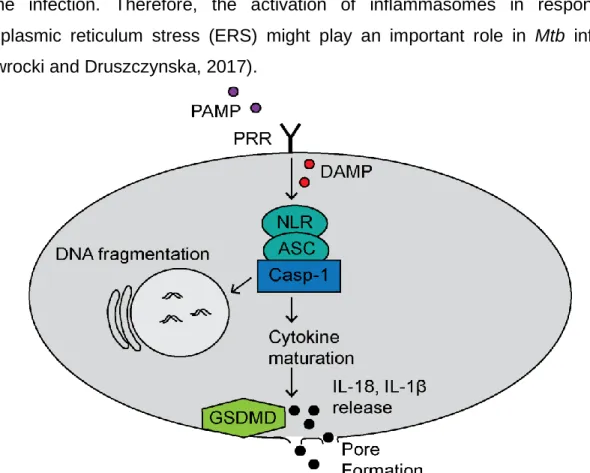
Pyroptosis is a caspase-dependent and pro-inflammatory form of cell death. This form of cell death is characterized by swelling of the cells, formation of pores on membranes and finally the release of pro-inflammatory cytokines, such as IL-1β and IL-18 (Abe and Morrell, 2016). The canonical pathway is triggered by PAMP or danger-associated molecular patterns (DAMP), like increasing levels of ROS or bacterial peptidoglycan, which result in the activation of inflammasomes. Inflammasomes consist of a PRR, the adapter protein apoptosis-associated speck-like protein (ASC), the caspase activation and recruitment domain (CARD) of ASC and pro-caspase 1. Following caspase 1 activation, gasdermin D (GSDMD) cleavage results in membrane pore formation and finally, in the release of cytokines from the pyroptotic cell (Fig. 6). Recruitment of other immune cells to the site of inflammation is also a characteristic of pyroptosis (Liu et al., 2016).
The role of pyroptosis in Mtb infection is still under investigation. Although it has been proven that mice deficient for IL-1β and IL-18 cytokine production are more susceptible to the infection. Therefore, the activation of inflammasomes in response to endoplasmic reticulum stress (ERS) might play an important role in Mtb infection (Wawrocki and Druszczynska, 2017).
Figure 6. Canonical pathway of pyroptosis. Recognition of danger-associated molecular
patterns (DAMP) or PAMP activate the inflammasome, which consists of PRR, adapter protein
Introduction
21 apoptosis-associated speck-like protein (ASC) and caspase 1 (Casp-1). The inflammasome activates gasdermin D (GSDMD) resulting in membrane pores and the release of the pro- inflammatory cytokines interleukin (IL)-1β and IL-18.
2.5.3 Ferroptosis
Ferroptosis is a regulated form of necrosis that is induced by an overload of iron. Iron is essential in the Fenton reaction, which leads to the production of ROS in antibacterial immune reactions. Under normal conditions, the toxic lipid peroxides generated by an interaction between Fenton reaction-mediated hydrogen peroxides and membrane lipids would be degraded by glutathione peroxidase-4 (Gpx4). However, a dysfunction of Gpx4 causes an accumulation of lipid peroxides and results in membrane disruption.
Gpx4 is a lipid repair enzyme that reduces lipid peroxides through glutathione (GSH) oxidation. Therefore, ferroptosis is characterized by reduced Gpx4 activity and GSH levels, as well as increased iron and lipid peroxide levels (Stockwell et al., 2017).
Ferroptosis can be inhibited by lipid peroxidation inhibitors, such as ferrostatin-1.
The role of ferroptosis in Mtb-mediated host cell death is not well described. Iron is an important bioactive metal for bacterial growth. Limited iron levels reduce the growth of most pathogens (Schaible et al., 2002). Mtb infection induces heme oxygenase-1, an enzyme responsible for the degradation of heme to free iron, to increase the production of iron and thus the growth of the bacteria (Shiloh et al., 2008).
2.5.4 Necrotic cell death and mitochondria
Another form of regulated necrosis is mitochondrial-driven necrotic cell death. The permeabilization of the inner mitochondrial membrane (IMM) causes mitochondrial permeability transition (MPT). The opening of the mitochondrial permeability transition pore (mPTP) disrupts the mitochondrial membrane potential (ΔΨm) by an influx of ions and finally results in a loss of mitochondrial integrity. By now, the only identified regulator of the mPTP is the mitochondrial protein cyclophilin D (CypD). It has been shown that virulent Mtb induces MPT in a CypD-dependent manner (Gräb et al., 2019;
Zhao et al., 2017).
2.6 Aim
The emergence and prevalence of drug resistant Mtb strains remains a public health
crisis and has intensified research efforts to develop alternative therapeutic
approaches, including host-directed therapies (HDT) to assist antibiotic treatment. As
a pathogen, Mtb is highly adapted to humans as a host and continuously evades and
Introduction
22 exploits the human immune system. Therefore, Mtb strongly influences gene expression and signaling pathways of the host cell using different virulence factors. A major mechanism of pathogenesis in a TB infection is the induction of host cell death.
However, the type of cell death triggered by Mtb and its role during the infection is still a matter of debate. Further knowledge of the host-pathogen interaction could thereby provide new targets for therapies. These targets include the promotion of phagolysosomal fusion, or the inhibition of the pro-inflammatory pathways triggered by Mtb. Several drugs can be re-purposed for adjunct immunotherapies in TB treatment.
The promotion of phagolysosomal fusion has been reported to be enhanced by metformin, a type 2 diabetes drug (Oglesby et al., 2019), while the tyrosine kinase inhibitor imatinib has been shown to reduce the bacterial load in Mtb-infected patients (Napier et al., 2011). Another potential drug for a HDT are the immunosuppressive corticosteroids, which reduce the mortality of TB meningitis patients (Schutz et al., 2018). So far, host cell death induced by Mtb has not been exploited as a target for HDT.
Thus, the aim of this thesis is to investigate the role of different host cell death pathways
induced by virulent Mtb and to find potential candidates for therapeutic interventions.
Materials
23 3. Materials
3.1 Equipment Table 1. Equipment
Equipment Manufacturer
Centrifuge Z 446 Hermle Labortechnik
CKX41 inverted microscope Olympus
CO2 Incubator with SafeCell Sanyo
Cytation 3 Cell Imaging Multi-Mode Reader Biotek
Curix 60 AGFA
GENESYS™ 20VIS spectrophotometer Thermo Fisher Scientific Heraeus™ Fresco™ 21 centrifuge Thermo Fisher Scientific Hidex Sense multimodal microplate reader Hidex
IX81 inverted microscope Olympus
Class II biological safety cabinet Golden Line Kojair
Light Cycler Roche
LC Carousel Centrifuge 2.0 Roche
MACS Multistand Miltenyi Biotec
MACSxpress Separator Miltenyi Biotec
MACSmix™ Tube Rotator Miltenyi Biotec
MidiMACS Separator Miltenyi Biotec
MultiskanTM FC Microplate Photometer Thermo Fisher Scientific MyCyclerTM thermal cycler system Bio-Rad
NanoDrop spectrophotometer Thermo Fisher Scientific
OctoMACS
TMSeparator Miltenyi Biotec
ScanLaf Mars Pro class 2 safety cabinet LaboGene
Thermomixer Eppendorf comfort Thermo Fisher Scientific Trans-Blot® Turbo™ Transfer System Bio-Rad
Water bath SW22 Julabo GmbH
Vortexing device Scientific Industries, Inc.
Materials
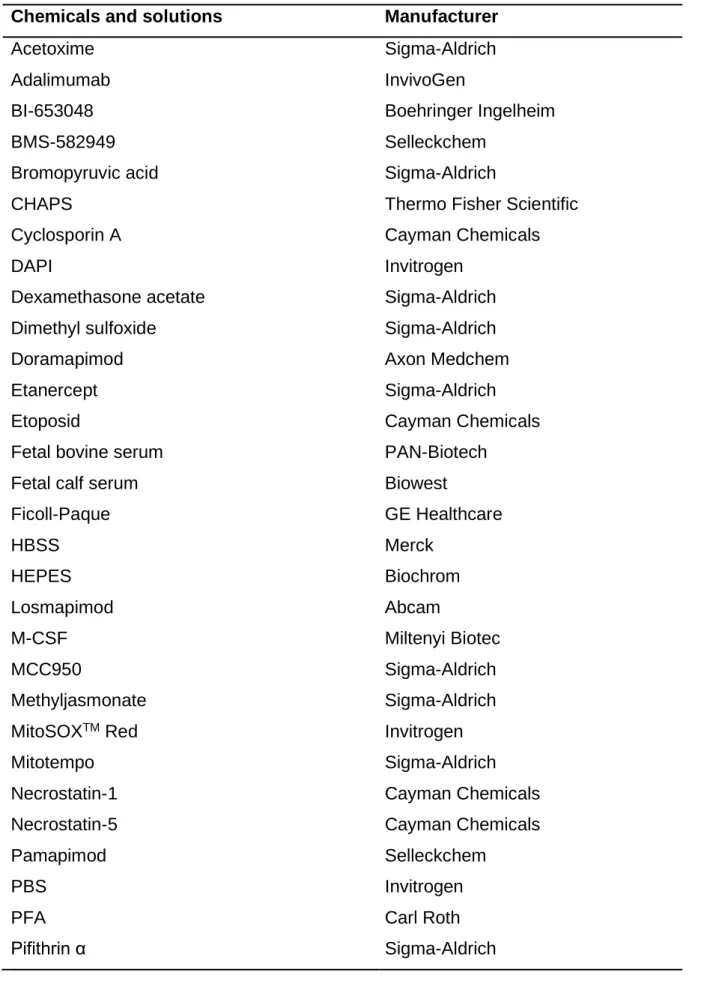
24 3.2 Chemicals
Table 2. Chemicals and solutions
Chemicals and solutions Manufacturer
Acetoxime Sigma-Aldrich
Adalimumab InvivoGen
BI-653048 Boehringer Ingelheim
BMS-582949 Selleckchem
Bromopyruvic acid Sigma-Aldrich
CHAPS Thermo Fisher Scientific
Cyclosporin A Cayman Chemicals
DAPI Invitrogen
Dexamethasone acetate Sigma-Aldrich
Dimethyl sulfoxide Sigma-Aldrich
Doramapimod Axon Medchem
Etanercept Sigma-Aldrich
Etoposid Cayman Chemicals
Fetal bovine serum PAN-Biotech
Fetal calf serum Biowest
Ficoll-Paque GE Healthcare
HBSS Merck
HEPES Biochrom
Losmapimod Abcam
M-CSF Miltenyi Biotec
MCC950 Sigma-Aldrich
Methyljasmonate Sigma-Aldrich
MitoSOX
TMRed Invitrogen
Mitotempo Sigma-Aldrich
Necrostatin-1 Cayman Chemicals
Necrostatin-5 Cayman Chemicals
Pamapimod Selleckchem
PBS Invitrogen
PFA Carl Roth
Pifithrin α Sigma-Aldrich
Materials
25 PrestoBlue
TMCell Viability Reagent Thermo Fisher Scientific
Puromycin dihydrochloride Carl Roth
Resazurin sodium salt Sigma-Aldrich
Rifampicin AppliChem
Ru-360 Sigma-Aldrich
SDS Sigma-Aldrich
Staurosporine Sigma-Aldrich
Tacrolimus (FK506) Cayman Chemicals
Thalidomide Sigma-Aldrich
TMRM Sigma-Aldrich
Triton X Sigma-Aldrich
Trypan blue Invitrogen
Z-VAD-FMK Selleckchem
3.3 Consumables Table 3. Consumables
Consumables Manufacturer
Adhesive gas permeable seal Thermo Fisher Scientific Bottle-top-filter 0.2 µm Thermo Fisher Scientific CellBIND microplate (96-well) Corning
Cell scraper Corning
Cell strainer Corning
Conical centrifuge tube (15 and 50 ml) Greiner Bio-One
Cryo vial Greiner Bio-One
LS and MS columns for MACS Miltenyi Biotec Microcentrifuge tube (1.5 and 2 ml) Eppendorf Microtiter plate (6- and 96-well) TPP
SealPlate
®sealing films Excel Scientific
Sterile filter storage bottle Thermo Fisher Scientific Tissue culture dish and flask TPP
Adhesive gas permeable plate seals Thermo Fisher Scientific
Transfer pipette (5, 10 and 25 ml) Sarstedt
Materials
26 3.4 Media and buffer
7H9 complete medium (7H9c) Middlebrook 7H9 Broth Base
10% albumin dextrose catalase (ADC) 0.05% Tween 80
0.2% glycerol
7H10 complete medium Middlebrook 7H10 Agar Base 10% ADC
0.5% glycerol
DMEM/ FBS DMEM
10% FBS
MACS buffer PBS
2% FBS 2 mM EDTA
MEM complete medium (MEMc) MEM with GlutaMAXTM 10% FBS
1% sodium pyruvate
1% non-essential amino acids
RPMI 1640/ FBS RPMI 1640 with L-glutamine
10% FBS
RPMI 1640/ FBS/ M-CSF RPMI 1640 with L-glutamine 10% FBS
50 ng/ ml M-CSF VLE-RPMI 1640 complete medium
(RPMIc)
VLE- RPMI 1640 10% FCS
10 mM HEPES 2 mM L-glutamine 1 mM sodium pyruvate
10 µg/ ml penicillin/ streptomycin 15% M-CSF
TBST 10 mM Tris
150 mM NaCl
1% Tween 20
Materials
27 3.5 Kits and reagents
Table 4. Commercial kits and reagents
Kit Manufacturer
20X LumiGLO
®Reagent and 20X Peroxide
Cell Signaling Technology
Caspase-Glo
®3/7 Assay Promega
CellTiter-Glo
®2.0 Assay Promega
CD14 MicroBeads, human Miltenyi Biotec
Fluo-4 NW Calcium Assay Kit Thermo Fisher Scientific Halt™ Protease and Phosphatase Inhibitor
Cocktail
Thermo Fisher Scientific
HMGB1 ELISA IBL International GmbH
Light Cycler Fast Start DNA MasterPLUS SYBR Green
Roche
Mitochondria Isolation Kit for Mammalian Cells Thermo Fisher Scientific Pierce™ BCA Protein Assay Thermo Fisher Scientific Pierce™ LDH Cytotoxicity Assay Thermo Fisher Scientific PrestoBlue™ Cell Viability Reagent Thermo Fisher Scientific RIPA lysis and extraction buffer Thermo Fisher Scientific
RNeasy Mini Kit Qiagen
SuperScript III First-Strand Synthesis SuperMix Thermo Fisher Scientific Trans-Blot
®Turbo™ RTA Mini PVDF Transfer Kit Bio-Rad
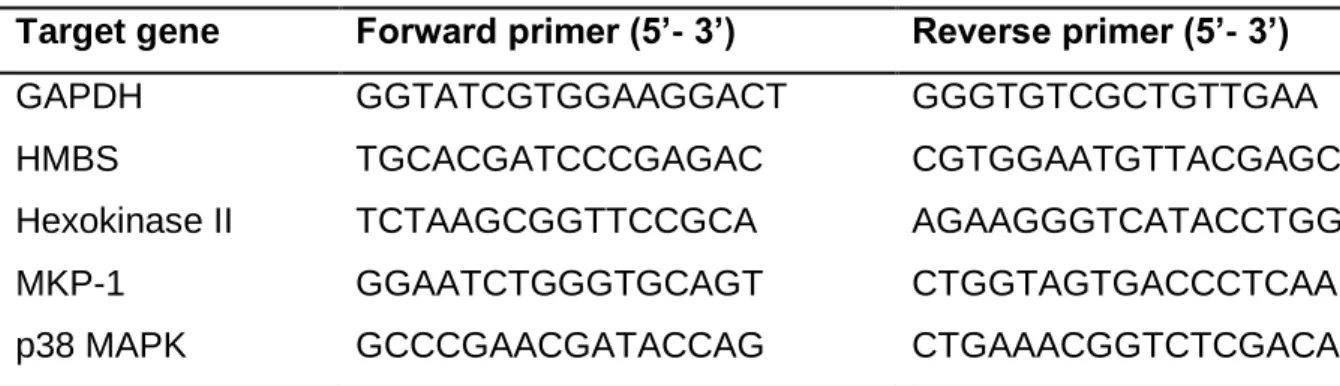
3.6 Primer
Table 5. Primers for quantitative real-time polymerase chain reaction (PCR)
Target gene Forward primer (5’- 3’) Reverse primer (5’- 3’)
GAPDH GGTATCGTGGAAGGACT GGGTGTCGCTGTTGAA
HMBS TGCACGATCCCGAGAC CGTGGAATGTTACGAGC
Hexokinase II TCTAAGCGGTTCCGCA AGAAGGGTCATACCTGG
MKP-1 GGAATCTGGGTGCAGT CTGGTAGTGACCCTCAA
p38 MAPK GCCCGAACGATACCAG CTGAAACGGTCTCGACA
Materials
28 3.7 Antibodies
Table 6. Western blot antibodies
Target protein Manufacturer
β-Actin Cell Signaling Technology
Caspase 3 Cell Signaling Technology
Cleaved caspase 3 Cell Signaling Technology
Cyclophilin D Abcam
ERK Cell Signaling Technology
Hexokinase II Cell Signaling Technology
JNK Cell Signaling Technology
p38 MAPK Cell Signaling Technology
Phosphor ERK Cell Signaling Technology
Phosphor JNK Cell Signaling Technology
Phosphor p38 MAPK Cell Signaling Technology
VDAC-1 Cell Signaling Technology
3.8 Cell lines Table 7. Cell lines
Cell line Provider
J774A.1: mouse Mᴓ ATCC - LGC Standards
J774.2: mouse Mᴓ Sigma-Aldrich
MRC-5: human lung fibroblast Coriell Institute for Medical Research p38 MAPK knockdown J774A.1 Christian Pallasch, University of Cologne p53 knockdown J774A.1 Christian Pallasch, University of Cologne 3.9 Primary mouse cells
Cells from various knockout mice (MLKL
−/−, TNFR1
−/−) or knockin mice (Bcl-2) were a kind gift of Hamid Kashkar and Manolis Pasparakis (University of Cologne, Cologne, Germany).
3.10 Bacteria
Mycobacterium tuberculosis Erdman
Materials
29 3.11 Software
Table 8. Software
Software Provider
Adobe creative suit 5 Adobe
cellSens Standard Olympus
Fiji, ImageJ 1.46h Wayne Rasband
Gen3 Software BioTek
GraphPad Prism 5.04 GraphPad Software
Office 365 Personal Microsoft
Methods
30 4. Methods
4.1 Cell biology methods 4.1.1 Culturing of cell lines
All cell lines were grown in tissue culture flasks at 37 °C with 5% CO
2. For frozen cell stocks, the cells were resuspended in medium containing 5% DMSO and 95% FBS and stored in cryo-vials at -150 °C.
4.1.1.1 J774A.1 and J774.2 macrophages
J774A.1 Mᴓ and J774.2 Mᴓ were grown in DMEM supplemented with 10% FBS. Both cell lines were passaged twice a week at a ratio of 1:4.
4.1.1.2 MRC-5 fibroblasts
MRC-5 human lung fibroblasts were cultured in MEMc medium. Cells were sub- cultured when reaching 100% confluency. After culturing the cells for 10 days, the cells were passaged by seeding 1.5 x 10
6cells per culture flask.
4.1.2 Isolation of single cell suspensions
Single cell suspensions were gained from human peripheral blood and mouse bone- marrow as follows. Primary cells were cultured at 37 °C with 5% CO
2.
4.1.2.1 Isolation of peripheral blood mononuclear cells
Blood samples were obtained from healthy volunteers as well as patients with active TB before therapy was initiated. The study was approved by the University of Cologne Ethics Committee (18-079). Patients as well as healthy volunteers participated after giving written informed consent
Human peripheral blood mononuclear cells (PBMC) were isolated from venous blood using density centrifugation. Briefly, blood was diluted with RPMI supplemented with 10% FBS at a ratio of 1:1 and layered over Ficoll-Paque. After centrifugation (540 x g, 20 min), the interphase, containing lymphocytes (B cells, T cells and NK cells), monocytes and dendritic cells (DC), was collected and centrifuged (650 x g, 10 min).
PBMC were washed three times with RPMI supplemented with 10% FBS (300 x g, 10 min). Following Ficoll-Paque separation of PBMC from granulocytes and erythrocytes, the number of PBMC was determined using the hemacytometer as described in 4.2.3.
Monocytes were isolated by magnetic separation of CD14
+cells from unlabelled cells.
Methods
31 Therefore, CD14 micro beads were added to gain a defined number of monocytes from the PBMC population. CD14
+monocytes were counted and seeded in RPMI medium supplemented with 10% FBS and 50 ng/ml human macrophage colony-stimulating factor (M-CSF) at a density of 1 x 10
5cells per well in 96-well plates. Following differentiation of monocytes into Mᴓ, the growth medium was changed to RPMI supplemented with 10% FBS.
4.1.2.2 Isolation of bone marrow-derived macrophages from mice
Bone marrow-derived Mᴓ (BMDM) were isolated from C57BL/6 mice by expelling the bone marrow from femurs and tibia with RPMI by needle. Following centrifugation (400 x g, 10 min) cells were plated in dishes and incubated at 37 °C and 5% CO
2. BMDM were differentiated in RPMIc for 7 days with fresh medium being added after 5 days.
Cells were seeded at a density of 8 x 10
4cells per well in 96-well plates.
4.1.3 Determination of cell numbers
The cell suspensions were diluted with Trypan blue and the numbers of cells were counted using a hemocytometer. The total number of cells was determined by multiplying the number of living cells with the volume of the cell suspension, the dilution factor, and the volume expansion factor of the hemocytometer (10
4).
4.1.4 Survival Assay
4.1.4.1 Fibroblast survival assay
MRC-5 lung fibroblasts were analyzed using the fibroblast survival assay (FSA).
Therefore, compounds were pre-plated into 96-well plates at different concentrations.
MRC-5 fibroblasts were harvested and seeded at a density of 2 x 10
4cells per well and could adhere for 2 h. Afterwards, cells were infected with multiplicities of infection (MOI of 10) for three days. Cell survival was analyzed by measuring the fluorescence signal of PrestoBlue
TM(10% final concentration) in a Cytation 3 Cell Imaging Multi-Mode Reader.
4.1.4.2 Macrophage survival assay
Survival of Mᴓ was assessed using fluorescence microscopy. Primary cells were plated as mentioned beforehand (4.1.2) and J774A.1 and J774.2 Mᴓ were plated at a density of 2 x 10
4cells per well in 96-well plates containing different compounds.
Following 2 h of pre-treatment, J774 and BMDM were infected with Mtb Erdman with
Methods
32 a MOI of 3 and human Mᴓ were infected with a MOI of 1. After 48 h, cells were washed several times with PBS, fixed with 4% PFA and stained with DAPI.
4.1.5 Fluorescence microscopy
Images were acquired on an IX81 inverted microscope using cellSens standard software and the number of surviving cells was determined using Fiji processing software to count the number of stained nuclei. Mtb-infected cells were fixed with 4%
PFA prior to microscopy.
4.1.5.1 Measurement of mitochondrial membrane potential
J774.2 Mᴓ were seeded at a density of 2 x 10
4per well in a 96-well plate and infected with Mtb Erdman (MOI 5) for 24 h and 48 h, respectively. Cells were washed several times with PBS before adding Tetramethylrhodamine-methyl ester (TMRM) at a final concentration of 100 nM. Cells were incubated at 37 °C in 5% CO
2for 30 minutes and washed with PBS. For microscopy, cells were covered with PBS. The accumulation of TMRM in the mitochondrial matrix represents a stable mitochondrial membrane potential, while a loss of membrane potential results in a release of TMRM from mitochondria.
4.1.6 Isolation of mitochondria
Mitochondria were isolated from infected MRC-5 lung fibroblasts or J774.2 Mᴓ using the Mitochondria Isolation Kit for Cultured Cells (Thermo Fisher Scientific). After 5 h and 24 h of infection, cells were washed twice with PBS and detached from the culture flask with a cell scraper. Mitochondria of 1 x 10
7cells were isolated using the reagent- based method. Separation of the mitochondrial and the cytosolic fraction of samples was achieved by centrifugation (12 000 x g, 15 min, 4 °C). Thereafter, the mitochondria were lysed with 2% CHAPS in TBS (25 mM Tris, 150 mM NaCl, pH 7.2), containing Halt™ Protease and Phosphatase Inhibitor Cocktail. Both fractions were stored at -80
°C and the purity of the mitochondrial fraction was analyzed by Western blotting.
4.2 Molecular biology methods
4.2.1 Culture conditions of Mycobacterium tuberculosis
Mtb was grown in Middlebrook 7H9 broth or 7H10 agar plates. Freezer stocks were
thawed and grown in 7H9c medium at 37 °C and 100 rpm until reaching an optical
density of 1 at a wavelength of 560 nm (OD
560). Cells were infected with washed
logarithmic-phase Mtb at varying MOI.
Methods
33 4.2.2 Determination of colony-forming units
The colony-forming unit (CFU) of Mtb-infected J774.2 Mᴓ was determined 5 days post infection. 5 x 10
3cells were seeded in 96-well plates, pretreated with different compounds for 2 h, and infected with Mtb Erdman (MOI 2) for 24 h. The CFU of Mtb- infected BMDM was also analyzed 5 days post infection. Therefore, 8 x 10
4BMDM were seeded in 96-well plates and infected with Mtb Erdman (MOI 1) for 5h.
Subsequently, cells were washed twice with PBS to remove unphagocytosed bacteria and fresh medium containing the different compounds was added. Plates were incubated at 37 °C in 5% CO
2for 5 days and the cells were lysed with 0.1% SDS.
Viable bacteria were grown in serial dilutions on 7H10 agar plates and colonies were counted after 10 to 14 days of incubation at 37 °C.
4.2.3 Lactate dehydrogenase release assay
The release of lactate dehydrogenase (LDH) was measured utilizing the Pierce™ LDH Cytotoxicity Assay Kit conducted according to the manufacturer’s recommendations.
Therefore, MRC-5 lung fibroblasts or J774.2 Mᴓ were harvested, seeded in a 96-well plate (2 x 10
4cells per well) containing different compounds. After 2 h of pre-treatment, cells were infected with Mtb Erdman at a MOI of 10 and 5, respectively. Following 24 h, 48 h and 72 h of infection, the release of LDH into the supernatant was detected by measuring the reduction of tetrazolium salt to a red formazan product in a BioTek Cytation™ 3 Cell Imaging Multi-Mode Reader.
4.2.4 Caspase activity assay
The activity of caspase 3 and caspase 7 was measured with the Caspase-Glo
®3/7 Assay according to the manufacturer’s instructions. Compounds were pre-plated into white-walled 96-well plates, before MRC-5 or J774.2 Mᴓ were seeded at a density of 2 x 10
4cells per well. Following adherence of the cells, MRC-5 lung fibroblasts (MOI 10) and J774.2 Mᴓ (MOI 5) were infected with Mtb Erdman. Infected cells were incubated up to 48 h at 37 °C in 5% CO
2. The Caspase-Glo
®Reagent was added to the wells 24 h and 48 h post infection and luminescence was measured in a BioTek™ Cytation™ 3 Cell Imaging Multi-Mode Reader.
4.2.5 Adenosine triphosphate assay
The CellTiter-Glo
®2.0 Assay was conducted according to the manufacturer’s
recommendations to measure the level of intracellular ATP. Harvested MRC-5 lung
fibroblasts and J774.2 Mᴓ were seeded in white-walled 96-well plates at a density of 2
Methods
34 x 10
4cells per well and pretreated for 2 h with different compounds. Afterwards, MRC- 5 fibroblasts (MOI 10) and J774.2 Mᴓ (MOI 5) were infected with Mtb Erdman and the amount of ATP was quantified by adding the CellTiter-Glo
®2.0 reagent 24 h and 48 h post infection. The luminescent signal was measured in a BioTek Cytation™ 3 Cell Imaging Multi-Mode Reader.
4.2.6 Quantification of calcium
Intracellular calcium concentration was determined using the Fluo-4 NW Calcium Assay Kit according to the manufacturer’s instructions. Cells were plated at a density of 2 x 10
4cells per well in black-walled 96-well plates and pre-treatment of the given compound was applied 2 h prior to infection with Mtb Erdman at varying MOI for up to 24 h. Cells were washed once with HBSS and incubated with Fluo-4 NW for 30 min at 37 °C. Fluo-4 NW (Ex/ Em 488 nm/ 530 nm) was immediately detected following incubation using a BioTek Cytation™ 3 Cell Imaging Multi-Mode Reader. Calcium was quantified by calculating the ratio of the ion-bound (Ex 340 nm) and ion-free indicators (Ex 380 nm).
4.2.7 Quantification of reactive oxygen species
ROS production in the mitochondria was detected by MitoSOX Red, a superoxide indicator. Cells were plated at a density of 2 x 10
4cells per well in black-walled 96-well plates and pre-treatment of the given compound was applied 2 h prior to infection with Mtb Erdman at varying MOI for up to 24 h. Rotenone (50 µM), an inhibitor of the complex I of the electron transport chain, was used as a positive control. The medium was removed, and cells were washed with HBSS. Afterwards, cells were incubated with MitoSOX Red (5 µM in HBSS) at 37 °C for 15 min. Following incubation, cells were washed three times with HBSS and fluorescence was detected in a BioTek Cytation™ 3 Cell Imaging Multi-Mode Reader. Cell-specific fluorescence was calculated by subtracting the fluorescence of cell-free wells containing HBSS.
4.2.8 Isolation of RNA
RNA was isolated from whole cell lysates. Therefore, 1 x 10
6MRC-5 lung fibroblasts
or J774.2 Mᴓ were seeded in a 6-well plate and infected with Mtb Erdman at a MOI of
10 and 5, respectively. Following 5 h and 24 h of infection, cells were washed twice
with PBS and lysed with RLT buffer containing β-mercaptoethanol. Total RNA was
isolated with the RNeasy Mini Kit according to the manufacturer’s instructions and
Methods
35 quantification of RNA was done using a NanoDrop spectrophotometer. All samples had A260/ A280 ratios of 1.90 to 2.10.
4.2.9 Synthesis of cDNA
Following isolation of total RNA, first-strand cDNA was synthesized with the SuperScript III First-Strand Synthesis SuperMix for qRT-PCR. Reaction mix, containing random hexamers, oligo(dT) and magnesium chloride, as well as enzyme mix, containing M-MLV RT and a recombinant ribonuclease inhibitor (RNaseOUT™), was added to the RNA. The samples were first incubated at room temperature for 10 min prior to cDNA synthesis conducted at 50 °C for 30 min. The reaction of the reverse transcriptase was stopped by heating the samples for 5 min at 85 °C. Finally, Escherichia coli RNase H was added, and the cDNA was incubated for 20 min at 37
°C. The cDNA was transferred into 1.5 ml tubes and stored at -20 °C until further use.
4.2.10 Quantitative real-time PCR
Quantitative real-time PCR was conducted to compare the relative amount of the expression of different genes. Therefore, the Light Cycler Fast Start DNA MasterPLUS SYBR Green Kit was used. SYBR Green is a DNA binding fluorescent probe, which integrates itself into double stranded DNA, causing a fluorescent signal. The fluorescent signal generated during each cycle is proportional to the amount of generated PCR product. The relative quantification was done by comparative Cp method. Hence, the Cp values of each sample were normalized against the Cp values of the house-keeping genes glyceraldehyde 3-phosphate dehydrogenase (GAPDH) or hydroxymethylbilane synthase (HMBS). Additionally, a melting curve analysis was performed to eliminate non-specific amplification.
4.3 Biochemical methods
4.3.1 Enzyme-linked immunosorbent assay
The HMGB1 ELISA kit (IBL International) was utilized to measure the release of the protein HMGB1. 1 x 10
6MRC-5 lung fibroblasts were seeded in a 6-well plate and allowed to adhere overnight. The following day cells were infected with Mtb Erdman (MOI 10) and incubated for 48 h at 37 °C in 5% CO
2prior to collecting the supernatant.
The samples were processed according to the manufacturer’s protocol. Briefly, the
samples were transferred into a 96-well plate pre-coated with polyclonal anti-HMGB1
and incubated for 24 h at 37 °C. Thereafter, HMGB1 conjugated to peroxidase was
Methods
36 added to the samples, the plate was incubated for 2 h at 25 °C, and TMB substrate solution was used for detection. The absorbance was measured and analyzed using the Multiskan™ FC Microplate Photometer with internal software.
4.3.2 Immunoblot analysis
For immunoblot analysis whole cell lysates were gained from MRC-5 lung fibroblasts or J774.2 Mᴓ. 1 x 10
6cells were seeded in 10 cm culture dishes and allowed to adhere for at least 24 h. Prior to infection with Mtb Erdman cells were pretreated with different compounds for 2 h. Whole cell lysates were obtained 5 h, 24 h and 48 h post infection from MRC-5 lung fibroblasts and 5 h, 24 h and 30 h post infection from J774.2 Mᴓ using RIPA lysis and extraction buffer containing Halt™ Protease and Phosphatase Inhibitor Cocktail. The samples were detached from the culture flask with a cell scraper and incubated on ice for 20 min. Subsequently, the samples were centrifuged (12000 x g, 10 min, 4°C) and the supernatant containing the proteins was stored at -80 °C until further use. The protein concentration was measured with the Pierce™ BCA Protein Assay Kit and equal amounts of protein (15–20 µg) were loaded onto a SDS- polyacrylamide gel and separated by gel electrophoresis. Afterwards, the proteins were transferred to a PVDF membrane using the Trans-Blot
®Turbo™ Transfer System. The membrane was blocked with 5% dried milk or 5% BSA in TBST buffer and was incubated with primary antibodies at 4 °C overnight. The following day, the membranes were washed three times for 5 minutes with TBST and incubated for 1 h at room temperature with the corresponding secondary, horseradish peroxidase- conjugated, antibody. Visualization of the transferred proteins was achieved with the 20X LumiGLO
®Reagent, and X-ray films were processed in a Curix 60.
4.4 Statistical analysis
Data are displayed as mean ± standard error of the mean (SEM). The data were analyzed with the Graphpad Prism version 5 software program. The unpaired t-test was used to compare two matched groups and the One-Way analysis of variance (ANOVA) with Bonferroni posttests was used to compare more than two groups.
Differences with the following p values p < 0,05 (*), p < 0,01 (**) and p < 0,001 (***)
were defined as statistically significant.
Results