REVIEW
Application of multi-modal 2D and 3D
imaging and analytical techniques to document and examine coins on the example of two
Roman silver denarii
Mona Hess1* , Lindsay W. MacDonald2 and Jaroslav Valach3
Abstract
This case study is applying imaging and analytical techniques from multiple scientific disciplines to digitise coins and evaluate 3D multi-modal visualisation. Two ancient Roman silver denarii were selected as test objects to establish whether the proposed digital recording methods can support professional numismatic comparison of features and properties. The coins raise questions concerning their provenance, authenticity, design, purpose of issue and historic usage, but they also pose considerable recording challenges due to their material and surface properties, which are the main focus in this paper. The coins have been examined by the following techniques: dome photography for image sets for PTM/RTI visualisation and photometric stereo; X-ray microtomography for detection of cracks or impurities; Scanning Electron Microscopy for detailed surface investigation; Energy-Dispersive X-ray Spectroscopy for elemental analysis; micro X-ray fluorescence spectrometry mapping; 3D laser and structured light scanning for 3D spatial capture; photogrammetry/structure from motion, focus-stacking. The results indicate the feasibility of such techniques for museum documentation and as contribution to scientific examination of coins in general.
Keywords: 3D scanning, Focus-stacking, MicroCT, Numismatic, Photogrammetry, Photometric stereo, PTM/RTI, SEM/
EDX, SfM, XRF
© The Author(s) 2018. This article is distributed under the terms of the Creative Commons Attribution 4.0 International License (http://creativecommons.org/licenses/by/4.0/), which permits unrestricted use, distribution, and reproduction in any medium, provided you give appropriate credit to the original author(s) and the source, provide a link to the Creative Commons license, and indicate if changes were made. The Creative Commons Public Domain Dedication waiver (http://creativecommons.org/
publicdomain/zero/1.0/) applies to the data made available in this article, unless otherwise stated.
Open Access
*Correspondence: Mona.Hess@uni-bamberg.de
1 Digital Technologies in Heritage Conservation, Institute of Archaeology, Heritage Conservation and Art History, Otto-Friedrich University of Bamberg, Am Zwinger 4, 96047 Bamberg, Germany Full list of author information is available at the end of the article
Background
Multi-modal 2D and 3D imaging together with other analytical techniques were applied to document and examine coins, an approach that has been demonstrated in other Heritage Science projects [1]. The case study was undertaken by a group of scientists, cultural herit- age researchers, conservators and museum professionals participating in the European network, Colour and Space in Cultural Heritage (COSCH), supported by the pro- gramme for European Cooperation in Science and Tech- nology (COST-Action TD1201) [2].
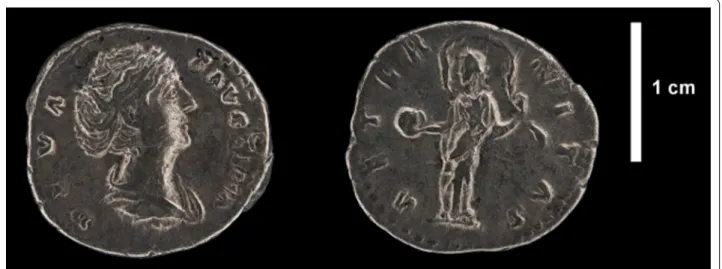
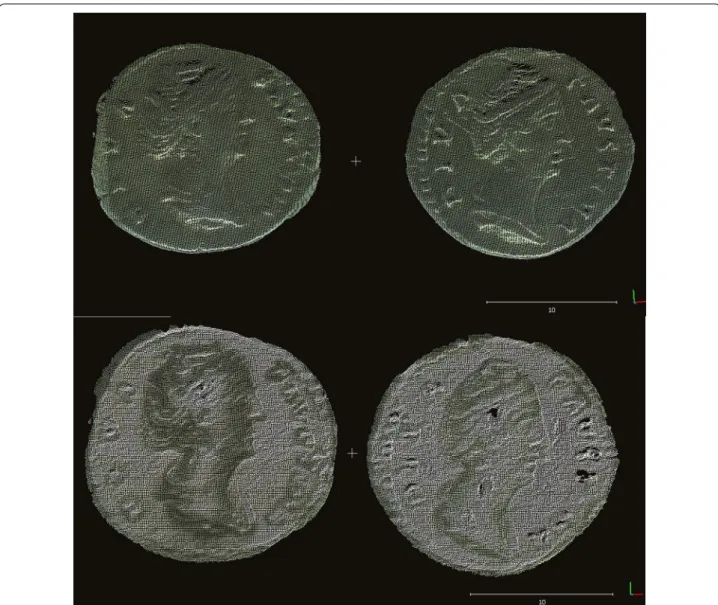
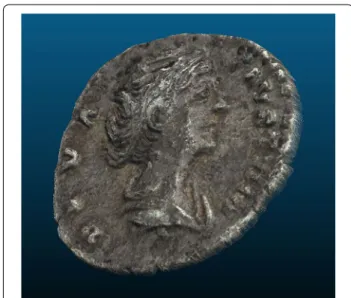
The test objects for this study were two silver dena- rii (Coins A and B) portraying Empress Favstina I, wife of Antoninus Pius, believed to be posthumous deifica- tion issues of 141 AD. The obverse of both coins shows the bust of the empress, facing right, with raised inscrip- tion DIVΛ FΛVSTINΛ. The portrayal on Coin A is rather more flattering to a lady who was famous for her beauty. The designs on the reverse faces are different:
Coin A shows Aeternitas (or perhaps Urania) holding a globe in her right hand, with palla billowing out around her head, and is inscribed ΛETER-NITΛS; Coin B shows Vesta, holding the palladium in her right hand, sceptre in left, and is inscribed VES-TΛ. Each coin is approxi- mately 17 mm in diameter and 1.5 mm thick (see Fig. 1).
These two ancient Roman silver denarii were selected as test objects to establish whether the proposed optical and spectrometric recording methods and techniques could support professional comparison of features and
properties. The coins, as example for this type of object, raise questions concerning their provenance, authen- ticity, design, purpose of issue and historic usage which have been explored elsewhere. They also pose consid- erable recording challenges due to their material and surface properties which shall be the main focus of this paper. This article is a report of the case study project and it reviews the techniques employed and summarises the results.
From a joint meeting with numismatists the follow- ing tasks for archaeologists, curators and conservators receiving new coins in their collection became evident (from personal communication from the COSCH Roman Case study meeting on 22 June 2016 at University College London. Participants, see Acknowledgements):
(a) Knowledge about the archaeological context of the coins, including provenance, site, stratigraphic layer, environment accrual, which also helps dating and authentication;
(b) Gentle cleaning and conservation of the surface for identification and cataloguing of coins, especially if found in large quantities (e.g., a block-lifted hoard), as well as information about readability and stability of the coin;
(c) Knowledge about type of a coin (e.g., portray, legend, border, flipping; shape, diameter, thickness, weight) and changes in time, as well as wear, corrosion and dirt classification;
(d) Identification and comparison of die patterns and tool marks, for information about provenance and workshops; Banker marks, for historical quality con- trol and validation; Mutilation marks, for validation, dislike of emperor, or loss of currency value;
(e) Information about material composition, including elemental characterization (e.g., percentage of silver), which helps to determine origination and to under- stand economic, political, social issues, such as pro- duction, trade, migration, enriching surface layer or forgery;
(f) Attribution, classification and description, for research and accessioning into the collection;
(g) Examination of authenticity and significance of a coin;
(h) More intense cleaning and conservation towards documentation for an exhibition or specific publica- tion;
(i) Production of visual and analytical evidence/imagery for research, publication and dissemination;
(j) Storage of the information in a searchable database.
From these interviews it could also be concluded that numismatic collections continue to rely on traditional documentation and analysis methods, predominantly manual measurements and 2D photography, which have limited information in terms of dimensional and spec- troscopic information. It could also be confirmed that advanced non-destructive methods for recording and examination have increasingly been introduced to con- servation and museum practices, in order to complement traditional documentation and analytical techniques, with a view to automation on some of the tasks named above, but are not the norm.
This paper summarises outcomes that can be gleaned for numismatics by the use of different heritage sci- ence methods and techniques (non-destructive imaging, physico-chemical analyses, but also conservation and data management) used on the exemplary Roman coins, can contribute to meet the tasks of numismatists named above.
Techniques and methods for documentation and analysis of coins
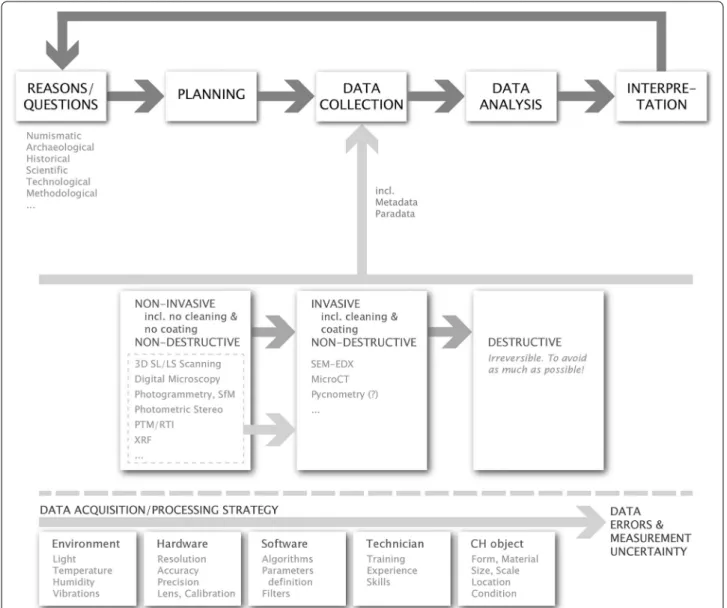
Firstly, a methodology and workflow was developed for the study. Steps towards a rigorous procedure for docu- mentation include reason(s)/question(s), planning, multimodal data collection, data analysis (extracting knowledge) and interpretation of results according to the questions. Of course, the aims for acquiring data should be clear from the beginning. The availability of particular Fig. 1 Photograph of obverse and reverse of two silver Roman denarii (a, b) depicting Diva Favstina (Lindsay W. MacDonald, UCL)
collaborators and equipment at particular times in this case study, as in every project, affected the order, type, and dates of data acquisition (see Fig. 2, [3]).
The following challenges were faced by optical tech- niques for the selected Roman coins: surface properties, small size, shallow relief, and metallic specularity. This section will first describe the techniques used to docu- ment and analyse the coins: (a) hands-on inspection and drafting; subsequently selected optical and spectrometric techniques were employed to record the surface details and internal structure of the coins and in particular (b) optical non-destructive examination and 3D record- ing, also including photography and (c) complementary physico-chemical methods for material analysis.
Hands‑on inspection and drafting
Coins found on archaeological sites are typically docu- mented by manual drawings, because the draftsman uses his or her judgement to draw only the relevant details.
Finds generally have signs of wear, dirt, corrosion, etc.
and therefore line drawings have also found widespread use as illustrations in coin catalogues. Digital photogra- phy and 2D document scanning with textual accompany- ing annotation is used to create records of coins, please see below. The finds have to be documented properly, because in general they cannot legally be taken outside the country hosting the excavation.
The study of a coin’s features has traditionally been conducted by direct hands-on examination, employing magnification tools and a strong directional light source.
Fig. 2 General framework for data acquisition, processing and analysis of historical silver coins (Vera Moitinho de Almeida)
By holding the coin under the light, and tilting it relative to the viewing direction, the surface features may be dis- cerned. Unfortunately, security concerns due to the ease of concealment, lack of unique identification, and often high resale value severely limit opportunities for this method of examination. When coins are secured in glass cabinets, even those employing mirrors and magnifying optics, the ability to perceive surface relief is significantly reduced. The quality of numismatic information that can be gleaned from a coin decreases further if in-person examination is not possible. Traditional photographic documentation conveys only a subset of the information discernible through direct physical inspection [4].
Optical non‑destructive examination and 3D recording Photography
Widely used in numismatic research and for publication illustration purposes, the use of 2D photography is the most convenient means of documentation and visualisa- tion of coins.
In the documentation of coins, images provide addi- tional information besides the written description, conveying both the visual design and the state of pres- ervation. Traditionally coins have been photographed by numismatists as 2D monochrome images, and these are of great qualitative value. But unless a standardized configuration of illumination is employed, it is difficult to use the images for quantitative analysis and com- parison. For imaging of pre-modern coins, for example, numismatic photographers have sometimes employed a light source inclined at an angle from the optical axis of the camera. This has the advantage of reducing the direct specular reflections from the metallic surface, but it produces bright reflections from gradients on one side of relief features and shadows on the other. An exam- ple of photographs of the two Roman coins is shown in Fig. 1. The images were taken by a Nikon D200 camera using a single flashlight to the upper left at an elevation of approximately 60°, giving a high-contrast image with good rendering of surface relief.
This asymmetrical rendering, which depends on both illumination and viewing angles, makes it difficult to decide whether a coin was minted by the same die. In general, the intensity, direction, and number of light sources may vary from one studio to another, leading to differences in the shadows cast, the contrast between bright and dark regions, and the rendering of surface texture. Different lighting directions may make small pat- terns on the coin, such as inscriptions and symbols, look very different, and highlights arising from specularity of the metallic surface may affect the quality of the images, especially when automatic exposure correction is ena- bled in the camera. The use of polarizing filters to reduce
specular highlights can cause undesirable birefringence effects [4]. More fundamentally, the projection of the 3D object surface onto the 2D image means that valuable information about the object is discarded, which makes it more difficult to analyse distortions arising from the striking of the coin in the die and also of subsequent wear and corrosion [5].
Because of the relatively small size, shallow relief, and metallic specularity of most coins, special techniques are needed for photography. In addition to a reproduction table with two light sources at changeable angles from the side and a DSLR camera with a good macro lens, careful attention needs to be paid to the geometry of the inci- dent illumination. In general, the raised areas of the sur- face need to be rendered in the image by tones different from those of the ground plane of the coin. This cannot be achieved in most cases by a single light source at an oblique angle, as in Fig. 1, because for a shiny surface the light is reflected away from the camera, making it appear too dark. Moreover, the reflection from the leading edge of each surface feature becomes an over-exposed specu- lar highlight, while the trailing edge is cast into shadow.
The resulting image is harsh in contrast and the gradients are strongly directional, and fine surface texture may be exaggerated.
In summary, to produce a good photography of a silver coin, mostly of shallow relief and often specular in appearance, careful attention needs to be paid to incident angle of the lighting. A setup with two lights can produce a good rendering and surface relief. Instructions for coin photography are described in Goodman [6] and Hober- man [7]. Digital photography with or without a reproduc- tion table, or even the use of flatbed scanners for reproducible lighting,1 is used today to produce 2D digi- tal images for searchable coin databases alongside textual information.
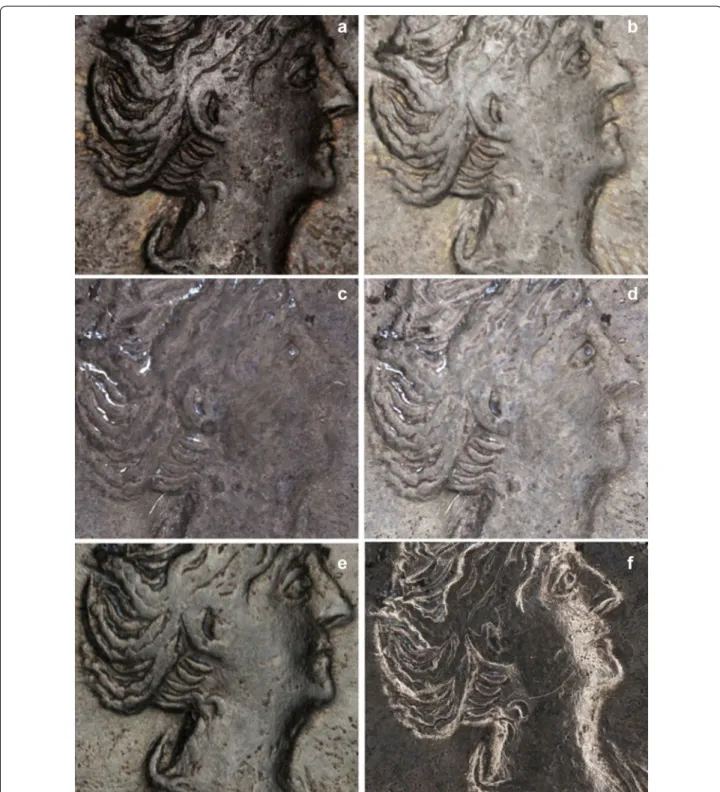
Dome photography for PTM/RTI visualisation
The re-lighting method PTM (Polynomial Texture Map- ping) was first developed by Hewlett Packard Research Laboratories [8] and immediately identified as a potential tool for cultural heritage imaging. PTM is a special case of Reflectance Transformation Imaging (RTI), a family of computational photography techniques that capture a subject’s surface shape and colour and enable the inter- active re-lighting of the subject from any light direction seen from one top-down point of view (see Fig. 3, demon- stration or PTM/RTI software in, Additional file 3: Film S3). RTI methods do not record the 3D surface directly but rather estimate the angular reflectance distribution
1 Personal Communication from the COSCH Roman Case study meeting on 22 June 2016 at University College London. Participants, see Acknowl- edgements.
at each point on the surface and hence create the illu- sion of 3D viewing of artefacts. Both technologies allow the application of imaging filters to enhance the view- ing for researchers and visitors [9] as well as inspection
of surface details and manufacture [10]. Recording in the dome enables reproducible lighting and therefore a con- trolled environment. This can potentially be used for the monitoring of colour and surface changes.
Fig. 3 Coin A, obverse (detail) of six different image dome captures (PTM/RTI) a RTI capture UCL dome; b RTI capture CyI dome; c RTI capture RBINS Minidome, albedo mode; d RTI capture RBINS Minidome, ambient mode; e RTI capture with dome at Southampton university; f for comparison of detail: a focus stacked picture (Aurore Mathys, RBINS)
For this study, six different imaging domes were used on the test coins. The comparison of these technologies was challenging due to the following variables: different equipment (dome, lens, camera, and lighting), different orientation of the coin, proprietary output formats, vari- ety of software to create RTI and viewers. Visual compar- ison and statistical methods were used to assess colour realism, specularity, impression of the dimensions, sharp- ness of rendering and appearance of the surface topology [11].
Focus stacking
Even though coins are of shallow relief, the use of focus- stacking can significantly improve the detail and read- ability of the rather small coins at high magnification, as shown in an example for test coin A, see Fig. 4.
The low cost focus stacking setup used to produce this image was composed of a closet with two diffuse flashlights positioned under the object. Pictures were taken with a Canon EOS 600D DSLR placed on a Cog- nisys Stackshot, which was mounted vertically above the object. Several pictures at different focus distances were taken for each view to be processed afterwards in a stacker software in order to achieve an extended focus picture [12].
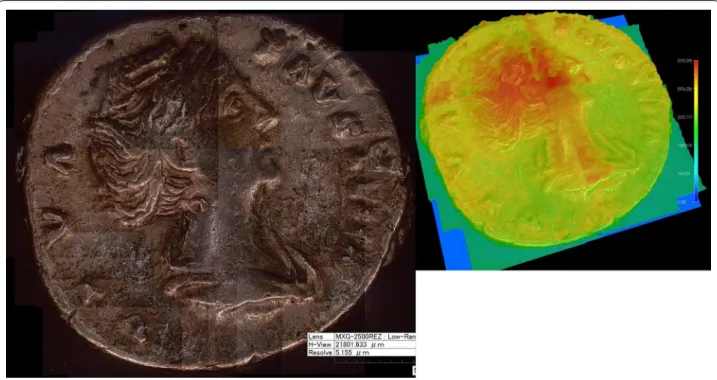
Focus stacking can also be achieved through digi- tal microscopy. The images are known of having a high standard deviation of set of pixels in the vicinity of the pixel in focus. The stacker software utilizes this rule and examines for every pixel of the image the whole stack of identically located pixels and selects the image of the highest deviation value and from this image it copies the examined pixel and its neighbours into the final image of enhanced focal depth [13].
Focus-stacking may also be accomplished by a digi- tal microscope with robotic stage. The illumination is an adjustable combination of axial and indirect (black field) light. The focus stacking and stitching are per- formed on part of the coin surface. Focus-stacking leads to high photographic detail for a 3D surface model and for remote inspection or inspection next to the coin, see Fig. 5.
Photogrammetry and structure from motion (SfM)
Digital close range photogrammetry, using a DSLR camera and lighting, is an established non-contact opti- cal technique from remote sensing and is used for the documentation of objects by aerial photogrammetry at a variety of scales, amongst them museum artefacts and heritage buildings. Photogrammetry is capable of deliver- ing high-resolution colour images ideal for the documen- tation of current condition and damages on the surface of the artefact, enabling the visualisation of details of the order of 50 μm. Structure from Motion (SfM) uses the principle that movement through a scene allows an understanding of the shape of the scene in three dimen- sions, in the same way as walking through a room allows one to visualise the space and objects placed within it. In SfM, this is represented by a series of systematic view- points; overlapping photographs are taken from multiple angles around the object, either by moving around the artefact, or by moving the object on a turntable in front of a camera on a tripod. The result will be of higher qual- ity if there is no directional lighting that produces shad- ows, for example if photographs are taken with indirect lighting to the ceiling or using a light tent acting as a diffuser with lights. The digital output is a 3D coloured point cloud, i.e. a large number of co-ordinate points in
Fig. 4 Coin A obverse and reverse, image obtained from focus stacking picture (Aurore Mathys, RBINS)
space, or a surface model, i.e. coloured polygon mesh of triangles, [14] and [15]. In summary, photogrammetry and SfM are applicable for objects of variable scale and surface properties [16] and therefore also applicable to the small Roman coins of this study.
For the surface inspection of coins this provides an interactive digital display where the coin can be magni- fied and turned around to inspect surface accretions as well as writing. Applied filters in software can enhance the viewing (see demonstration in Additional file 2: Film S2).
3D laser and structured light scanning for 3D spatial capture For small and medium size objects, 3D laser scanners and 3D structured light scanners are often used for topomet- ric data acquisition. Both systems are based on the trian- gulation principle. The coins pose two challenges to 3D scanning systems: surface resolution on a small and near- flat surface, and material specularity, i.e. shininess. The ideal object properties for the selected 3D scanner have features no smaller than its Ground Sampling Distance (GSD) or finest resolution (the distance to resolve the fin- est detail on the surface). If a scanner can record a resolu- tion of 50 μm for example, the smallest recordable and identifiable feature on the dataset will not be smaller than 100 μm. A human with acute perception would expect to see more from a close up inspection with a hand-lens, than from a 3D scan at 100 μm sampling distance.
For both, photogrammetry and 3D scanning, the ideal object surface would also be a matte (i.e. diffusely reflect- ing) surface. For the surface recording of an object like the Roman coins the challenge of a specular or shiny surface needs to be overcome, due to the glare into the optics. A strategy to record from an angular position from object to sensor might help the recording pro- cess. The difference between the points recorded on the surface from a nadir (or top down) position versus an angular recording can be seen in Fig. 6. Occlusions and transparencies can also be challenging for 3D scanners and photogrammetry, but these are not applicable here.
Recording of the thin object from the side, as well as the alignment of back and front also poses a problem with coin-like objects.
In laser scanners employing the triangulation princi- ple, the triangle is formed between the sensor with (1) an emitter/laser line projection with known angle of the emitted laser line and (2) an offset optical sensor with a known baseline, i.e. distance to the emitter and (3) the surface point where the laser line hits the object. This setup allows the measurement of adjacent points in a specific depth of field of the triangle commensurate with the sensor specifications [14]. Detailed informa- tion about the 3D laser scanners used in this study can be found in Table 1. Visual outcomes of the three dif- ferent laser scanners used in this study can be seen in Figs. 6, 7 and 8.
Fig. 5 Coin A obverse, digital microscopy (Jaroslav Valach, ITAM)
A structured light scanner is an area-based imaging technique, consisting of a projector and at least one cam- era. Instead of projecting laser lines or spots, it projects patterns of a structured light sequence (called Gray Code or Phase Shift sequence) for topometric data acquisition.
The calculation of 3D data is based on the triangulation principle; typical triangulation angles are at approxi- mately 30°. The camera is mounted in a calibrated posi- tion relative to the projector, and thus defines the base line of emitting system and measurement sensor. The scanning system projects light patterns onto the object surface. The contrast of the light patterns influences the quality of scan results (Fig. 9, [17]).
An advantage of many close-range 3D systems is that the kit can easily be transported to the site or museum.
Some are also flexible: various fields of views can be recorded with a single sensor through changing ele- ments, either camera lenses or by varying the baseline, i.e. the distance between the projector(s) and camera.
A further advantage is the speed of recording for one 3D record, the projection of all patterns lasts only a few seconds. While structured light sensors are limited by pixel count, data density and range resolution, they usu- ally deliver sub-millimetre sampling of the surface [18], some even capable of reaching resolutions in the order of 20 µm (XY) and 3 µm (Z).
See Fig. 7 for a 3D image by structured light of Coin B, where colour information could be mapped from an sen- sor-internal calibrated camera or external camera using add-on software.
Fig. 6 Coin A and B, obverse. 3D colour laser scan at 100 μm resolution, from 30° angle (top) and nadir position (bottom) (Mona Hess, UCL)
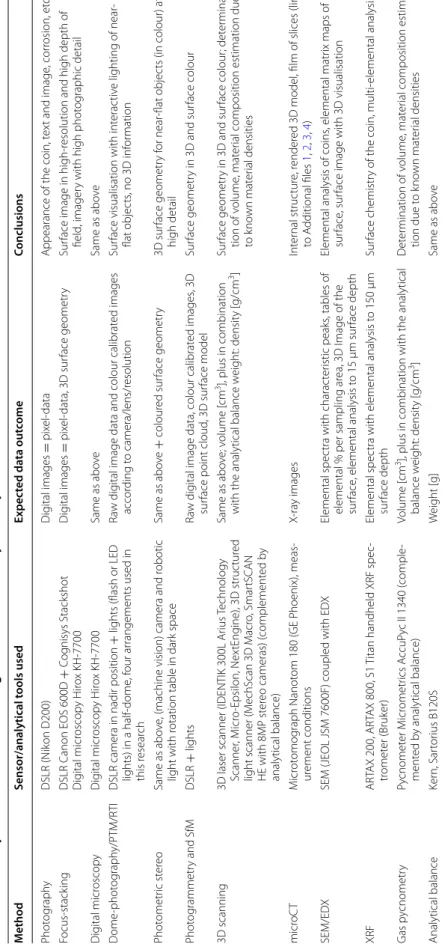
Table 1 Summary of methods and technologies used for this study with expected outcomes MethodSensor/analytical tools usedExpected data outcomeConclusions PhotographyDSLR (Nikon D200)Digital images = pixel-dataAppearance of the coin, text and image, corrosion, etc. Focus-stackingDSLR Canon EOS 600D + Cognisys Stackshot Digital microscopy Hirox KH-7700Digital images = pixel-data, 3D surface geometrySurface image in high-resolution and high depth of field, imagery with high photographic detail Digital microscopyDigital microscopy Hirox KH-7700Same as aboveSame as above Dome-photography/PTM/RTIDSLR camera in nadir position+ lights (flash or LED lights) in a half-dome, four arrangements used in this research
Raw digital image data and colour calibrated images according to camera/lens/resolutionSurface visualisation with interactive lighting of near- flat objects, no 3D information Photometric stereoSame as above, (machine vision) camera and robotic light with rotation table in dark spaceSame as above+ coloured surface geometry3D surface geometry for near-flat objects (in colour) at high detail Photogrammetry and SfMDSLR+ lightsRaw digital image data, colour calibrated images, 3D surface point cloud, 3D surface modelSurface geometry in 3D and surface colour 3D scanning3D laser scanner (IDENTIK 300L Arius Technology Scanner, Micro-Epsilon, NextEngine), 3D structured light scanner (MechScan 3D Macro, SmartSCAN HE with 8MP stereo cameras) (complemented by analytical balance)
Same as above; volume [cm3], plus in combination with the analytical balance weight: density [g/cm3]Surface geometry in 3D and surface colour; determina- tion of volume, material composition estimation due to known material densities microCTMicrotomograph Nanotom 180 (GE Phoenix), meas- urement conditionsX-ray imagesInternal structure, rendered 3D model, film of slices (link to Additional files 1, 2, 3, 4) SEM/EDXSEM (JEOL JSM 7600F) coupled with EDXElemental spectra with characteristic peaks, tables of elemental % per sampling area, 3D Image of the surface, elemental analysis to 15 μm surface depth
Elemental analysis of coins, elemental matrix maps of surface, surface image with 3D visualisation XRFARTAX 200, ARTAX 800, S1 Titan handheld XRF spec- trometer (Bruker)Elemental spectra with elemental analysis to 150 μm surface depthSurface chemistry of the coin, multi-elemental analysis Gas pycnometryPycnometer Micrometrics AccuPyc II 1340 (comple- mented by analytical balance)Volume [cm3], plus in combination with the analytical balance weight: density [g/cm3]Determination of volume, material composition estima- tion due to known material densities Analytical balanceKern, Sartorius B120SWeight [g]Same as above
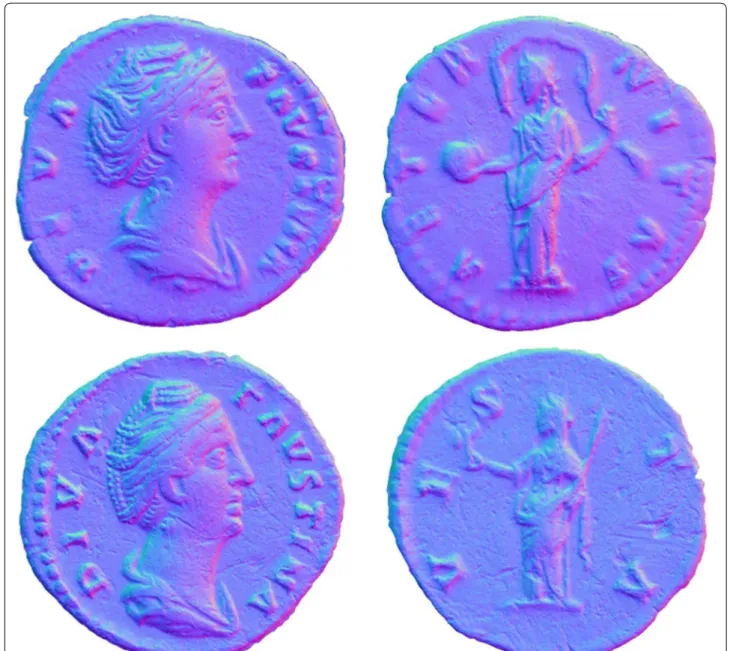
Photometric stereo
The 3D surface geometry, defined by the array of surface normal vectors, may be deduced from radiometric meas- urement of reflected light if the illumination geometry is known. This method enables the documentation of topography and visual appearance at the same time.
For this study, two setups were used:
In the first setup two representations, PTM dome images and 3D colour laser scanning were combined to produce a digital elevation map of each coin with the accuracy of the scanner and the fine detail of the photog- raphy. The result was a realistic rendering of the coins at
a spatial resolution of 75 pixels/mm (13 μm), in which the fine detail modulated the underlying geometric form of the surface relief. Results are shown in Figs. 10 and 11 (a detailed description of the method is available in [11].)
Secondly, a setup with a fixed machine-vision camera and illumination and a robotic arm to move the object in a light-controlled dark space. The resulting resolution is about 50 μm (see Fig. 12).
Both methods produce very high-resolution surface 3D point clouds and allow surface measurement from the computed profile. These representations are very similar to the inspection of a coin with a magnification lens, but Fig. 7 3D laser scan of, coin A and B with NextEngine HD (Vera Moitinho de Almeida)
Fig. 8 3D close-range laser scanning with Micro-Epsilon (Jaroslav Valach, ITAM)
can be presented on a larger screen (see demonstration of 3D surface model in, Additional file 1: Film S1).
Quantitative geometric comparison of 3D surface models Rigorous procedures are important for the documenta- tion, characterization, and understanding of each indi- vidual 3D model of a coin. A quantitative topological and geometrical comparison of 3D surface models was carried out using the following indicators: 3D vertices/
triangles, maximum diameter, shape factor, surface area, volume, along with measured weight and density of the coins (C, D). Furthermore, comparisons between the 3D models were undertaken looking at the convergence and RMS error of the alignment, and deviation values (stand- ard, mean, upper and lower deviation). Figure 13 shows pairwise differences between complete 3D models of coin A: colour difference map, distribution of differences, and standard deviation. It was found that multiple factors—
such as sensor limitations, used methods and techniques to acquire, process and analyse 3D data—influenced the numerical outcomes and therefore the confidence for the characterisation and study of the coins. Notwithstanding, the imaging technologies proved to be a valuable tool for the documentation, study and dissemination, as well as for the improvement and automation of the analysis of coins [3].
Physico‑chemical analysis of coins
The use of physico-chemical analyses is applicable to the study of coins, amongst others to assist in material composition. For this study, a series of surface sensi- tive analytical methods have been used, and as the coins
are portable, they could be brought to participating institutions.
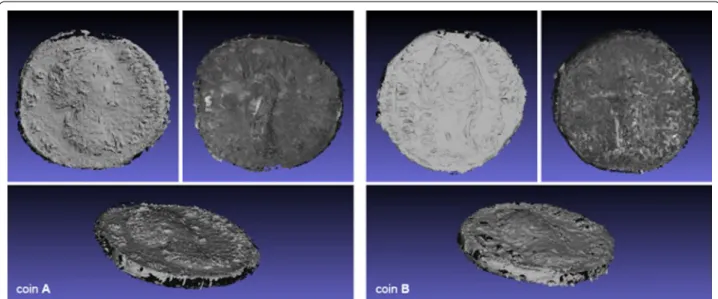
X‑ray computed microtomography
X-ray microtomography method (also called X-ray microCT) is an imaging method allowing the 3D recon- struction of an opaque object by illuminating it with X-rays in different directions by transforming a direc- tionally dense set of object’s x-ray radiograms into com- plete 3D model [19]. It can be used for the visualisation of internal microstructure of 3D objects. This method helped identify cracks and impurities through the coins and voids inside the coins, and allowed visualisation of defects and corrosion effects. Results show a heterogene- ous X-ray absorption in different parts of the coin, and this could be due to possible enrichment of elements and wear on the surface, or molten metal which had a hetero- geneous distribution of elements. Figure 14 shows three perpendicular microCT sections and the rendered 3D model visualises a crack inside the Roman coin A. The 186 resulting images of horizontal slices through the coin can also be viewed as a film sequence (see a demonstra- tion in Additional file 4: Film S4).
Scanning Electron Microscopy (SEM)/Energy‑Dispersive X‑ray Spectroscopy (EDX)/EMPA (Electron Microprobe Analysis) In Scanning Electron Microscopy, the electron beam gradually passes in rows across the area under investiga- tion, and at each point on these rows it causes physical interactions with the surface whose intensity is recorded by the probe, and converted to the grey scale of the image being formed. In this way, images with magnification, Fig. 9 3D structured light scan of Coin B, reverse and obverse. Colour information mapped from an external camera (Dirk Rieke-Zapp, Aicon 3D Systems)
depth of field, and information that cannot be reached by light microscopy, can be obtained. The energy of the inci- dent electrons is sufficient to trigger X-ray fluorescence—
excite the electrons in the surface atoms, and they emit their characteristic spectrum upon return to the basic state. By analysing the spectra, it is possible to determine the species of atoms composing the surface, but also their relative weight proportions. Composition of surface can be studied in individual points or in the whole area form- ing “composition maps”, see Fig. 19. It therefore offers simultaneous morphological and compositional surface analysis, as well as visualisation of a surface to a depth of
typically 1–5 μm. Material samples often are cut, embed- ded in resin, and polished for the sampling, but this was of course not performed on the ancient Roman coins and is avoided when examining artefacts. Whilst SEM yields surface specific local information of spectra, it does not give an overall value of the material at the inside of the coin due. If homogeneity is assumed it needs to be stated, and the results are of course not transferable to the mate- rial composition inside a coin when measuring plated coins. SEM also has limitations to yield results about the underlying material if corrosion or other dirt covers the surfaces.
Fig. 10 Coin A. obverse, photometric stereo from dome-photography. Final reconstruction of Diva Favstina (Lindsay W. MacDonald, UCL)
EDX or EDS (Energy-Dispersive X-ray Spectroscopy) is an analytical method used for elemental analysis of a sample under test, in this case silver coins. Usually, the EDX device is part of the SEM (scanning electron micro- scope). In this study, EDX was used for the elemental analysis of coins, determination of silver content and trace metals, for addressing the issue of authenticity of the coins. The method is known for its sensitivity to sur- face treatment of examined object and the reliability of composition quantification decreases with a presence
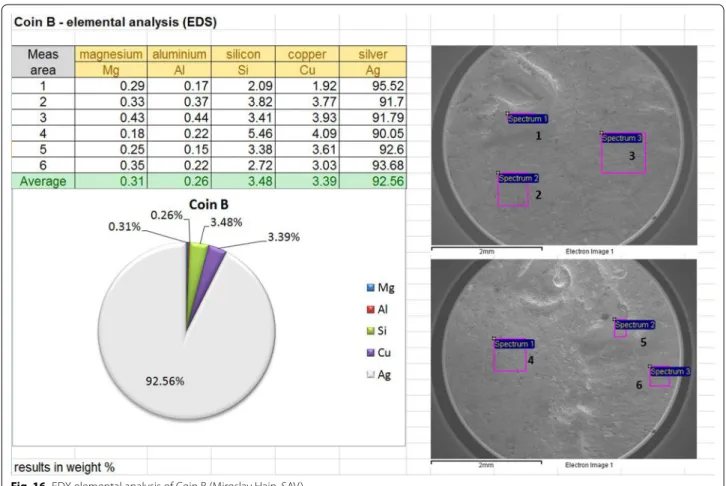
of light elements. For precise determination of surface composition WDS (wave dispersive X-ray spectroscopy) should be used [20]. Examples for the measurements on coins are shown in Figs. 15 and 16.
Atomic composition was determined at six rectangular areas for both coin A and coin B. Because of high spa- tial resolution, differences in results can be attributed not only to measurement error, but also to true local variations of composition of the coins. The average val- ues (96.9% of silver for coin A and 92.56% for coin B) can only cautiously be used to deduce the silver content in the whole volume of coins. Standard deviations indicate variability of results—0.603 for coin A and 1.879 for coin B).EDS analysis was performed also on another SEM to assess a difference in results. The analysis can be carried out point-wise as is shown in Fig. 15, the above men- tioned spatial variation of composition is best illustrated by Fig. 19 showing concentration maps for selected ele- ments. Figure 17 is presenting the composition measure- ment at three different spots of coin B (SEM of Coin B); it indicates differences between results produced by differ- ent devices when compared to Fig. 16.
EMPA for coin A is illustrated in Figs. 18 and 19. It should be noted that some places on coin are dirty and the fact can alter the analysis, as the electron beam pen- etrates few microns of material.
Micro X‑ray fluorescence (XRF) spectrometry mapping This case study also explored the use of the non-destruc- tive analytical technique, X-ray fluorescence (XRF) spectrometry, which has become a favoured analytical method in numismatics. The XRF method differs from SEM/EDX by providing depth information up to 150 μm.
A very accurate 3D representation of a coin may be com- bined with chemical maps resulting from XRF measure- ments. Previous research on this topic was undertaken by Del Hoyo-Meléndez with relevance to elemental sur- face analysis of medieval coins by XRF [21]. The method shows potential for providing insights into the prove- nance of the raw material and manufacturing processes.
The results can also be mapped to the surface to visualise the concentrations of specific elements.
For this project, three different XRF spectrometers, one of them portable, were used to compare the results of the elemental composition of the surface. With each of the three instruments, multiple measurements were taken from distinct spots and averaged to obtain an uncertainty value of the measurement. Whilst a detailed description of the thorough and scientific measurement method has been provided by the expert, it will not be presented here.
It can be summarized that chemical composition of coins was determined by three different methods—handheld Fig. 11 Surface normals from photometric image sets (Lindsay
W. MacDonald, UCL)
Fig. 12 Coin A, obverse. Photometric Stereo from machine vision camera and light, object on robotic arm (Jaroslav Valach, ITAM)
X-ray fluorescence (S1-Titan, 5 mm analysis spot), micro X-ray fluorescence (ARTAX 200, qualitative and quanti- tative data, chemical compositions maps) and by energy dispersive spectroscopy in SEM, respectively. Due to the different nature of the devices including standard devia- tion values and the positioning of the coins (ARTAX on a horizontal position with a support, and the handheld devices measuring surface contacting the coin) certainly identical measuring points could not be investigated and the investigated areas differ. To concentrate on the silver content, the methods yielded coin A 93.0% (relative error For Ag ± 2.0, S1-Titan), 96.0% (± 0.75, ARTAX 200) and 96.9% (SEM/EDX) respectively, and the silver content of the coin B 95.1% (relative error for Ag ± 2.0, S1-Titan), 97.9% (± 0.75, ARTAX 200) and 92.5% (SEM/EDX) respectively. Although the penetration of the SEM/EDX device is lower (80 μm) with respect to XRF (150 μm), it can be observed that the results are generally in agree- ment. However, it is worth noticing that the Ag concen- tration for coin B is lower in the SEM/EDX analysis as an outlier. The copper content was estimated to ca 4% and the other elements are mostly dirt from handling - car- bon and oxides based compounds. The results show that multi-elemental analysis can be obtained, which for this project help complement other measurement meth- ods (more information in [3] and [22]).
Gas pycnometry
The weighting of the coins was undertaken using pyc- nometry, which is a non-destructive and non-invasive
method during which the coins are only exposed to helium gas in a vacuum. This allowed a determination of the coin density for an estimation of the alloy composi- tion. The results allow the calculation of the composi- tions if an assumption is taken that the binary alloy is valid. The method works best when the tested specimens fills the measured cavity, when coins are flat and of low volume. The interesting outcome of the measurement of the coin density was that because of the flatness of the coin, the physical method was stretched to its limit and did not reach optimal precision in determining the actual volume of the coin as well as estimation of its composi- tion. Therefore, in this particular case the optical meth- ods for digitizing the coin and calculating its volume delivered better results.
Summary of methods and technologies used for this study Table 1 provides a summary of methods and technolo- gies used for this study. A further detailed overview of the technologies can be consulted in book chapter [3] and [22].
Discussion of results
The aim of this study was to demonstrate a multi-modal and interdisciplinary approach to analysing and inter- preting coins beyond the applications currently used in museums and numismatic collections. A number of tech- nologies were applied to examine two selected Roman Coins to glean more information about their authentic- ity, materials, manufacture, and iconography. Through consultation with expert numismatists, typical tasks in numismatic collections were summarised above in
“Background”. These tasks were then addressed by a com- bination of optical imaging and other analytical methods, such as physico-chemical. Tasks towards the physical conservation of the coins (Tasks a, g, h) are supported by optical imaging (Tasks b, c, d, f, g, i), with additional evi- dence by physico-chemical analyses (Tasks c—corrosion products, e, f, g, i). A combination of different optical and other analytical methods from conservation science has been found useful to obtain a holistic information of the surface properties, geometry, and colour as well as mate- rial properties and internal structure of the two exem- plary Roman Coins.
Discussion of optical imaging methods used in this case study The use of optical imaging methods has pro- duced the following conclusions, which are transferable to research on small cultural heritage artefacts in general:
• Optical recording technologies in 2D and 3D have matured in the last years, but research and develop- ment in hardware and software is still ongoing [23, 24]. Particularly, there is a challenge for standardiza- Fig. 13 Pairwise differences between complete 3D models of coin A:
colour difference map, distribution of differences, and std. deviation (Vera Moitinho de Almeida 2016—Reference [3])
tion of recording decision-making processes for the recording and documentation of digital data. The London Charter has provided some first proposals [25, 26]. Further challenges are policies and strate- gies for long-term digital preservation, as well as for transparency and access to digital data [27, 28]. All digital data and corresponding metadata (data infor- mation that provides information about other data) and paradata (information on how the capture did take place: for example type and model of machine, calibration, parameters, place and time, environmen- tal conditions, operator decisions during recording and processing) produced were shared during this case study and have been saved in a specific reposi- tory and are made available on a project website.
• Depending on the characteristics of the object, the scale of observation and the type of information required, the accuracy, resolution and precision of the measurements should be selected high enough to fulfil the numismatist’s or experts’ needs for scientific documentation and study.
• A comparative and critical assessment of existing methodologies for PTM/RTI dome acquisition for the high-resolution visualisation of the coin surfaces showed that currently the quality of the results is
dependent on the capabilities of the operator in com- bination with hardware and software parameters.
Furthermore, there are currently no standards for the paradata or metadata to describe this process [3].
• Photometric stereo produces a highly resolved sur- face. Despite the fact that the 3D surface models from 3D scans and SfM did not reach the highest quality of the 3D data acquired by structured light scanners, the photometric imaging should be considered as an additional and alternative method for producing 3D models for dissemination purposes [11].
• A methodological framework (Fig. 2) has been pro- posed for the 3D digital data acquisition, process and analysis of historical coins [3]. It has taken into account the order and type of other methods used, as well as the topological and geometrical characteri- sation and comparison of 3D models, with the par- ticular example of coins. The workflow starts with the research question centred on a cultural herit- age object, which influences the next steps of plan- ning, data collection, data analysis, and interpreta- tion of results, which then feed back into answering the original research question. Data collection is at the heart of this workflow and is informed by the results of using non-invasive and invasive technolo- Fig. 14 X-ray computed microtomography of Coin A (Miroslav Hain, SAV)
gies, which again is governed by an agreed 3D data strategy noting all parameters of environment, hard- ware, software, technicians and the cultural heritage object itself. The importance lies in the recording of all metadata and paradata about the process towards a scientific and technical documentation. This pro- posed framework could be transferred to other types of objects. Further details of data collection of this project are listed in detail in another publication [3].
• Technologies used to produce 3D digital datasets applied here on Roman coins allow non-destructive, non-invasive recording of the surface to construct a virtual image of the real object that can be navigated and explored on the display of a computer or even mobile device and in Virtual Reality. With develop- ments in 3D scanning technologies over the past 10 years, it is now feasible to digitize the objects of heritage institutions and to create 3D archives, thereby enabling visualization of each object ‘in the round’. Nevertheless, many practical issues remain concerning the precision of the system, accuracy, and resolution of the datasets, speed of acquisition and time required for post-processing.
• Consultation with cultural heritage professionals has confirmed the relevance of 3D imaging and estab- lished that, by creating accurate geometric repre- sentations, user motivations can be addressed for surface measurement and inspection, deformation monitoring, and 3D printing with particular benefits for conservation and research, [29, 30].
Discussion of Physico-chemical analytical methods used in this case study A crosscheck between all results of SEM/EDX and XRF shows similar results of chemical characterization, with difference of the depth of material penetration of each method. In the case of the Roman coins, curators have some interest in the composition, especially percentage silver (%Ag). In this study, upon hearing the similarity of results across different physico- chemical measurements named above, numismatists were dubious about our measurements of 97% silver (Ag) in Favstina coins, which post-date Nero’s debasement.
One expert summarised that the production of silver coins was as refined as possible during Nero’s reign until 70 AD with a high %Ag, after which it dropped to below 90% Ag, and from 190 AD onwards dropped dramatically Fig. 15 EDX elemental analysis of Coin A (Miroslav Hain, SAV)
to ca 50% Ag.2 On this basis, the authenticity of the coins, which are believed to be a posthumous deification issue from 141AD, should be re-examined.
Discussion of interdisciplinary approach and framework used in this study This project featured an interdiscipli- nary approach in consultation with numismatic experts.
The project team was formed of twelve specialists, some with expertise in two or more disciplines, including:
archaeology, art history and museology, conservation and heritage science, chemistry and electrochemistry, mechatronics and engineering, metrology, computer sci- ence, computer graphics and data processing. This joint panel of experts produced holistic knowledge about two ancient Roman coins, with a great expenditure of time and care with the aim to produce active guidelines for end users in numismatic collections [31]. Discussion and feedback was sought in a team discussion with four numismatic experts. All methods used in this case study
2 Personal communication Dr. Richard Abdy, British Museum, Personal Communication from the COSCH Roman Case study meeting on 22 June 2016 at University College London.
were presented and discussed to check that they met requirements in real world numismatic collections [3].
A costing of the time and budget used for this study and a technical report was delivered by each collaborator to the case study leader. The following elements are relevant to costing a project such as this: cost and running time of the hardware and software licenses as well as highly skilled and experienced operator time including time spent on preparation, data acquisition, data processing, reporting and data presentation, as well as data archiv- ing. In some instances, development time for prototype software and hardware should be taken into account. As this was an EU network project with experimental char- acter, all collaborators in this project gave their time and the use of the technical equipment for free, only indica- tive costs could be collected.
When presented to the numismatic experts, not all methods and technologies employed were perceived affordable in terms of time and cost for numismatic col- lections, but nevertheless results could be applicable in single cases. The meeting inspired visions for new work- flows and future virtual numismatic presentation.
Fig. 16 EDX elemental analysis of Coin B (Miroslav Hain, SAV)
Review of ongoing research for automated coin classification
Additionally to the methods used in this study on only two coins, 2D images and 3D images of coin collections can both be used to classify coins. This following section will give a brief insight of ongoing research for the auto- mation of coin classification, interpretation, and meta- data extraction for databases.
Methods from automated coin image analysis in com- puter vision have been used for automated image recog- nition, based on feature extraction and segmentation of 2000 coins was presented in 2007 [32] and to an auto- mation coin attribution system using image analysis by locally biased directional histograms in 2010 [19].
Zambanini used 3D structured light scanning on a set of 25 coins, to produce metric three-dimensional sur- face models in colour and geometry, which can over- come limitations of 2D image recording with regards to specularity of the metal surface [33]. Zambanini and Kampel further proposed a classifier-free procedure for automated coin classification based on 2D image matching based on the SIFT operator (scale-invariant
feature transform) in 2011, [34] and [35]. Huber-Moerk described the automated classification and identifica- tion of modern and ancient coins based on the analysis of 2D shapes and 3D shapes on a set of 12,000 coins [36].
Kavelar et al. review existing methods for coin classifi- cation in detail, including OCR text recognition, and propose coin classification through extraction of leg- ends of Roman Republican Coins by the SIFT descriptor in 2014 [37]. In 2012, Arandjelović proposes a method to automatically extract information from coins from a single photograph by recognising a denarius, extracting the legends and producing a metadata set to enable lay- men to report finds to authorities, here to the ‘UK port- able antiquities scheme’ [38]. In 2014, Kim and Pavlovic propose a method directly handles the spatial location of the visual feature to encode the image from existing image-based data [39]. Anwar et al. describe a method for Ancient Coin Classification Using Reverse Motif Recognition for image-based classification of Roman Republican coins in 2015 [40].
Ongoing research should be observed by the interested stakeholders in numismatics.
Fig. 17 SEM sampling results for elemental analysis on three spots, SEM surface image of coin A obverse, detail Favstinas’ ear (Veronika Koudelková, ITAM)
Conclusion
The project has produced a comprehensive study using a multi-modal approach using a wide range of methods and technologies used for studying ancient coins on the example of two Roman coins. Optical imaging tech- nologies are mostly well-established applications and show a range of results regarding resolution, accuracy,
and precision. 3D digital models may enable the extrac- tion of additional features for object characterization which are not available in 2D (e.g. deviation on the coin’s surface morphology, 3D surface area and volume measurements, cross-sections), to their quantitative characterization and analysis. Although a 3D digital model does not provide a complete picture of the object, Fig. 18 Close-up SEM surface image of coin B obverse on the ear of Favstina. Yellow numbers indicate sampling spots for elemental analysis (Veronika Koudelková, ITAM)
Fig. 19 Spectra from EPMA of coin B. Measurement spots indicated in Fig. 18 (Veronika Koudelková, ITAM)
it should be understood as a powerful tool—potentially, with valid data—for visualisation and cultural heritage research, and complementary to other measurement methods [29]. Overall, the analytical methods used in this case study contributed to a holistic knowledge of the coins at different scales and with different types of information.
Whilst the wide adoption of all scientific methods men- tioned in this study might be beyond the financial means of many numismatic collections, this project should offer guidance to those researchers who may find it useful to select specific technologies for their own research on coins. The results indicate the feasibility of such meth- ods for museum documentation and as contribution to scientific examination of coins in general. The target beneficiaries of these applications would be numismatic researchers and scientists, historians, collectors, conser- vators and educators.
In a time where user interfaces become more acces- sible, software becomes increasingly open-source, and recording technologies more affordable, the outlook for the future is the integration of the workflows towards an automated acquisition and analysis of numismatic collections to make them more accessible for education and research via digital repositories.
Abbreviations
2D: two-dimensional; 3D: three-dimensional; %Ag: percentage of the chemi- cal element silver; COSCH: Colour and Space in Cultural Heritage (Name of EU COST Action: TD1201); DSLR: digital single reflex camera; EDX: Energy- Dispersive X-ray Spectroscopy; EMPA: Electron MicroProbe Analysis; GSD:
ground sampling distance; Microns: micrometres (µm); PTM: polynomial texture mapping; RBINS: Royal Belgium Institute of Natural Sciences; RTI:
reflectance transformation imaging; SEM: Scanning Electron Microscopy; UCL:
University College London; X-ray µct/microCT: X-ray microtomography; XRF:
X-ray fluorescence.
Authors’ contributions
MH, LWM and JV have jointly written this article, whilst the data described in this article was collected and interpreted by all participants of the case study including the authors (see Acknowledgements). Consent for the use of all material in this article has been given by the participating partners of the COSCH Roman Coins case study. Single contributors for research results and graphics are acknowledged for each image and data representation. All authors read and approved the final manuscript.
Additional files
Additional file 1: Film S1. Demonstration of 3D Surface model from Photometric Stereo (Lindsay W. MacDonald, UCL).
Additional file 2: Film S2. Demonstration of 3D surface model from photogrammetry/structure from motion (Aurore Mathys, RBINS).
Additional file 3: Film S3. Demonstration of 3D surface model from RTI (Vera Moitinho de Almeida).
Additional file 4: Film S4. Demonstration of X-ray microtomography through Coin A, animation of slices (Miroslav Hain, SAV).
Author details
1 Digital Technologies in Heritage Conservation, Institute of Archaeology, Heritage Conservation and Art History, Otto-Friedrich University of Bamberg, Am Zwinger 4, 96047 Bamberg, Germany. 2 3DIMPact Research Group (3D Imaging, Metrology and Photogrammetry Applied Coordinate Technologies), Department of Civil, Environmental and Geomatic Engineering, University Col- lege London (UCL), Gower Street, London WC1E 6BT, UK. 3 Institute of Theoret- ical and Applied Mechanics of the Academy of Sciences of the Czech Republic (ITAM), Prosecká 809/76, 190 00 Prague 9, Czech Republic.
Acknowledgements
The voluntary participation of many individuals in the COSCH Roman coin study is gratefully acknowledged. Most grateful thanks are extended to: Dr.
Vera Moitinho de Almeida, Institute for the Study of Ancient Culture (IKAnt), Austrian Academy of Sciences (ÖAW) and Quantitative Archaeology Lab, Uni- versitat Autònoma de Barcelona, Spain, for providing intense help and input as well as for reviewing this article. Further thanks are extended to the par- ticipants of this case study: Dr. Anna Bentkowska-Kafel, Department of Digital Humanities, King’s College London, UK (lead of the project); Dr. Miroslav Hain, Department of Optoelectronic Measuring Methods, Institute of Measurement Science, Slovak Academy of Sciences, Bratislava, Slovakia (SAV); Eryk Bunsch, Laboratory for 3D Documentation, Museum of King Jan III’s Palace at Wilanów, Warszawa, Poland; Dr. Julio M. del Hoyo Melendez, Laboratory of Analysis and Non-Destructive Investigation of Heritage Objects, National Museum in Kraków, Poland; Aurore Mathys of Scientific Heritage, Royal Belgian Museum of Natural Sciences, Brussels (RBINS), and the Royal Museum of Central Africa, Tervuren, Belgium; Dr. Dirk Rieke-Zapp, AICON 3D Systems GmbH, Meersburg, Germany; Professor Robert Sitnik of the Institute of Micromechanics and Pho- tonics, Faculty of Mechatronics, Warsaw University of Technology, Poland, and for further data collection and analysis Ms. Veronika Koudelková from of the Institute of Theoretical and Applied Mechanics of the Academy of Sciences of the Czech Republic, Prague (ITAM).
The study was monitored and advised by Dr. Christian Degrigny of the Haute Êcole Arc Conservation-restauration, Neuchâtel, Switzerland, the COSCH Steering Committee, and the wider COSCH community.
Furthermore we would like to thank museum staff and academics who offered generous advice and/or facilitated research, including: Dr. Richard Abdy, Curator of Roman Coins, Coinage of the Roman Empire, Coins and Medals, British Museum, London, UK; Alexandra Baldwin and Pippa Pearce, Conservation and Scientific Research, and Eleanor Ghey, Portable Antiquities and Treasure, both also at the British Museum, London; Julian MC Bowsher, FSA, Senior Archaeologist and Roman coin specialist, Research and Education, Museum of London Archaeology, London, UK; Dr. Bogdan Constantinescu, National Institute of Nuclear Physics and Engineering, Bucharest, Romania;
Professor Graeme Earl, Digital Humanities at Kings’ College London , and Professor Kirk Martinez, Electronics and Computer Science, at the University of Southampton, UK. Dr. Vasiliki Kassianidou and Dr. Andreas Charalambous, Archaeological Research Unit (ARU), University of Cyprus. Dr. Julio M. del Hoyo Melendez wishes to acknowledge communication with Dr. Matthew Ponting, of Archaeology, Classics and Egyptology, University of Liverpool, UK.
Competing interests
The authors declare that they have no competing interests.
Availability of data and materials
The investigation was carried out between September 2014 and October 2016. A comprehensive account and discussion is available on the dedicated website above with images of technical set-up, images, tables and 3D datasets of the Roman Coins project and associated reports. The dataset(s) and tables supporting the conclusions of this article are available on the Roman Coins case study publications and website, https://coschromancoins.wordpress.com [22] (see also video with Additional files 1, 2, 3, 4).
More information about the EU-Cost action is available on the COSCH project website is at: http://www.cosch.info/.
Funding
This two-year study (2014–2016) was undertaken by a group of scientists, cultural heritage researchers, conservators and museum professionals