Research Collection
Journal Article
Effect of Polysaccharide Conformation on Ultrafiltration Separation Performance
Author(s):
Eder, Severin; Zueblin, Patrick; Diener, Michael; Peydayesh, Mohammad; Boulos, Samy; Mezzenga, Raffaele; Nyström, Laura
Publication Date:
2021-05-15 Permanent Link:
https://doi.org/10.3929/ethz-b-000472839
Originally published in:
Carbohydrate Polymers 260, http://doi.org/10.1016/j.carbpol.2021.117830
Rights / License:
Creative Commons Attribution-NonCommercial-NoDerivatives 4.0 International
This page was generated automatically upon download from the ETH Zurich Research Collection. For more
information please consult the Terms of use.
Carbohydrate Polymers 260 (2021) 117830
Available online 17 February 2021
0144-8617/© 2021 The Authors. Published by Elsevier Ltd. This is an open access article under the CC BY-NC-ND license
(http://creativecommons.org/licenses/by-nc-nd/4.0/).
Effect of Polysaccharide Conformation on Ultrafiltration Separation Performance
Severin Eder
a, Patrick Zueblin
a, Michael Diener
b, Mohammad Peydayesh
b, Samy Boulos
a, Raffaele Mezzenga
b, Laura Nystr ¨ om
a,*
aETH Zurich, Department of Health Science and Technology, Institute of Food, Nutrition and Health, Laboratory of Food Biochemistry, Schmelzbergstrasse 9, 8092 Zurich, Switzerland
bETH Zurich, Department of Health Science and Technology, Institute of Food, Nutrition and Health, Laboratory of Food and Soft Materials, Schmelzbergstrasse 9, 8092 Zurich, Switzerland
A R T I C L E I N F O Keywords:
Ultrafiltration
Polysaccharide conformation Polysaccharide separation Molecular weight cut-off deviation Glucose-based polysaccharide
A B S T R A C T
The manifold array of saccharide linkages leads to a great variety of polysaccharide architectures, comprising three conformations in aqueous solution: compact sphere, random coil, and rigid rod. This conformational variation limits the suitability of the commonly applied molecular weight cut-off (MWCO) as selection criteria for polysaccharide ultrafiltration membranes, as it is based on globular marker proteins with narrow Mw and hy- drodynamic volume relation. Here we show the effect of conformation on ultrafiltration performance using randomly coiled pullulan and rigid rod-like scleroglucan as model polysaccharides for membrane rejection and molecular weight distribution. Ultrafiltration with a 10 kDa polyethersulfone membrane yielded significant different recoveries for pullulan and scleroglucan showing 1% and 71%, respectively. We found deviations greater than 77-fold between nominal MWCO and apparent Mw of pullulan and scleroglucan, while recovering over 90% polysaccharide with unchanged Mw. We anticipate our work as starting point towards an optimized membrane selection for polysaccharide applications.
1. Introduction
The global production of polysaccharides in nature considerably exceeds the production volume of any other polymer. Polysaccharides constitute the central carbon source for living organisms and provide a basis for all life on our planet (Navard & Navard, 2012). In recent de- cades, polysaccharides aroused great interest in research and across various industries owing to their unique biological and physiological properties, such as biocompatibility and –degradability paired with atoxic characteristics (Muzzarelli, 2012). In particular, polysaccharide purity becomes a crucial product criterion in applications involving humans, such as biomedicine or food technology (Pinelo, Jonsson, &
Meyer, 2009). Furthermore, as the bioactive potential of
polysaccharides is distinctly related to their chemical structure and molecular weight, selective purification processes become indispensable (Wang et al., 2017).
Common purification techniques such as chromatography, evapo- ration and ion exchange require resource-intensive operation and maintenance, involve substantial investment costs, and lack scalability.
In comparison to these conventional separation and purification pro- cesses, membrane filtration offers several merits, including high effi- ciency, simple modification of operating variables and low energy requirements (Cano & Palet, 2007; Chen et al., 2020). In addition, membrane separation is especially suited for heat-sensitive bio- molecules as it is operated at room temperature (RT) and without phase transfer (Sun, Qi, Xu, Juan, & Zhe, 2011).
Abbreviations: α, Mark-Houwink parameter; AFM, atomic force microscopy; AN-scleroglucan, alkaline-treated and neutralized scleroglucan; ANS-scleroglucan, alkaline-treated, neutralized and sonicated scleroglucan; Đ, dispersity index; DLS, dynamic light scattering; dn/dc, refractive index increment; HPAEC, high-per- formance anion-exchange chromatography; HPSEC, high-performance size exclusion chromatography; HY, hydrosart; IEP, isoelectric point; LALS, low-angle light scattering; Δ%Mw, percentage difference in Mw between the retentate and feed solution; Mn, number average molecular weight; Mw, weight average molecular weight;
MWCO, molecular weight cut-off; PAD, pulsed amperometric detection; PES, polyethersulfone; RALS, right-angle light scattering; RI, refractive index; RT, room temperature; SSE, sum of squared error; ζ, zeta potential; [η], intrinsic viscosity.
* Corresponding author.
E-mail address: laura.nystroem@hest.ethz.ch (L. Nystr¨om).
Contents lists available at ScienceDirect
Carbohydrate Polymers
journal homepage: www.elsevier.com/locate/carbpol
https://doi.org/10.1016/j.carbpol.2021.117830
Received 9 November 2020; Received in revised form 12 February 2021; Accepted 13 February 2021
Over the past years, the advances in ultrafiltration technology have led to the development of refined membranes, enabling selective sepa- ration of saccharides with molecular weights as low as 3 kDa (Pinelo et al., 2009; Sun et al., 2011). The rejection properties of ultrafiltration membranes are reflected in the molecular weight cutoff (MWCO). Its arbitrary definition comprises the lowest molecular weight at which 90% of the solute is retained by the membrane (Koros, Ma, & Shimidzu, 1996). Membrane manufacturers generally assign MWCOs using glob- ular marker proteins for calibration, although an industry-wide standard is still lacking (Scott, 1995). Since globular proteins fold to sphere-like structures in solution, they present a narrow relation of molecular weight to hydrodynamic volume, influencing the separation factor of membrane filtration that is governed decisively by hydrodynamic vol- ume (Pinelo et al., 2009). Unlike the linear sequences found in peptide bonds, polysaccharides form diverse primary structures with a variety of condensation linkages (Liu, Brameld, Brant, & Goddard, 2002). This extra dimension of geometry conjunct with variable saccharide units leads to a remarkable world of polymeric architecture (Atkins, 1985). It is generally recognized that the conformation of polysaccharides in so- lution comprises three distinct patterns with increasing rigidity:
compact sphere, random coil, and rigid rod (Harding, Abdelhameed, &
Morris, 2011). The respective glycosidic linkage geometry of a poly- saccharide mainly defines its conformation in aqueous solution, which in turn determines the hydrodynamic volume (M. Q. Guo, Hu, Wang, &
Ai, 2017). The polysaccharides pullulan and scleroglucan can be considered as extreme representatives of their respective conforma- tional cluster owing to their diverse glycosidic linkage patterns. Pul- lulan, a linear water-soluble (1→4;1→6)-α-D-glucan produced by the polymorphic fungus Aureobasidium pullulans, behaves as random coil in aqueous solution (Nishinari et al., 1991). The rotational freedom pro- vided by the α-(1→6)-linkages enables flexible folding along the poly- mer chain (Gidley & Nishinari, 2009). Scleroglucan, a water-soluble (1→3;1→6)-β-D-glucan produced by fungi of the genus Sclerotium (Coviello et al., 2005), exhibits the (1→6)-linkage only in the sidechain of D-glucopyranosyl residues attached to the (1→3)linked backbone (Castillo, Valdez, & Farina, 2015). The alignment of scleroglucan strands in aqueous solution results in a stiff rigid rod-like conformation (Slet- moen & Stokke, 2008). Ultimately, distinct hydrodynamic volume and spatial orientation of polysaccharides with comparable molecular weight may restrict the applicability of MWCO as suitable selection guide for polysaccharide ultrafiltration membranes. Numerous studies reported discrepancies between the apparent and the nominal MWCO provided by the manufacturer (Kim et al., 1994; Platt, Mauramo, Butylina, & Nystrom, 2002). Platt et al. (2002) found apparent MWCOs lower than the nominal when filtering polyethylene glycol solutions and excluded fouling and concentration polarization as underlying cause.
Sun et al. (2011) observed a considerable loss of a polysaccharide mixture subjected to different ultrafiltration membranes that should have retained the investigated fraction according to the manufacturer’s MWCO. However, governing factors for the discrepancies in membrane separation obtained were not suggested.
So far, the conformation of polysaccharides in ultrafiltration appli- cations was assessed mostly in terms of the resulting hydrodynamic volume for membrane and MWCO selection. The ultimate effect of polysaccharide conformation on membrane transport during ultrafil- tration attracted little attention until now. Mathematical simulations focusing on the adaptation of steric pore models to include capsular- shaped molecules, or the assessment of the probability of elongated shapes entering a membrane pore compared to spherical particles showed the necessity to consider also conformation for a better under- standing of ultrafiltration separation (Montesdeoca, Bakker, Boom, Janssen, & Van der Padt, 2019; Vinther, Pinelo, Brons, Jonsson, &
Meyer, 2012). However, the systematic assessment of the effect of polysaccharide conformation on the resulting ultrafiltration perfor- mance remains yet unaddressed.
The present work seeks to describe the effect of polysaccharide
conformation on the separation performance of ultrafiltration mem- branes with an empirical approach. For this purpose, pullulan and scleroglucan as model polysaccharides were subjected to crossflow ul- trafiltration with two membrane materials, namely Hydrosart (HY), a low-binding regenerated cellulose material, and polyethersulfone (PES), exhibiting various MWCO (2, 3, 5, and 10 kDa). Particular attention was paid to the exclusion of any potential effect on membrane separation beside the polysaccharide conformation. The requirements for the polysaccharide model solution to guarantee an unambiguous assign- ment of ultrafiltration variation owing to the effect of conformation encompassed: (i) identical monomeric units; (ii) uniform distinct conformation in aqueous solution; (iii) solubility and conformation stability in aqueous solution; (iv) comparable weight average molecular weight (Mw) with ΔMw ≈ 100 kDa. Moreover, state-of-the-art size- exclusion chromatography coupled to light scattering and viscometer detectors (HPSEC-triple detection), high-performance anion-exchange chromatography with pulsed amperometric detection (HPAEC-PAD), and high-resolution atomic force microscopy imaging (AFM) assured comprehensive evaluation of the ultrafiltration retentate in terms of polysaccharide yield, conformation, and molecular weight.
2. Materials & methods 2.1. Chemicals
Pullulan powder was purchased from Carbosynth (Berkshire, United Kingdom). Scleroglucan powder was obtained from Elicityl (Crolles, France). D-Glucose anhydrous (≥99.5%), sodium azide (NaN3; >99%), sodium hydroxide (NaOH, ≥ 98%), sodium hypochlorite solution (NaClO), sodium nitrate (NaNO3; ≥99.5%), D-sorbitol (99%) and tri- fluoroacetic acid (TFA, >99.9%) were purchased from Sigma-Aldrich (St. Louis, United States). Hydrochloric acid (HCl, >37%) was ob- tained from VWR International (Radnor, United States). All solutions were prepared with purified water using a Millipore MilliQ-system (Billerica, United States).
2.2. Preparation of polysaccharide standard solutions
Pullulan was dissolved at RT under stirring for 1 h. Scleroglucan was dissolved at 80 ◦C under stirring for 24 h. We selected the mildest possible conditions facilitating complete dissolution of both poly- saccharides. Pullulan and scleroglucan exhibit different flexibilities in their structure that affect the strength of intermolecular interactions and thus require adapted dissolution procedures. Pullulan and scleroglucan solutions were prepared at 0.1% (w/v) for polysaccharide character- ization and at 0.025% (w/v) for ultrafiltration feed solutions. Poly- saccharide solutions were prepared taking into consideration the purity assessment of the crude polysaccharide powder (w/w) (see Section 2.5).
To unify the dispersity and to reduce the molecular weight to a com- parable level with pullulan, scleroglucan feed solution was preliminary treated with 0.2 M NaOH at RT for 10 min and subsequently neutralized with HCl, followed by centrifugation at 9000 rpm for 15 min, resulting in alkaline-treated and neutralized scleroglucan (AN-scleroglucan). The solution was then subjected to ultrasonic treatment over a total duration of 180 min with a probe sonicator (UP200H, Hielscher, Germany), operated at 100% pulsation with 80% amplitude, resulting in alkaline- treated, neutralized and sonicated scleroglucan (ANS-scleroglucan).
During the sonication procedure, the solution was cooled in an ice bath and kept under stirring to prevent heating. Prepared pullulan feed so- lution was used without further treatment. All polysaccharide solutions were filtered through a 0.45 μm Nylon filter prior to analysis or ultrafiltration.
2.3. Crossflow ultrafiltration set-up and procedure
Crossflow ultrafiltration was conducted with a Vivaflow 200 cross-
flow device equipped with Hydrosart (HY) or polyethersulfone (PES) crossflow membrane cassettes (Sartorius AG, G¨ottingen, Germany). The nominal molecular weight cut-offs (MWCO) provided by the manufac- turer were 2, 5 and 10 kDa for HY and 3 and 10 kDa for PES membranes.
Further characteristics of the membrane can be found in the supple- mentary information (Table S1, Fig. S1). Ultrafiltration was performed in constant volume diafiltration operation mode at a constant pressure of 2.5 bar set with a Masterflex L/S peristaltic pump (Cole-Parmer GmbH, Wertheim, Germany) (Fig. 1). The resulting circulation flowrates were between 20.9–24.5 L/h (Fig. S2). In each trial, 250 mL of poly- saccharide feed solution (0.025%, w/v) were subjected to diafiltration for 1 h at RT. MilliQ water, connected to the feed tank, was used as exchange solution in order to maintain a constant volume of 250 mL.
The number of diavolumes exchanged during the crossflow diafiltration were recorded for each membrane (Table S2). Crossflow ultrafiltrations were conducted in triplicates for each membrane material with distinct MWCO. After each ultrafiltration run, the ultrafiltration device was washed with the corresponding washing solution to avoid carry-over.
Washing solutions were 0.5 M NaOH and 0.5 mM NaOCl in 0.5 M NaOH for HY and PES membranes, respectively. The feed solutions and retentates were analyzed in terms of molecular weight distribution and conformational parameters using size-exclusion chromatography coupled to light scattering and viscometer detectors (HPSEC-triple detection) (see Section 2.4). The resulting yield of the respective poly- saccharide in the retentate was obtained as mass-ratio according to the following formula:
Yield(%) = mretentate
mfeed
∗100, (1)
where mretentate and mfeed are the masses of available polysaccharide in the retentate and feed solution, respectively, determined by high- performance anion-exchange chromatography with pulsed ampero- metric detection (HPAEC-PAD) after TFA hydrolysis (see Section 2.5) (Cheryan, 1998). The standard deviation of Eq. (1) was calculated, assuming independent variables, according to (Taylor, 1982):
σYield= Yield
̅̅̅̅̅̅̅̅̅̅̅̅̅̅̅̅̅̅̅̅̅̅̅̅̅̅̅̅̅̅̅̅̅̅̅̅̅̅̅̅̅̅̅̅̅̅̅̅̅̅̅̅̅̅̅̅̅
((σmretentate
mretentate
)2 +
(σmfeed
mfeed
)2)
√√
√√ . (2)
2.4. Molecular weight determination and conformation analysis
The weight average molecular weight (Mw), dispersity Đ (Mw/Mn),
intrinsic viscosity [η], and the Mark-Houwink plot of the polysaccharide feed and retentate solutions were determined using high-performance size exclusion chromatography (HPSEC) equipped with triple detec- tion (OMNISEC, Malvern Panalytical Ltd., Malvern, United Kingdom) according to the procedure described by Demuth, Betschart, and Nystrom (2020). In short, the HPSEC-triple detection system consisted of ¨ a OMNISEC resolve unit (OMNISEC, Malvern Panalytical Ltd, Malvern, United Kingdom) coupled to the multi-detector module OMNISEC reveal (OMNISEC, Malvern Panalytical Ltd, Malvern, United Kingdom) encompassing a refractive index (RI), right-angle light scattering (RALS) at 90◦, low-angle light scattering (LALS) at 7◦, and a viscometer detec- tor. Two A6000M columns with an exclusion limit of 20 000 000 Da connected in series (Malvern Panalytical Ltd., Malvern, United Kingdom) were maintained at 30 ◦C. Polysaccharide solutions were filtered through a 0.45 μm Nylon syringe filter prior to analysis. Sample injections of 100 μL were eluted with 0.1 M aq. NaNO3 containing 0.02%
(w/v) NaN3 at a flow rate of 0.7 mL/min. The system was calibrated with a one-point calibration using a Malvern PolyCAL™ polyethylene glycol (PEO24 K) standard and verified with a dextran (DEX-T70 K) standard.
Data analysis was performed using the OMNISEC 10.30 software (Mal- vern Panalytical Ltd., Malvern, United Kingdom) using a refractive index increment value (dn/dc) of 0.145 mL/g for both polysaccharide stan- dards. The Mark-Houwink equation was used to investigate the conformation:
[η] = KMα, (3)
where M is the molecular weight at a given point within the mo- lecular weight distribution; [η] is intrinsic viscosity; K is a constant, and α is a scalar related to the conformation in solution. The value of α re- sults from the slope of the Mark-Houwink plot. The data for M and [η] were extracted from HPSEC measurements. In general, the value of α is below 0.5 for spherical-like (theoretically 0 for a fully collapsed coil in a poor solvent, as predicted by the Einstein equation), between 0.5–0.8 for random coil, and larger than 0.8 for rigid rod conformation (Q. Guo et al., 2013; He, Zhang, Wang, Qu, & Sun, 2017). Mark-Houwink plots with two fractions were evaluated for the value of α using a MATLAB script computing the optimal breakpoint on a given data set for two linear fits by minimizing the overall sum of squared errors (SSE). The SSE was calculated using:
SSE=∑N
i=1
(αcal− αexp
)2
i. (3)
2.5. Determination of purity and yield of polysaccharides
Purity of polysaccharides and membrane rejection in terms of poly- saccharide yield was analyzed by quantifying monosaccharides using high-performance anion-exchange chromatography with pulsed amperometric detection (HPAEC-PAD) after TFA hydrolysis based on the method described by Boual, Abdellah, Aminata, Michaud, and Hadj (2012). In brief, 1 mL aqueous polysaccharide solution was incubated with 1.5 mL 3.3 M TFA at 100 ◦C for 4 h. After complete evaporation under N2 gas stream at RT, the dried hydrolysate was dissolved in 10 mL water. Hydrolysate solutions were filtered through a hydrophilic 0.45 μm PTFE syringe filter prior to analysis. For the polysaccharide analysis, a Dionex ICS-5000+ System (Thermo Scientific, Sunnyvale, United States) equipped with a Dionex CarboPac PA1 (4 ×250 mm) column and a CarboPac PA1 (4 ×50 mm) guard column operating at 25 ◦C was used.
Injection volume of the samples was 10 μL and eluted using a combi- nation of the two mobile phases: (A) 200 mM NaOH and (B) purified water at a flow rate of 1 mL/min. The applied gradient program was adapted from the method described by Rohrer, Cooper, and Townsend (1993) with slight modifications. The resulting gradient program was:
0–20 min, isocratic 8% A and 92% B; 20–30 min, isocratic 100% A; and 30–39 min, isocratic 8% A and 92% B. Eluents were kept under helium atmosphere. Quantification of samples was performed with the internal Fig. 1.Scheme of the cross-flow diafiltration set-up. Reprinted with permission
from Sartorius© (Directions for Use Vivaflow 50 | 50R | 200, 2016).
calibration method using the Chromeleon Chromatography Data System (CDS) Version 7 (Thermo Scientific, Sunnyvale, United States).
D-Glucose at seven concentration levels between 1.25–30 mg/L was used as external standard and D-Sorbitol as internal standard. D-Glucose was the only identified monomeric sugar for both polysaccharides in HPEAC-PAD analysis. The purity of the polysaccharides on a w/w basis was determined as follows:
Purity(%) = mhydrolysate
mpolysaccharide
∗100, (5)
where mpolysaccharide and mhydrolysate represent the masses of crude poly- saccharide powder and polysaccharide available after TFA hydrolysis determined by HPAEC-PAD, respectively.
2.6. Atomic force microscopy
Imaging of the polysaccharides was conducted by high-resolution atomic force microscopy (AFM). For the sample preparation, 20 μL of 1 μg/mL filtered scleroglucan solution were deposited on freshly cleaved mica, left to adsorb for 30 s and subsequently gently dried with pres- surized air. AFM height images were then obtained using a Nanoscope VIII Multimode Scanning Force Microscope (Bruker AXS, Karlsruhe, Germany) equipped with commercial silicon nitride cantilevers in tap- ping mode at ambient conditions. Images are presented after a 3rd order
flattening and without any further processing.
2.7. Dynamic light scattering
Correlation function and zeta potential (ζ) were measured by dy- namic light scattering (DLS) using a Zetasizer Nano (Malvern Panalytical Ltd., Malvern, United Kingdom). The experiments were performed at 25
◦C and each sample was measured three times with 11 runs per mea- surement. The results were processed using the Zetasizer software.
2.8. Statistical analysis
All experiments were performed at least in triplicates and the data were expressed as mean values ±standard deviation. One-way analysis of variance (ANOVA) with Tukey’s post-hoc test was performed to compare mean group values. An alpha value of 0.05 was considered significant. We analyzed the data using Origin, Version 2018 (OriginLab Corporation, Northampton, United States).
3. Results & discussion
3.1. Characterization of polysaccharides
Pullulan and scleroglucan standards required comprehensive
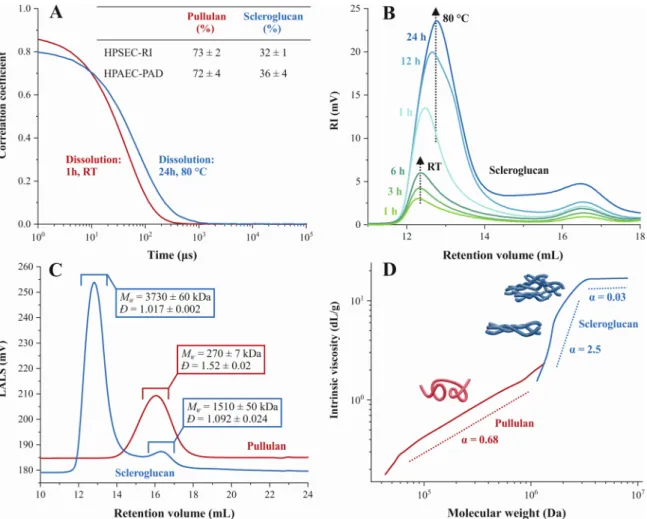
Fig. 2. (A) DLS correlation functions showing the solubility of native pullulan and scleroglucan in aqueous solutions and respective purities determined with HPSEC- RI and HPAEC-PAD (pullulan, n =15; scleroglucan, n =17). (B) HPSEC-RI signal overlay for scleroglucan after dissolution at varying temperature and duration. The dotted arrows indicate increased signal intensity upon prolonged dissolution time. (C) Representative HPSEC-LALS chromatograms for native pullulan and scle- roglucan solutions with Mw and Đ indications of the fractions observed (pullulan and scleroglucan, n =6). (D) Representative Mark-Houwink plot for pullulan and scleroglucan solutions. The α values for the scleroglucan fractions were calculated using a MATLAB script computing the optimal breakpoint on a given data set for two linear fits by minimizing overall SSE. Simplistic illustrations of the respective conformation given by the Mark-Houwink α value and dotted lines are included for visualization purposes.
characterization to ensure the molecular comparability of both poly- saccharides and to constrain ultrafiltration separation variations exclu- sively to the respective conformation in solution. The characterization focused on the solubility, purity, molecular weight, and the conforma- tion in aqueous solution of both polysaccharides under investigation (Fig. 2). A fast decay in the correlation functions obtained by DLS illustrated the complete solubility in aqueous solution for pullulan and scleroglucan (Fig. 2A). The slower decay observed for the scleroglucan correlation curve demonstrated the larger hydrodynamic radius of scleroglucan compared to pullulan. The consistency of the poly- saccharide purity in solution measured by HPSEC-RI along with the polysaccharide powder purities obtained by HPAEC-PAD after TFA hy- drolysis corroborated the complete solubility of pullulan and scle- roglucan standards. The pullulan purity of 73 ± 2% observed with HPSEC-RI matched the purity of 72 ±4% determined by HPAEC-PAD after dissolving pullulan for 1 h at RT under constant stirring (Fig. 2A). This observation is in accordance with previous work on the high solubility and stability of pullulan in aqueous solution (Adolphi &
Kulicke, 1997). Scleroglucan dissolution trials at various combinations of temperature and incubation duration provided the optimal dissolu- tion procedure and ensured the complete solubility as monitored by HPSEC-RI (Fig. 2B). Incubation for 24 h at 80 ◦C resulted in a purity in solution of 32 ± 1% with HPSEC-RI, which agreed with the purity determined of 36 ±4% by HPAEC-PAD (Fig. 2A). Hence, a dissolution procedure of 1 h at RT for pullulan and 24 h at 80 ◦C for scleroglucan were adopted (see Section 2.2).
HPSEC-triple detection revealed a uniform pullulan population with a Mw of 270 ± 7 kDa and moderate dispersity (Đ) of 1.52 ± 0.02, whereas scleroglucan exhibited distinct high-Mw and low-Mw fractions, with 3730 ±60 kDa and 1510 ±50 kDa, respectively (Fig. 2C). Both scleroglucan fractions showed uniform Đ of 1.017 ±0.002 and 1.092 ± 0.024, respectively. The Mark-Houwink plot derived from HPSEC-triple detection analysis provides a valuable measure for polysaccharide conformational elucidation. Pullulan exhibited a random coil confor- mation across the total polysaccharide population indicated by α =0.68 (Fig. 2D). The two fractions present in scleroglucan showed two distinctly different conformations in solution. The Mark-Houwink plot indicated a spherical conformation in the high-Mw fraction and a rigid rod-like conformation in the low-Mw fraction, reflected by α =0.03 and α =2.5, respectively. Literature suggests that the low-Mw fraction might be composed of several scleroglucan strands coordinated to rigid rod- like entities in solution (Sletmoen & Stokke, 2008; Zhang, Zhang, &
Xu, 2004). The low α value of the high-Mw scleroglucan fraction indi- cated the presence of aggregates (Q. Guo et al., 2013). Yanaki and
Norisuye (1983) confirmed the presence of two fractions of scleroglucan in aqueous solution. Furthermore, their study proposed that the high-Mw fraction consists of two or more linear rigid rod entities, in line with our observation of high-Mw scleroglucan aggregates with uniform Đ. Ultra- filtration separation evaluation based on conformation requires the breakdown of aggregates and the presence of the total scleroglucan population in a rigid rod-like conformation beside an adjustment of the molecular weight.
3.2. Treatment of scleroglucan solution
3.2.1. Aggregate breakdown with alkaline treatment and subsequent neutralization
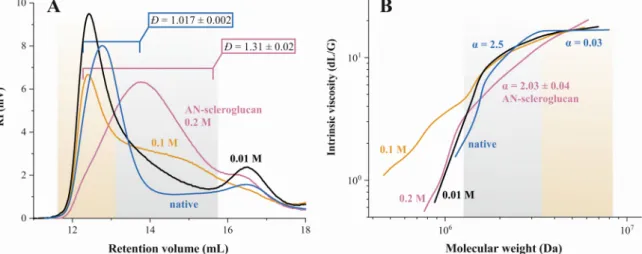
Alkaline treatment with subsequent neutralization of native scle- roglucan solution (AN-scleroglucan) was evaluated for its suitability to break down high-Mw aggregates and to induce a rigid rod-like confor- mation across the total scleroglucan population. The successive break- down of aggregates upon increasing NaOH concentration up to 0.2 M prior to neutralization resulted in a distinct shift of the molecular weight distribution of the total scleroglucan population towards lower Mw
(Fig. 3A). Treatment with 0.2 M NaOH followed by neutralization suc- cessfully induced the transition to a rigid rod-like conformation over the entire scleroglucan population. Previous work showed that scleroglucan strands in rigid rod-like entities undergo a conformational transition from rigid rod-like structures to random coil at 0.1– 0.2 M NaOH induced by electrostatic repulsion owing to high ionic strength (Slet- moen & Stokke, 2008; Zhang et al., 2004). Furthermore, the introduced charges destabilize hydrogen bonds and lead to the breakdown of ag- gregates. The transition to a rigid rod-like conformation observed is consistent with the described ability of alkaline-treated and denaturated random coil scleroglucan strands to spontaneously renaturate and form rigid rod-like structures after subsequent neutralization (Sletmoen &
Stokke, 2008; Zhang et al., 2004). The overlay of the Mark-Houwink plots of the alkaline treatment at various NaOH concentration after neutralization revealed increasing slopes and hence increasing α values with higher NaOH concentration (Fig.3 B). Consequently, more scle- roglucan strands were separated and structures with higher rigidity renaturated after neutralization as the NaOH concentration in the treatment increased. The treatment with 0.2 M NaOH showed an increased uniformity in the resulting molecular weight distribution of scleroglucan with high rigidity, displayed by a Đ value of 1.31 ±0.02, and a Mark-Houwink α of 2.03 ±0.04, compared to treatments with 0.01 M and 0.1 M NaOH (Fig. 3A, B). At concentrations equal to or lower than 0.1 M NaOH, scleroglucan exhibited distinct fractions composed of
Fig. 3. (A) HPSEC-RI monitoring for molecular weight distribution and Đ alteration (n =6) of scleroglucan after alkaline treatment for 10 min at RT with varying NaOH concentration followed by neutralization and (B) corresponding Mark-Houwink plot illustrating conformational transitions. Colored areas depict corre- sponding molecular weight fractions in panel (A) and (B) for enhanced visualization guiding.
aggregates and rigid rod-like entities. Interestingly, aggregate formation first increased during treatment with low NaOH concentration, as observed after alkaline treatment with 0.01 M NaOH and subsequent neutralization in comparison to the untreated control (Fig.3 A). This observation was consistent with the expected equilibrium of co-existing aggregates and linear rigid rod-like structures in solution below 0.1–0.2 M NaOH (Sletmoen & Stokke, 2008). Ding, Jiang, Zhang, and Wu (1998)) observed a similar phenomenon for pachyman, a (1, 3)-β-D-glucan, in aqueous NaOH solution and concluded that large ag- gregates are formed.
Alkaline treatment with 0.2 M NaOH for 10 min and subsequent neutralization facilitated the breakdown of the majority of aggregates and the conformational transition to rigid rod-like structures across the entire scleroglucan population. The optimal treatment conditions enabled the preparation of AN-scleroglucan solutions with uniform molecular weight distribution and conformation.
3.2.2. Molecular weight adjustment by sonication
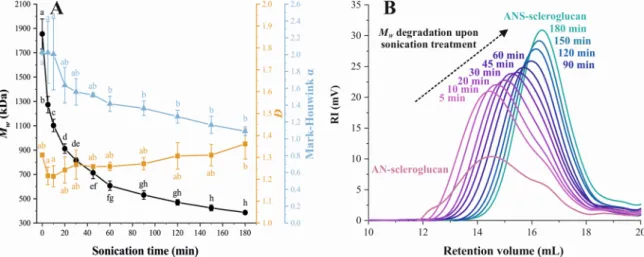
The assessment of the effect of polysaccharide conformation on ul- trafiltration performance requires comparable molecular weights with distinct conformations in solution. For this purpose, the adjustment of molecular weight by sonication and its effect on the Đ and conformation were investigated. Sonication of AN-scleroglucan (see Section 3.2.1) for 180 min resulted in a significant decrease of Mw from 1860 ±130 kDa to 387 ±14 kDa and yielded alkaline-treated, neutralized and sonicated scleroglucan (ANS-scleroglucan) (Fig. 4A). The gradual shift of the respective molecular weight distribution to higher retention volume (Fig. 4B), which is inversely proportional to the molecular weight, illustrated the successful Mw reduction with increasing sonication time (Fig. 4A). The uniform Đ of AN-scleroglucan solution remained un- changed, without any significant variation, in the ANS-scleroglucan solution, as shown by the Đ values of 1.31 ±0.02 and 1.36 ±0.07, respectively (Fig. 4A). Simultaneously, the value of Mark-Houwink α decreased significantly from 2.03 ±0.04 to 1.1 ±0.1 during the soni- cation process. However, α values above 0.8 are ascribed to a rigid rod- like conformation, indicating that the conformation of scleroglucan was maintained (Q. Guo et al., 2013; He et al., 2017).
The cleavage of glycosidic linkages owing to shear forces in the fluid caused by imploding cavitation bubbles presumably governs the sonication-driven polysaccharide degradation (Cizova, Bystricky, &
Bystricky, 2015). Consequently, aggregates formed by hydrogen bonds are more susceptible to sonication degradation and readily disentangled.
Hence, the breakdown of remaining aggregates accounted for the considerable decrease of Mw within the first 5 min of sonication
(Fig. 4A). The shoulder of the elution profile around retention volume = 12.25 mL at t =0 vanishes after 5 min sonication, thus illustrating the complete breakdown of aggregates (Fig. 4B). Furthermore, the unaltered Đ observed for ANS-scleroglucan indicates the absence of any structural selectivity of the applied treatment. The change of α values might originate from an altered higher-order structure within the rigid rod-like entities owing to the polysaccharide degradation (Sletmoen & Stokke, 2008), yet with no observed effect on the resulting conformation in solution (Fig. 4A). The simultaneous decrease in α values and Mw
observed matches the controversially discussed presence of rigid rod-like structure of scleroglucan below a critical Mw (Li, Xu, & Zhang, 2010; Wang et al., 2017). Denaturation of scleroglucan polymer chain ends or incomplete strand breakage might hinder the sterical alignment and contribute to the abated rigidity through sonication treatment.
The findings on sonication-induced scleroglucan degradation ob- tained pushes further studies on the biological activities of native (1,3)- β-D-glucans, as controlled sonication is a promising approach to reduce their viscosity (Sletmoen & Stokke, 2008) and was already successfully applied for cellulose (Arcari et al., 2020). Overall, preparation of ANS-scleroglucan enabled a controlled and reproducible molecular weight adjustment with unaltered Đ and remaining rigid rod-like conformation of scleroglucan in solution over the total treatment period investigated. Furthermore, ANS-scleroglucan showed structural stability over the entire ultrafiltration and analysis period, facilitating a meaningful ultrafiltration evaluation and subsequent chromatographic investigation (Fig. S3). For more information on the structural stability of ANS-scleroglucan solution, see supplementary information.
3.3. Visualization of scleroglucan treatment by AFM
AFM imaging was used to visualize the morphology and changes thereof during the preliminary preparation of the ANS-scleroglucan feed solution. Scleroglucan in the native state covered the complete surface revealing a mesh of branched, overlapping and intertwined poly- saccharides chains with varying heights (Fig. 5A), resembling observa- tions made in previous studies (McIntire & Brant, 1997; Vuppu, Garcia,
& Vernia, 1997). After the alkaline treatment and neutralization, the
majority of aggregates were separated with individual aggregates still being observable, supporting the observation from HPSEC-RI of a decreasing effect on the molecular weight (Fig. 5B). As fuzzy ends and branching points were observable, the interaction of multiple poly- saccharide chains was confirmed, as already reported in other linear polysaccharides such as the carrageenans and gellan gum (Diener et al., 2019, 2020). The effect of sonication was visually confirmed as the
Fig. 4.(A) Alteration of Mw, Đ, and Mark-Houwink α in AN-scleroglucan solution during sonication treatment over 180 min. Different letters denote significant differences (one-way ANOVA +Tukey’s post hoc test, p <0.05, n =3). (B) HPSEC-RI overlay of sonicated AN-scleroglucan illustrating gradual reduction of Mw with prolonged sonication time.
remaining aggregated structures, and thus the detected molecular weight, were further disintegrated (Fig. 5C). The sonication treatment of the AN-scleroglucan solution resulted in the liberation of rigid rod-like, linear polysaccharide chains, confirming the expected conformation of scleroglucan. Similarly to the ANS-scleroglucan solution, mainly rigid rod-like, linear polysaccharide chains were observed in the retentate solution after ultrafiltration (Fig. 5D). The rigidity of the polysaccharide chains may explain the indifference of the ANS-scleroglucan solution before and after application of ultrafiltration and points again at the importance of the conformation of the polysaccharide conformation for the assessment of a membrane. The apparent alignment of the polymers and aggregates is presumably caused by the drying step in the sample preparation and emphasizes the rigidity of the scleroglucan polymers (Stokke & Brant, 1990). Interestingly, a small number of the single polysaccharides were ring-like shaped, also observed in ι-carrageenan owing to their chiral secondary structure (Fig. 5C, D) (Schefer, Usov, &
Mezzenga, 2015). In our observations, AFM imaging provided a simple characterization pathway to explore conformational changes and verify the effect of the pretreatments.
3.4. Evaluation of pullulan and ANS-scleroglucan ultrafiltration
Ultrafiltration investigations of polysaccharides with identical monomeric units, comparable molecular weight, and distinct confor- mation in aqueous solution reveal insight into the effect of conformation on the membrane filtration process. Pullulan and ANS-scleroglucan so- lutions were subjected to ultrafiltration using Hydrosart (HY) and pol- yethersulfone (PES) membranes with distinct molecular weight cut-offs of 2, 5 and 10 kDa, and 3, and 10 kDa, respectively. Ultrafiltration separation performance was evaluated considering percentage differ- ence in Mw of retentate and feed solution (Δ%Mw), revealing the impact on the molecular weight distribution, and the corresponding recovery yield of pullulan and ANS-scleroglucan achieved with the membranes studied. The comparison of pullulan and ANS-scleroglucan for each membrane and the separate consideration of pullulan and ANS- scleroglucan ultrafiltration performance across all membranes studied provides comprehensive inferences on the separation processes observed.
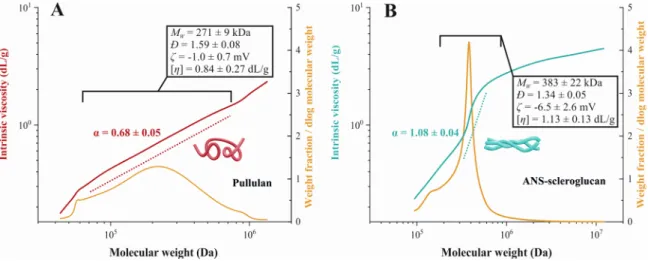
3.4.1. Characterization of pullulan and ANS-scleroglucan feed solutions The scleroglucan solution pretreatment described (see Section 3.2) facilitated the elimination of potential influencing factors on the ultra- filtration separation beside the polysaccharide conformation in solution and ensured the comparability with pullulan. The feed solutions of pullulan and ANS-scleroglucan showed a Mw of 271 ±9 and 383 ±22 kDa, respectively, fulfilling supposed molecular weight comparability with ΔMw ≈100 kDa (Fig. 6A, B). Moreover, the α values of 0.68 ±0.05 and 1.08 ±0.04 depict the random coil and rigid rod-like conformation of pullulan and ANS-scleroglucan in solution, respectively. The Đ of 1.59
±0.08 for pullulan and 1.34 ±0.05 for ANS-scleroglucan reflect the narrow to moderate Đ of the desired conformation considering the respective polysaccharide. Additionally, the intrinsic viscosity [η] of pullulan, 0.84 ±0.27 dL/g, and ANS-scleroglucan, 1.13 ±0.13 dL/g, corroborate the elucidated conformation (Fig. 6A, B). The [η] might be considered as “inverse density“, with higher values indicating a more extended and less dense polymer in solution. Hence, the low [η] value of pullulan illustrates the compact random coil conformation in compari- son to scleroglucan. The high [η] of ANS-scleroglucan substantiates the extended polymer arrangement corresponding to the linear conforma- tion. The ζ-potential measurement of the feed solutions reflected the neutral character of pullulan and ANS-scleroglucan and excluded any charge-induced differences among them (Fig. 6A, B). Furthermore, density and viscosity values of both polysaccharide solutions were comparable to water (Table S3, Fig. S4). Therefore, influences on the diafiltration process due to physical properties of the polysaccharide solutions could be excluded.
3.4.2. Separation efficiency of pullulan and ANS-scleroglucan by ultrafiltration
The comparison of pullulan and ANS-scleroglucan for each mem- brane provided insight into the separation efficiency for both poly- saccharides. Pullulan and ANS-scleroglucan recoveries after ultrafiltration mostly revealed no statistically significant differences, irrespective of the membrane used or MWCO selected (Fig. 7), apart from the 10 kDa PES membrane. The filtration process with this particular membrane resulted in a substantial difference between ANS- scleroglucan and pullulan, with a yield of 71% and a marginal recovery yield of 1%, respectively. The rejection coefficients and permeability Fig. 5. Representative AFM height images of aqueous scleroglucan deposited on mica: (A) In its native state; (B) after alkaline treatment and neutralization (AN- scleroglucan); (C) after subsequent sonication (ANS-scleroglucan); (D) retentate after ultrafiltration. Colored squares highlight the location of the enlarged AFM images displayed right below. Height applies to all images.
values for pullulan and ANS-scleroglucan considering each membrane were in line with the yields presented (Table S2, Fig. 7). This striking difference in remaining yield demonstrates the fundamental effect of polysaccharide conformation on ultrafiltration separation. Moreover, the significantly higher values for Δ%Mw of ANS-scleroglucan after ul- trafiltration with 5 kDa HY, 10 kDa HY and 3 kDa PES indicate the conformational effect on membrane separation. Interestingly, Δ%Mw of pullulan and ANS-scleroglucan did not differ significantly for filtrations with 2 kDa HY and 10 kDa PES membranes (Fig. 7). It appears that the 10 kDa PES membrane offers potential merits to selectively separate pullulan and scleroglucan and provides great potential for other poly- saccharide applications with similar conformational differences.
The variations observed can be ascribed to the distinct conformations in solution. The higher chain flexibility of pullulan permits a more compact spatial alignment in solution. Considering the applied trans- membrane pressure during ultrafiltration, the hydrodynamic volume of flexible polymers can be additionally decreased by shear-induced deformation at the membrane interface (Fried, 1997). Ultimately, these circumstances enhance the transport across the membrane and reduce the pullulan yield. On the contrary, ANS-scleroglucan possesses a linear rigid rod-like conformation, which entails an increased
hydrodynamic volume relative to the molecular weight in case of a spatial consideration along the polysaccharide chain. The results ob- tained are consistent with the statistical model proposed by Vinther et al. (2012), claiming that linear shapes have a lower probability of entering a membrane pore compared to spherical shapes. Our observa- tions affirm the importance to consider conformation in ultrafiltration separation, since the physical separation directly relies on the hydro- dynamic volume under ultrafiltration conditions of the particles to be retained.
3.4.3. Membrane performance for pullulan and ANS-scleroglucan yields The evaluation of pullulan and ANS-scleroglucan ultrafiltration across all membranes studied permits comprehensive inferences on membrane performance for the considered polysaccharide. The com- parison within a respective polysaccharide for all membranes studied showed no significant effect of membrane selection on pullulan yield, except for the aforementioned 10 kDa PES membrane (Fig. 8). ANS- scleroglucan exhibited a trend of decreasing yield with increasing MWCO, although solely the difference between 3 kDa PES, showing 94%
yield, and 10 kDa PES, showing 71% yield, was statistically significant.
Moreover, the yield of 98% achieved with 2 kDa HY was significantly Fig. 6. Characteristics of prepared (A) pullulan and (B) ANS-scleroglucan feed solutions used to investigate the conformational effect of polysaccharides on ul- trafiltration separation (pullulan, n =10; scleroglucan, n =15). Simplistic illustrations of the respective conformation given by the Mark-Houwink α value are included for visualization purposes. Mark-Houwink α values were derived from areas indicated by the dotted lines, corresponding to the major weight fraction of the respective polysaccharide, and excluding software extrapolation at the border areas within the molecular weight distribution. Mw, Đ, and [η] values were derived from areas within the molecular weight distribution indicated by the brackets.
Fig. 7. Percentage difference in Mw between the pullulan and ANS-scleroglucan retentate and feed solutions (Δ%Mw) and corresponding recovery yields of the respective Hydrosart (HY) and polyethersulfone (PES) membranes observed. The statistical evaluation allows for comparison between pullulan and ANS- scleroglucan for each membrane studied.
Different letters denote significant differences of recovery yields (oneway ANOVA +Tukey’s post hoc test, p <0.05, n =3). Asterisks indi- cate significant differences of Δ%Mw (oneway ANOVA +Tukey’s post hoc test, *p <0.05, n = 3).
higher than the ANS-scleroglucan yield of 71% obtained with 10 kDa PES. Furthermore, the extrapolation of the yield remaining after assuming the highest ND observed (ND =20 for pullulan diafiltration with 10 kDa PES, see Table S2), corroborated the trends of poly- saccharide yields observed (Table S2, Fig. 8). Pullulan ultrafiltration revealed significant differences in Δ%Mw between distinct MWCO within a given membrane material, except for 5 kDa HY (Fig. 8). However, 2 kDa HY showed a higher Δ%Mw value than 10 kDa HY, whereas the opposite effect was observed for PES membranes. Moreover, Δ%Mw of 10 kDa PES membrane exhibited a significant difference to all other pul- lulan ultrafiltrations. ANS-scleroglucan showed significant differences in Δ%Mw between HY and PES membranes after ultrafiltration, but no differences within the same membrane material were observed.
Overall, the recovery yields revealed remarkable deviations between the nominal MWCO and the actual Mw of the respective feed solution.
The MWCO represents the lowest molecular weight of a considered molecule that is 90% rejected by the membrane (Koros et al., 1996). A yield of 90% for pullulan and ANS-scleroglucan with PES membranes were achieved with a 3 kDa MWCO only, which implies a 90–fold and 128–fold deviation between nominal MWCO and actual Mw, respec- tively. Generally, selection of a membrane with a MWCO 3 to 6 times smaller than the molecular weight of the molecule to be retained is recommended in order to assure complete retention (Schwartz, 2003).
Since the Mw of the prepared pullulan and ANS-scleroglucan feed solu- tions were 27–fold and 38–fold greater than the highest MWCO chosen (Figs. 7 and 8), respectively, a recovery yield of 90% was expected for all membranes studied. These observations demonstrate that MWCOs based on globular proteins are not applicable to polysaccharides. Pullulan and ANS-scleroglucan ultrafiltration with HY membranes achieved over 90% or insignificant lower yields irrespective of the MWCO selected.
The reduction in Δ%Mw with increasing MWCO of HY membranes observed for pullulan contradicts the principle of MWCO rating, indi- cating an effect of membrane material on separation performance.
Higher MWCO are expected to result in the rejection of larger molecules with a concomitant increase in Mw of the retentate. Pullulan ultrafil- tration with 10 kDa PES demonstrated clearly the rejection of larger molecules with higher MWCO corresponding to the expected effect and to the conformational effect discussed above. However, the Δ%Mw re- sults obtained for ANS-scleroglucan, showing that differences occurred solely among membrane materials, corroborate the considered effect of membrane material on the molecular weight distribution.
3.4.4. Combined Mw and yield evaluation for optimal pullulan and ANS- scleroglucan rejection
Globular proteins usually exhibit a narrow relation of molecular
weight and hydrodynamic volume. In this case, ultrafiltration perfor- mance evaluation based on resulting yields is an adequate measure to reflect the membranes suitability for a considered application. However, polysaccharide often present broader molecular weight distribution and thus specific molecular weight fractions might get lost despite a satis- factory yield. Ideally, polysaccharide filtration achieves the highest yield whilst maintaining an unchanged molecular weight distribution of the desired polysaccharide. The combined assessment of Δ%Mw and yield elucidates the effect of membrane selection on the molecular weight distribution and separation efficiency of the considered polysaccharide.
Pullulan ultrafiltration with yields of at least 90% without adverse alteration of the molecular weight distribution was achieved with 2 kDa HY or 3 kDa PES (Fig. 8). This observation corresponds to a 136-fold and 90-fold deviation between nominal MWCO and pullulan Mw, respec- tively. ANS-scleroglucan ultrafiltration with yields of at least 90% and smallest alteration of molecular weight distribution was observed for 2 and 5 kDa HY membranes (Fig. 8), corresponding to a 192–fold and 77–fold deviation between nominal MWCO and ANS-scleroglucan Mw, respectively. The significant difference in ANS-scleroglucan yield after ultrafiltration with 3 kDa and 10 kDa PES was not accompanied with any significant change in Δ%Mw (Fig. 8). Since ANS-scleroglucan possesses a linear rigid rod-like structure, the ability to pass the membrane may also depend on the spatial orientation. Under ultrafiltration conditions with elevated transmembrane pressure, linear structures might be forced through the membrane pore irrespective of their molecular weight, whereas spherical structures with high Mw are retained. Such a phe- nomenon would result in an unchanged Δ%Mw of the rigid rod-like polymer with simultaneously decreasing yield upon an increasing MWCO, as observed. Interestingly, pullulan ultrafiltration with HY membranes displayed no significant differences in terms of yield, but the significant reduction in Δ%Mw with increasing MWCO indicated the loss of higher-Mw pullulan fractions (Fig. 8). Furthermore, the reverse pattern of significant differences between pullulan Δ%Mw and yield with 10 kDa HY and PES reinforce the effect of membrane material on Mw
alteration and recovery yield. Moreover, the ultrafiltration of ANS- scleroglucan with HY membranes, where neither significant difference in Δ%Mw nor in the yield were observed, substantiates a greater effect of membrane material rather than the nominal MWCO on resulting retentate properties. In addition, the distinct observations within Pul- lulan and ANS-scleroglucan filtration emphasize the fundamental effect of polysaccharide conformation on the resulting separation process. The smallest MWCOs of HY and PES membranes provided the desired membranes performance regarding yield and Mw for pullulan. In case of ANS-scleroglucan, ultrafiltration with HY membranes yielded the Fig. 8. Percentage difference in Mw between the pullulan and ANS-scleroglucan retentate and feed solutions (Δ%Mw) and corresponding recovery yields of the respective Hydrosart (HY) and polyethersulfone (PES) membranes observed. The statistical evaluation allows for comparison within a respective polysaccharide across the membranes studied. Different letters denote significant differences of recovery yields (oneway ANOVA +Tukey’s post hoc test, p <
0.05, n =3). Asterisks indicate significant dif- ferences of Δ%Mw (oneway ANOVA +Tukey’s post hoc test, *p <0.05, n =3).
highest recovery yields while maintaining the closest weight distribu- tion to the initial feed solution observed, irrespective of the selected MWCO.
The impact of membrane material on ultrafiltration performance within a considered polysaccharide is of particular interest since both membrane materials have been extensively used in filtration of poly- saccharides (Kothari et al., 2014; Susanto, Arafat, Janssen, & Ulbricht, 2008). Saha, Balakrishnan, and Ulbricht (2007) found that cellulose-based membranes are more prone to fouling than PES mem- branes when filtering a high molecular weight fraction of 130 kDa containing arabinogalactan. For this study, the monitoring of the permeate flow obviously indicated that fouling didn`t occur during the time of the diafiltrations, irrespective the membrane utilized (Fig. S5).
Many factors possibly contribute to fouling, such as the concentration of solutes or the interaction of solutes and membrane e.g. electrostatic in- teractions, hydrophobic interactions, and hydrogen bonding. Given the diluted concentration of the polysaccharide feed solutions (0.025%
(w/v)) utilized in the diafiltration, any adverse fouling effect due to solute concentration can be neglected. In particular, charges on the membrane and solute surface are an important factor to consider in ultrafiltration since electrostatic interactions can influence the separa- tion process (Hu et al., 2018). Electrostatic attraction owing to oppo- sitely charged surfaces of membrane and solute might induce fouling, whereas same charges suppress fouling by repulsive effects (Breite, Went, Thomas, Prager, & Schulze, 2016). The isoelectric point (IEP) of the PES membranes in this study is reported to be around 5.5 (Salgin, Salgin, & Soyer, 2013). Membranes based on regenerated cellulose, such as the HY membranes used, have IEP`s between 3–5 (Pontie, Chasseray, Lemordant, & Laine, 1997; Pontie, Durand-Bourlier, Lemordant, &
Laine, 1998). Since pullulan and ANS-scleroglucan feed solutions were neutral, both membrane materials are operated above their IEP, hence exhibiting slightly negative surfaces charges during ultrafiltration.
Furthermore, it could be assumed that the ionic strength of μ =0.2 in the ANS-scleroglucan solution resulting from NaCl after alkaline treatment and neutralization had no effect on the IEP (Salgin et al., 2013).
Consequently, potential constraints due to adverse charge-charge in- teractions at the membrane surface, such as adsorptive effects, could be neglected owing to the ζ-potential measurements and the membrane IEPs reported. Hence, fouling cannot explain the differences observed between e.g. 10 kDa HY and 10 kDa PES in the ultrafiltration of pullulan.
However, further investigations are needed to ascertain the underlying mechanistic cause for the observed difference between membrane ma- terials for a given polysaccharide.
The assembled data suggest that polysaccharide conformation sub- stantially affects ultrafiltration performance when separating distinct polysaccharide geometries. Considering a respective polysaccharide conformation, the membrane material seems to influence largely the rejection behavior. However, conformation might play a decisive role as the separation variations in terms of membrane material differ for both glucose-based polysaccharides. Considering polysaccharide purifica- tions, we recommend choosing the smallest MWCO applicable for a desired application. In case of pullulan, HY and PES membranes proved to be suitable selections, whereas HY showed superior performance in terms of yields without Mw alteration for ANS-scleroglucan. Based on our results, ultrafiltration with 10 kDa PES membrane might be an asset for the selective separation of pullulan and ANS-scleroglucan in future studies.
4. Conclusions
Polysaccharide conformation in aqueous solution showed a remarkable effect on ultrafiltration retentates in terms of recovery yield and molecular weight distribution. Overall, the impact of poly- saccharide conformation and membrane material, considering a distinct conformation, were more decisive on the membrane separation than the manufacturer’s declared MWCO. Consequently, large deviations
between apparent and nominal MWCO were observed for certain membranes. The conformation as crucial factor was evidenced by a higher molecular weight and yield in the retentate of rigid rod-like ANS- scleroglucan compared to randomly coiled pullulan. Furthermore, the effect of spatial orientation of linear molecules on the transport across the membrane was illustrated with ANS-scleroglucan. While the mo- lecular weight remained unchanged after ultrafiltration, the yield significantly decreased, indicating membrane transport irrespective of molecular weight for linear polysaccharides. Eventually, Hydrosart membranes may be recommended for purification purposes of glucose- based polysaccharides with comparable conformation and molecular weight as in this study, to ensure high polysaccharide yield and smallest possible effects on the molecular weight distribution. Moreover, the smallest MWCO feasible for the considered application should be cho- sen. We anticipate that polyethersulfone membranes with elevated MWCO will facilitate the selective separation of pullulan and ANS- scleroglucan and offer great potential for polysaccharides with similar structural feature and conformation. This work provides the empirical framework for the development of an improved membrane selection for polysaccharide filtration, paving the way to revised membrane guide- lines in general and high-performance separation of polysaccharides in particular.
CRediT authorship contribution statement
Severin Eder: Conceptualization, Methodology, Formal analysis, Investigation, Writing - original draft, Writing - review & editing, Visualization, Supervision. Patrick Zueblin: Methodology, Formal analysis, Investigation, Writing - original draft. Michael Diener:
Conceptualization, Formal analysis, Investigation, Writing - original draft, Visualization. Mohammad Peydayesh: Conceptualization, Writing - review & editing. Samy Boulos: Conceptualization, Method- ology, Writing - review & editing. Raffaele Mezzenga: Resources, Writing - review & editing. Laura Nystrom: Resources, Writing - review ¨
& editing, Supervision, Project administration, Funding acquisition.
Declaration of Competing Interest
The authors reported no declarations of interest.
Acknowledgment
The authors gratefully thank Dr. Pascal Bertsch from the Laboratory of Food Process Engineering, ETH Zürich for his assistance in the ultrasonication setup and sharing his expertise. The authors acknowl- edge Dr. Jo¨el Zink from the Laboratory of Food Process Engineering, ETH Zürich for supporting the viscosity and density measurements and his help. This work was supported by European Research Council ERC, under the European Union’s Horizon 2020 research and innovation programme (Grant agreement No. 679037), and ETH Zurich.
Appendix A. Supplementary data
Supplementary material related to this article can be found, in the online version, at doi:https://doi.org/10.1016/j.carbpol.2021.117830.
References
Adolphi, U., & Kulicke, W. M. (1997). Coil dimensions and conformation of macromolecules in aqueous media from flow field-flow fractionation/multi-angle laser light scattering illustrated by studies on pullulan. Polymer, 38(7), 1513–1519.
Arcari, M., Axelrod, R., Adamcik, J., Handschin, S., S´anchez-Ferrer, A., Mezzenga, R., &
Nystr¨om, G. (2020). Structure–property relationships of cellulose nanofibril hydro- and aerogels and their building blocks. Nanoscale, 12(21), 11638–11646.
Atkins, E. (1985). Conformations in polysaccharides and complex carbohydrates. Journal of Biosciences, 8(1–2), 375–387.
Boual, Z., Abdellah, K., Aminata, K., Michaud, P., & Hadj, M. (2012). Partial characterization and hydrolysis procedure of water soluble polysaccharides