Synthesis and Crystal Structure Determination of Ag
9FeS
4.1Te
1.9, the First Example of an Iron Containing Argyrodite
Dominik Frank,
†Birgit Gerke,
‡Matthias Eul,
‡Rainer Pöttgen,
‡and Arno Pfitzner
†,*
†Institut für Anorganische Chemie, Universitat Regensburg, Universitä ̈tsstraße 31, 93040 Regensburg, Germany
‡Institut für Anorganische und Analytische Chemie, Westfalische Wilhelms-Universitä ̈t Münster, Corrensstraße 30, 48149 Münster, Germany
*S Supporting Information
ABSTRACT: Ag9FeS4.1Te1.9 was prepared by solid state synthesis from stoichiometric amounts of the elements at 873 K. The compound forms gray crystals which are stable against air and moisture. The crystal structure was determined by X-ray diffraction from selected single crystals. Ag9FeS4.1Te1.9crystallizes in the space groupF4̅3m,a= 11.0415(7) Å,V= 1346.1(1) Å3, andZ= 4 (powder data at 293 K). The compound shows a reversible phase transition upon cooling to the space group P213, a= 11.0213(1) Å, V= 1338.75(2) Å3, and Z= 4 (single crystal data at 200 K). The title compound is thefirst example of an iron containing argyrodite- type material with Fe3+ located in tetrahedral sites. Silver atoms are disordered at room temperature which was taken into account by nonharmonic refinement of the silver positions.
The refinement converged to R1 = 3.51% and wR2 = 10.66% for the room temperature measurement and toR1= 1.55% andwR2= 5.23% for the 200 K data set (all data). Impedance measurements were performed in the temperature range from 323 to 473 K. Ionic conductivity values are 1.81×10⁻²S cm−1at 323 K and 1.41×10⁻¹S cm−1at 468 K. The activation energy is 0.19 eV from 323 to 423 K and 0.06 eV from 393 to 473 K. DTA measurements reveal
congruent melting at 907 K. A phase transition temperature of 232 K with an enthalpy of 7.9 kJ/mol was determined by DSC measurements.57Fe Mössbauer spectra show one signal at 298 K and a doublet at 78 K, indicating Fe3+and structural distortions upon cooling the samples. Hyperfinefield splitting of iron is observed at 5 K. Measurements of the molar susceptibility revealed that the compound is paramagnetic down to a Néel temperature ofTN= 22.1(5) K. Antiferromagnetic ordering is observed at lower temperatures.
KEYWORDS: argyrodite, ion conductor, nonharmonic refinement, Mössbauer spectroscopy, magnetism
■
INTRODUCTIONThe mineral Argyrodite Ag8GeS6was thefirst representative of a large family of compounds which is nowadays called argyrodites. They have been investigated for a long time because of their interesting physical and chemical properties.
Among these, ionic conductivity is the most prominent one. It is associated with argyrodites of Li,1,2Ag,3,4and Cu.5,6A huge number of argyrodites is known to date due to a manifold of substitution possibilities on the different sites. Kuhs et al.
generalized the formula of argyrodites and found several substituted representatives with mixed anion substructure.7 Today argyrodites consisting of mono- or divalent cations A (Cu+, Ag+, Li+, Cd2+, Hg2+), and a tri-, tetra-, or pentavalent cation Bforming a complex anion with a chalcogenide ion Q (O2−, S2−, Se2−, Te2−) are known. The general formula is Am+((12−n−y)/m)Bn+Q2−6−yX−y. The multivalent cation B must have an appropriate size and must be capable of forming tetrahedra. Typical multivalent cations are the main group elements Al3+, Ga3+, Si4+, Ge4+, Sn4+, P5+, As5+, and Sb5+. A limited number of examples with the transition metals Ti4+, Nb5+, and Ta5+ are also established.8−10Argyrodites typically show a rich phase transition behavior. Superionic conductivity is a feature which is observed quite often, especially in the high
temperature modification with space groupF4̅3m. A part of the chalcogen atoms in the structure can be substituted by halide ions X (Cl−, Br−, I−) in many cases. Typically, a quaternary argyrodite in the high-temperature modification is stabilized even at ambient temperature. Electroneutrality is achieved in this case by a decreasing content of the mobile species A. The high mobility of the monovalent cations often results in a pronounced disorder of the respective ions, and in the structure refinements short distances between partially occupied positions are observed. These short distances are physically meaningless. Strong correlations are usual when the crystal structures of such compounds are refined. Therefore many crystal structures were only poorly refined in the past. The application of the Gram-Charlier expansion11 to atomic displacement parameters is state of the art to overcome such problems. It allows describing the electron density of the mobile species without introducing a huge number of parameters with strong correlations. In addition, it becomes possible to derive structure−property relations for the ion
Received: April 2, 2013 Revised: May 14, 2013 Published: May 15, 2013
pubs.acs.org/cm
conducting materials based on significant displacement parameters.12A systematic analysis of the diffusions pathways and the conductivity of quaternary copper argyrodites was reported by Nilges.5,13 Silver argyrodites have been well investigated by Boucher et al.,3 Evain et al.,4 and Belin et al.14Thefirst Li based argyrodites were recently discovered by Deiseroth et al.1 These compounds show a very high ionic conductivity over a wide temperature range and are of a special interest for Li-ion batteries. These are important for electro- motive applications because of the optimum ratio of mass and transported charge in the case of Li+. Li based argyrodites with phosphorus and arsenic15have been investigated in quite a bit of detail. Among them are the first oxygen containing examples.16 Silver and copper containing argyrodites are interesting for special applications. This holds true especially for the silver compounds due to their low activation energies.
Moreover, the structural concepts derived from the pretty stable Cu and Ag materials are transferable to Li argyrodites, which are quite sensitive to air and moisture. Herein, we report on the synthesis and characterization of Ag9FeS4.1Te1.9. The compound is related to the mineral Chenguodait. Chenguodait (mineral number IMA-CNMMN 2004-042a), Ag9FeS4Te2,17 was reported to crystallize in the orthorhombic system witha= 12.769(2) Å,b= 14.814(2) Å,c= 16.233(1) Å,V= 3070.6 Å3, andZ= 9. According to the composition of Chenguodait, iron has the oxidation stage +III, and a tetrahedral coordination seems reasonable. The composition of this mineral is very similar to ternary argyrodites with the general formula Ag9M(III)Q6 (M = Al3+, Ga3+; Q = S2−, Se2−).18−21 The ionic radius of Fe3+(63 pm) is comparable to that of Ga3+(61 pm) (both for tetrahedral conformation).22 However, several examples of compounds like Ag5PS4Cl2,23 Ag5PS4I2,24 Ag6GeS4X2 (X = Cl−, Br−),25 and Ag6SnS4Br226 with
“argyrodite-like” formulas but quite different crystal structures show that the composition gives only a rough idea about the structure. Thus, the aforementioned mineral attracted our interest. Trials to synthesize a Chenguodait analogue resulted in a new argyrodite with the composition Ag9FeS4.1Te1.9 and cubic symmetry instead of the orthorhombic one which was reported for the mineral.
Ag9FeS4.1Te1.9 is the first iron containing representative of this structure family. The crystal structures of the high and low temperature modification, the ionic conductivity, and further physical properties of this material are discussed.
■
EXPERIMENTAL SECTIONSynthesis. Ag9FeS4Te2 was obtained by solid state reaction of stoichiometric amounts of Ag (99.9%, chemPUR), Fe (99,998%, Alfa Aesar), S (99.999%, chemPUR), and Te (99.999%, chemPUR) in the ratio 9:1:4:2 in an evacuated quartz ampule. The starting materials were slowly heated to 1273 K, cooled down to ambient temperature, homogenized, and then annealed again in an evacuated quartz ampule for two weeks at 873 K. A gray reaction product was obtained. Since the subsequent characterization showed that a compound with the composition Ag9FeS4.1Te1.9is preferably formed, the same procedure was applied to reaction mixtures with the corresponding stoichio- metric amounts of the elements. These samples were then used for further characterization. Samples for 57Fe Mössbauer and molar susceptibility measurements were synthesized according to the formulas Ag9FeS4Te2and Ag9FeS4.1Te1.9for comparison. All steps of the procedure were carried out using nonmetallic items. Further treatment of the samples was done as already described.
Powder Diffraction. The diffraction pattern of Ag9FeS4Te2 at ambient temperature was collected with a STOE STADI P diffractometer using Cu Kα1 radiation and a germanium mono-
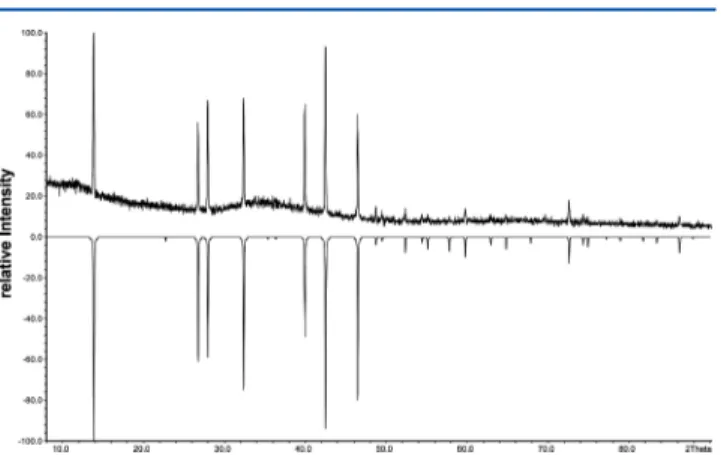
chromator. All reflections could be indexed by Werner’s algorithm.27A cubicF-centered cell witha= 11.044(1) Å was determined in a least- squares refinement. Ag9FeS4.1Te1.9shows the same pattern, and the cell is also cubicF-centered witha= 11.0415(7) Å; see Figure 1. The differences of the lattice constants are within three esd’s. Powder diffraction data are provided as Supporting Information (Tables S11, S12).
Thermal Analysis. Difference thermal analysis (DTA) measure- ments of Ag9FeS4.1Te1.9were performed with a SETARAM TG/DTA 92-16. The ground samples were placed in evacuated silica tubes and measured in the temperature range from 298 to 1273 K with a heating rate of 10 K/min.
Low-temperature differential scanning calorimetry (DSC) of Ag9FeS4.1Te1.9was performed with a METTLER TOLEDO DSC 30 instrument in the temperature range from 123 to 298 K with a heating rate of 10 K/min; see Figure 2.
Single Crystal Structure Determination.An appropriate piece of a selected single crystal was fixed to a glass capillary and then mounted on an Oxford Diffraction Gemini R Ultra single crystal diffractometer with CCD detector using a graphite monochromator and Mo Kαradiation. The crystal wasfirst measured at 293 K. Since the DSC measurements show a phase transition (see below), the crystal was slowly cooled down to 200 K, held at this temperature for approximately one hour, and then measured again at this temperature.
A subsequent X-ray measurement at room temperature revealed the initial cell. All these measurements were performed in one series on one single crystal without taking it offthe diffractometer. The crystal Figure 1. Measured powder diffraction pattern of Ag9FeS4.1Te1.9 at 293 K in comparison with a pattern calculated from single crystal data.
Figure 2.DSC curve of Ag9FeS4.1Te1.9, showing a first order phase transition at 232 K (onset temperature of thefirst cooling cycle). The enthalpy of the phase transition is 7.9 kJ/mol (calculated from the peak area of the cooling cycle).
quality did not suffer from the phase transitions during this series.
Temperature was controlled with an Oxford Cryojet Controller.
Data processing was carried out with the CrysAlisPro28 software package. An analytical numerical absorption correction according to Clark and Reid29 was applied in the Laue-class m3̅ for the measurement at 200 K (Rint= 0.030) and in the Laue-class m3̅m (Rint= 0.029) for the RT measurements. The structures were solved by direct methods using Sir9230and then refined with SHELX-97.31In the last stage of the refinement a huge number of so-called split positions with rather low occupation factors had to be taken into account for the silver atoms. Nonharmonic refinements11 using the Gram-Charlier expansion were then performed with the JANA200632 program package. Thus, it is possible to reduce the number of free variables and to reduce the correlation between different parameters.
Nonharmonic tensor elements smaller than 3σ were fixed to 0 in subsequent refinement cycles. The significance of the higher-order tensor elements was carefully checked as described in the literature.12 All structure models were checked for twinning with TWINROT- MAT. The models were standardized with the program STRUCTURE TIDY.33Both programs are included in the PLATON34program suite.
Structures were visualized by using the program Endeavor.35 The joint-probability-density functions (j.p.d.f.) were visualized with Tecplot 360.36
Ag9FeS4.1Te1.9−cP64. The structure of Ag9FeS4.1Te1.9 at 200 K was solved straightforward in the acentric space group P213. A structure model with fully occupied sites for all atoms could be refined to acceptable reliability factors at afirst stage. The refinement was then further improved by introduction of nonharmonic third order tensors for the displacement parameters of the silver atoms. A subsequent refinement of the tellurium site occupancies showed that the Te2 site 4d is not fully occupied. Contrary, the Te1 site 4a showed full occupation. Therefore a mixed occupation of the 4dsite by sulfur and tellurium was introduced and restrained to full occupation. Thus, the refinement converged to afinalR1= 1.55,wR2= 5.23, and a GoF = 1.07 for all 1804 unique reflections and 66 parameters. The refined formula is Ag9FeS4.1Te1.9.
Ag9FeS4.1Te1.9−cF64.The structure of Ag9FeS4.1Te1.9at ambient temperature was solved in the acentric space group F4̅3m. The refinement of the low temperature phase revealed clearly that one Te site shows a mixed occupancy by tellurium and sulfur and that the formula Ag9FeS4.1Te1.9is applicable. As a result of the fact that silver is completely ordered in Ag9FeS4.1Te1.9−cP64, it can be assumed that the site occupation factors (s.o.f.) refined for the low temperature modification are quite precise. Therefore, the s.o.f.’s for Te2/S3 were transferred from the low temperature structure to the room temperature model. Furthermore, electroneutrality was assured by introducing an appropriate equation for the s.o.f.’s of the disordered silver sites. The most reasonable model was obtained by refining three silver sites with fourth order nonharmonic tensors. The least-squares refinement for Ag9.1FeS4.1Te1.9 finally converged toR1 = 3.51% and wR2 = 10.66% with 52 parameters for 303 unique reflections. This ratio of parameters to reflections is still acceptable in the case of such nonharmonic refinements, and this kind of refinement does not suffer from severe correlation effects as a conventional split model would do.
Crystallographic parameters for both modifications are provided in Table 1, and positional parameters are listed in Tables 2 and 3.
Anisotropic and nonharmonic displacement parameters are provided as Supporting Information (Tables S5, S6, S8, and S9) as well as selected bond lengths and angles (Tables S7 and S10).
Impedance Measurements.Temperature dependent impedance measurements were performed with an IM6 impedance analyzer (Zahner Elektrik) in the frequency range from 1 MHz to 1 Hz and in the temperature range from 323 to 473 K. The amplitude was 10 mV.
Thefinely ground samples were pressed into cylindrical pellets of 8 mm diameter and placed between two sets of electron blocking electrodes composed of Ag, a mixture of Ag and RbAg4I5, and pure RbAg4I5. The measurements were carried out in a homemade cell as described elsewhere.37,38A weak stream of dry argon passed through the cell during the measurements. The measurements were carried out in steps of 10 K with annealing periods of 40 min to ensure
equilibrating of the samples. The ionic conductivities were determined from Nyquist plots.
Magnetism. The magnetic measurements were carried out on a QUANTUM DESIGN Physical Property Measurement System (PPMS) using the VSM option. For VSM measurements 74.97 mg of the polycrystalline Ag9FeS4.1Te1.9 sample were packed in a polypropylene capsule. The capsule was attached to a sample holder rod for measuring the magnetic properties in the temperature range of 3−300 K with magneticflux densities up to 10 kOe.
Mössbauer Spectroscopy. A 57Co/Rh source was available for the 57Fe Mössbauer spectroscopy investigations. The Ag9FeS4.1Te1.9 sample was placed in a thin-walled PVC container at an optimized thickness of about 0.9 mg Fe/cm2. The measurements were run in the usual transmission geometry at 298, 78, and 5 K. The source was kept at room temperature. The total counting times were 7 d for the 298 and 78 K and 15 d for the 5 K measurement.
■
RESULTS AND DISCUSSIONThermal Analyses.DTA measurements indicate congruent melting of the sample. The melting point is 911 K, and the crystallization point is 881 K. DSC measurements show a reversible phase transition at 232 K with an enthalpy of 7.9 kJ/
mol (first cooling cycle) (see Figure 2).
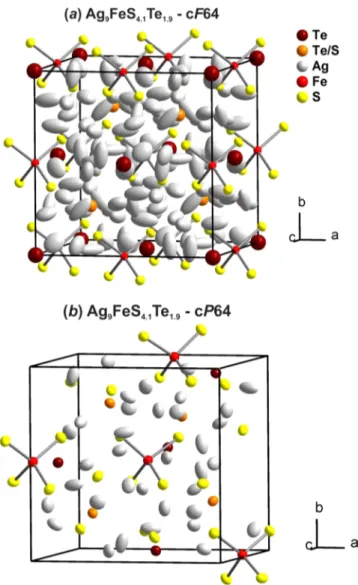
Crystal Structure. Ag9FeS4.1Te1.9−cF64 crystallizes in the acentric cubic space groupF4̅3mwitha= 11.0415(7) Å which corresponds to the high temperature modification of the argyrodite structure type (Figure 3a). This structure type is well Table 1. Crystallographic Data and Experimental Conditions of Ag9FeS4.1Te1.9
refined composition: Ag9FeS4.094Te1.906
color gray
formular weight (g mol−1) 1401.18 crystal dimension (mm3) 0.55×0.46×0.34
temperature (K) 200 293
crystal system,Z cubic, 4 cubic, 4
space group P213 F4̅3m
No. 198 No. 216
lattice parameters single crystal powder
a(Å) 11.0213(1) 11.0415(7)
V (Å3) 1338.75(2) 1346.1(1)
absorption coeff.μ(Mo) 18.6 18.5
ρcalc(g cm−3) 6.95 6.91
diffractometer Xcalibur, Ruby, Gemini ultra
wavelength Mo Kα1,λ= 0.71073 Å
monochromator graphite
absorption correction analytical numerical29
software CrysAlisPro28
hklranges −17≤h≤13 −16≤h≤16
−14≤k≤17 −16≤k≤16
−17≤l≤16 −16≤l≤13
measured reflections 15255 4433
indep. reflections (I> 3σI) 1772 287
Rint;Rσ 3.03; 1.31 2.90; 1.25
2θrange (deg) 6.4−68.4 6.6−66.6
no. of parameters 66 52
structure solution Sir9230
structure refinement SHELXL-97,31Jana200632
weighting scheme σ
extinction coefficient (GIso) 0.054(6) 0.23(3) R(obs) (I> 3σI);R(all) 1.49; 1.55 3.36; 3.51 Rw(obs) (I> 3σI);Rw(all) 5.16; 5.23 10.51; 10.66
GOF(obs); GOF(all) 1.06; 1.07 2.22; 2.17
res. electron density (e Å−3) +0.63;−0.56 +0.76;−0.42
established, and therefore only the major facts will be discussed herein. Tellurium Te1, site 4a, forms the motif of a cubic closest packing in which half of the tetrahedral holes is statistically occupied by tellurium and sulfur (Te2/S2, site 4d), respectively. However, this is just the motif of the packing and there are no bonding interactions present between the constituting atoms. Iron, Fe1, site 4b, occupies the second set of tetrahedral holes of this cubic closest packing, and it is coordinated by four sulfur atoms on site S1, 16e. The distances within this tetrahedron [FeS4] ared(Fe−S) = 2.278(1) Å, and the angles∠(S−Fe−S) are 109.47°due to the local symmetry.
In the title compound silver shows a strong nonharmonic behavior. It partially occupies one 24gsite and two 48hsites.
The displacement parameters for Te2 and for Fe1 are rather large. This effect is also observed in other argyrodite-type compounds like inγ-Ag7PSe6,4where phosphorus and selenium show large displacement parameters. The high displacement parameters of phosphorus and selenium are ascribed to the high ionic conductivity of that phase. On cooling the crystal to 200 K the compound fulfills a reversible phase transition and crystallizes in the acentric space groupP213 withZ= 4 (Figure 3). The anion substructure is similar to that of Ag9.1FeS4.1Te1.9−cF64, but the atoms are shifted from the ideal positions in comparison to theγphase. Sulfur is located in two sites instead of one in this low temperature modification (S1, site 4a, and site S2, site 12b). Iron coordinates to both sites, forming a distorted tetrahedron. The distance Fe1−S1 is 2.2493(9) Å, and the distance Fe1−S2 is 2.287(1) Å. The angle S1−Fe1−S2 is 110.95°, and the angle S2−Fe1−S2 is 107.95°. Silver is mainly distributed over three 12bsites. The R-values
drop significantly upon splitting these sites into two sites with distances of less than 0.3 Å. This illustrates the mobility of silver in this material, even at 200 K. TheR-values of the anisotropic split model seemed good, but there were large correlations.
Therefore, these silver sites were treated by a nonharmonic refinement with higher order tensors. Since the displacement parameters of Te2 were unreasonably large at this stage of the refinement a tellurium−sulfur mixed occupation of this site was introduced. The coordinates and ADPs for Te2 and S3 were constrained, and full site occupancy was maintained. At thefinal stage of the refinement all silver atoms are shifted out of the centers of the surrounding tetrahedra formed by sulfur and tellurium toward a trigonal planar coordination (Figure 4). The results of the nonharmonic refinement are displayed in Figure 5. It becomes obvious that silver occupies numerous sites which are connected by positions with a significant electron density.
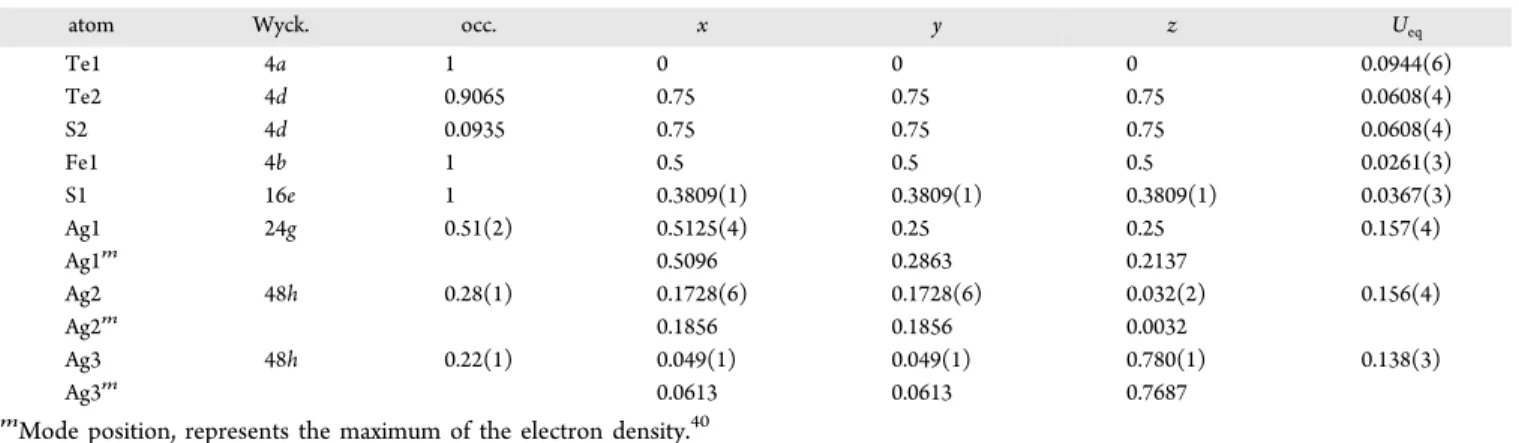
Magnetic Properties of Ag9FeS4.1Te1.9.The temperature dependence of the magnetic and reciprocal magnetic susceptibility of Ag9FeS4.1Te1.9 is displayed in Figure 6. The inverse magnetic susceptibility (χ−1 data) displays a nearly linear dependence in the temperature range of 100−240 K which can befitted using the Curie−Weiss law. This results in an effective magnetic moment ofμeff= 5.80(1)μB/Fe atom and a Weiss constant ofθp= −301(1) K. The effective magnetic moment is close to the expected value of 5.92μBfor a spin-only high-spin system withS= 5/2 (Fe(III)). This also supports the Mössbauer spectroscopic measurements, showing that the iron atoms are indeed in a stable trivalent state. The high negative value ofθpsuggests strong antiferromagnetic interactions in the paramagnetic range. Due to these strong interactions the onset Table 2. Atomic Parameters and Equivalent Isotropic Displacement ParametersUeqin Å2for Ag9FeS4.1Te1.9−cF64 at 293 K
atom Wyck. occ. x y z Ueq
Te1 4a 1 0 0 0 0.0944(6)
Te2 4d 0.9065 0.75 0.75 0.75 0.0608(4)
S2 4d 0.0935 0.75 0.75 0.75 0.0608(4)
Fe1 4b 1 0.5 0.5 0.5 0.0261(3)
S1 16e 1 0.3809(1) 0.3809(1) 0.3809(1) 0.0367(3)
Ag1 24g 0.51(2) 0.5125(4) 0.25 0.25 0.157(4)
Ag1m 0.5096 0.2863 0.2137
Ag2 48h 0.28(1) 0.1728(6) 0.1728(6) 0.032(2) 0.156(4)
Ag2m 0.1856 0.1856 0.0032
Ag3 48h 0.22(1) 0.049(1) 0.049(1) 0.780(1) 0.138(3)
Ag3m 0.0613 0.0613 0.7687
mMode position, represents the maximum of the electron density.40
Table 3. Atomic Parameters and Equivalent Isotropic Displacement ParametersUeqin Å2for Ag9FeS4.1Te1.90−cP64 at 200 K
atom Wyck. occ. x y z Ueq
Te1 4a 1 0.97575(2) 0.97575(2) 0.97575(2) 0.01456(4)
Te2 4a 0.906(4) 0.73366(2) 0.73366(2) 0.73366(2) 0.01402(7)
S3 4a 0.094 0.73366(2) 0.73366(2) 0.73366(2) 0.01402(7)
Fe1 4a 1 0.48993(4) 0.48993(4) 0.48993(4) 0.01273(8)
S1 4a 1 0.37210(7) 0.37210(7) 0.37210(7) 0.0168(1)
S2 12b 1 0.10118(8) 0.12498(8) 0.37793(8) 0.0158(2)
Ag1 12b 1 0.03090(4) 0.61847(7) 0.31210(4) 0.02604(8)
Ag1m 0.0304 0.6156 0.3106
Ag2 12b 1 0.22908(8) 0.27375(3) 0.52026(6) 0.02767(8)
Ag2m 0.2269 0.2736 0.5205
Ag3 12b 1 0.05290(8) 0.34655(3) 0.31180(4) 0.0310(1)
Ag3m 0.0514 0.3469 0.3124
mMode position, represents the maximum of the electron density.
of antiferromagnetic ordering is observed by the sharp downturn in the χ data below 22 K. The Neel temperaturé can be determined toTN = 22.1(5) K.
Another anomaly in the magnetic susceptibility data is visible in the range of 250−260 K. This is associated with the structural phase transition (vide infra).
57Fe Mössbauer Spectroscopy of Ag9FeS4.1Te1.9. The
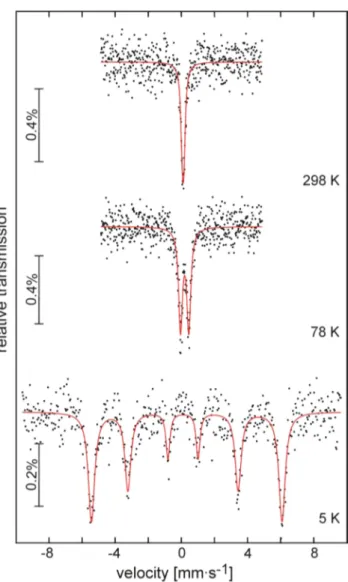
57Fe Mössbauer spectra of Ag9FeS4.1Te1.9 at 298, 78, and 5 K are presented in Figure 7 together with transmission integral fits. The correspondingfitting parameters are listed in Table 4.
The room temperature spectrum was well reproduced with a single signal, subjected to weak quadrupole splitting ofΔEQ = 0.09(2) mm/s. The isomer shift ofδ= 0.11(1) mm/s is clearly indicative of Fe(III). In agreement with the anomaly observed in the susceptibility data and the structural phase transition we observe a change in the shape of the57Fe spectrum. Due to the lowering of the iron site symmetry from the high-temperature (F4̅3m) to the low-temperature phase (P213), the electron density around the iron nuclei becomes less symmetric and consequently the electric quadrupole splitting parameter increases to 0.50(1) mm/s.
The magnetic ordering is manifested in the 5 K spectrum.
We observe the typical hyperfine field splitting of iron with a hyperfinefield of 35.7 T at the iron nuclei. Such high magnetic hyperfine fields are typically observed in iron sulfides in the magnetically ordered state, e.g., Fe0.92S.39
Ionic Conductivity.Electron blocking electrodes were used in order to measure the pure ionic conductivity of the samples.
The Nyquist plot shows the typical characteristics of an ionic conductor. At lower temperatures impedance spectra show a semicircle with a spike at low frequencies. Conductivities were derived from ZReal values at the local minimum of the Figure 3.(a) Unit cell of Ag9FeS4.1Te1.9−cF64 at 293 K. Ellipsoids
correspond to a probability of 50%. (b) Unit cell of Ag9FeS4.1Te1.9− cP64 at 200 K. Ellipsoids correspond to a probability of 90%.
Figure 4. Section of the crystal structure of Ag9FeS4.1Te1.9−cP64.
Anisotropic illustration of the three different silver sites within a polyhedron of sulfur and tellurium. Ellipsoids are drawn at 90%
probability.
Figure 5.Section of the crystal structure of Ag9FeS4.1Te1.9−cF64. (a) Anisotropic illustration and (b) j.p.d.f. isosurface of the silver sites in a polyhedron of sulfur and tellurium. Anisotropic displacement parameters are scaled to a probability of 60% (a), and the iso-surface of the j.p.d.f. corresponds to a probability of 90% (b).
Figure 6.Temperature dependence of the magnetic susceptibility (χ andχ−1data) of Ag9FeS4.1Te1.9measured at 10 kOe.
impedance spectra. At higher temperatures the curve progression becomes more and more linear. Above 423 K it is no longer possible to distinguish between semicircle and spike, due to an enhanced ionic conductivity. Sample geometry and the experimental density of the pellets were taken into account when calculating the conductivities.
The ionic conductivities determined from the heating cycle areσ = 1.81×10⁻²S cm−1at 323 K and σ= 1.41 ×10⁻¹S cm−1at 468 K. The Arrhenius plot is shown in Figure 8. An activation energy of EA = 0.19 eV was determined in the temperature range from 323 to 423 K. At higher temperatures EAdrops to even smaller values. This might be due to a change in the occupation of the different silver sites. However, high temperature diffraction experiments are necessary to get further insight in this change of the ionic conductivity.
■
CONCLUSIONThe compound Ag9.1FeS4.1Te1.9 is the first iron containing member of the argyrodite family. Like many other aryrodites it fulfills a reversible phase transition at low temperatures. The RT and LT structures were determined by single crystal X-ray crystallography. A nonharmonic approach was used to describe the delocalization of silver in both modifications. Silver becomes more and more localized combined with a decreasing coordination number upon cooling the samples. Crystallo- graphic observations are confirmed by Mössbauer spectroscopy.
Measurements of magnetic susceptibility show that the compound is paramagnetic. Ag9.1FeS4.1Te1.9 shows remarkable silver ion conductivity.
■
ASSOCIATED CONTENT*S Supporting Information
Powder diffraction data, tables of atomic coordinates, anisotropic and nonharmonic displacement parameters, and table of selected bond lengths and angles of synthetic Ag9FeS4.1Te1.9at 293 K and at 200 K. This material is available free of charge via the Internet at http://pubs.acs.org.
■
AUTHOR INFORMATION Corresponding Author*E-mail: arno.pfitzner@chemie.uni-regensburg.de. Phone: (+) 499419434551. Fax: (+)49941943814551.
Notes
The authors declare no competingfinancial interest.
■
ACKNOWLEDGMENTSWe thank Dr. T. Langer for help with the Mössbauer spectroscopic experiment and Jens Braese for some exper- imental help.
■
(1) Deiseroth, H.-J.; Kong, S.-T.; Eckert, H.; Vannahme, J.; Reiner,REFERENCES C.; Zaiß, T.; Schlosser, M.Angew. Chem., Int. Ed.2008,47, 755.(2) Deiseroth, H.-J.; Maier, J.; Weichert, K.; Nickel, V.; Kong, S.-T.;
Reiner, C.Z. Anorg. Allg. Chem.2011,637, 1287.
(3) Boucher, F.; Evain, M.; Brec, R.J. Solid State Chem.1993,107, 332.
(4) Evain, M.; Gaudin, E.; Boucher, F.; Petricek, V.; Taulelle, F.Acta Crystallogr.1998,B54, 376.
(5) Nilges, T.; Pfitzner, A.Z. Kristallogr.2005,220, 281.
Figure 7.Experimental (data points) and simulated (continuous lines)
57Fe Mössbauer spectra of Ag9FeS4.1Te1.9at 298, 78, and 5 K.
Table 4. Fitting Parameters of57Fe Mössbauer Spectroscopic Measurements of Ag9FeS4.1Te1.9at 298, 78, and 5 Ka
T(K) δ(mm s−1) ΔEQ(mm s−1) Γ(mm s−1) BHf(T)
298 0.11(1) 0.09(2) 0.22(2) −
78 0.20(1) 0.50(1) 0.28(1) −
5 0.21(1) 0.23(2) 0.28(5) 35.7(1)
aδ = isomer shift, ΔEQ = electric quadrupole splitting, Γ = experimental line width,BHf= magnetic hyperfinefield.
Figure 8.Arrhenius plot of the specific conductivities of Ag9FeS4.1Te1.9
in the temperature range from 323 to 473 K.
(6) Studenyak, I. P.; Kranjčec, M.; Kovács, G. S.; Desnica-Franković, I. D.; Molnar, A. A.; Panko, V. V.; Slivka, V. Y.J. Phys. Chem. Solids 2002,63, 267.
(7) Kuhs, W. F.; Nitsche, R.; Scheunemann, K.Mater. Res. Bull.1979, 14, 241.
(8) Wada, H.; Sato, A.J. Cryst. Growth1993,128, 1109.
(9) Wada, H.; Ishii, M.; Onoda, M.; Tansho, M.; Sato, A.Solid State Ionics1996,86−88, 159.
(10) Wada, H.; Sato, A.; Onoda, M.; Adams, S.; Tansho, M.; Ishii, M.
Solid State Ionics2002,154−155, 723.
(11) Zucker, U. H.; Schulz, H.Acta Crystallogr.1982,A38, 563.
(12) Pfitzner, A.; Evain, M.; Petricek, V.Acta Crystallogr.1997,B53, 337.
(13) Nilges, T. Dissertation, Universitat Siegen, Siegen, 2001.̈ (14) Belin, R.; Aldon, L.; Zerouale, A.; Belin, C.; Ribes, M.Solid State Sci.2001,3, 251.
(15) Kong, S. T.; Deiseroth, H. J.; Reiner, C.; Gün, Ö.; Neumann, E.;
Ritter, C.; Zahn, D.Chem.Eur. J.2010,16, 2198.
(16) Kong, S.-T.; Deiseroth, H.-J.; Maier, J.; Nickel, V.; Weichert, K.;
Reiner, C.Z. Anorg. Allg. Chem.2010,636, 1920.
(17) Gu, X.; Watanabe, M.; Xie, X.; Peng, S.; Nakamuta, Y.; Ohkawa, M.; Hoshino, K.; Ohsumi, K.; Shibata, Y. Chin. Sci. Bull. 2008,53, 3567.
(18) Hellstrom, E. E.; Huggins, R. A.J. Solid State Chem.1980,35, 207.
(19) Deloume, J.-P.; Faure, R.J. Solid State Chem.1981,36, 112.
(20) Gaudin, E.; Deiseroth, H. J.; Zaiß, T.Z. Kristallogr.2001,216, 39.
(21) Zaiß, T.; Deiseroth, H. J.Z. Kristallogr.2006,221, 119.
(22) Shannon, R.Acta Crystallogr.1976,A32, 751.
(23) Jörgens, S.; Mewis, A.Solid State Sci.2007,9, 213.
(24) Jabłońska, M.; Pfitzner, A.Z. Anorg. Allg. Chem.2004,630, 1731.
(25) Wagener, M.; Deiseroth, H.-J.; Reiner, C.Z. Kristallogr. 2006, 221, 533.
(26) Mikolaichuk, A.; Moroz, N.; Demchenko, P.; Akselrud, L.;
Gladyshevskii, R.Inorg. Mater.2010,46, 590.
(27) Werner, P. E.; Eriksson, L.; Westdahl, M.J. Appl. Crystallogr.
1985,18, 367.
(28) Agilent Technologies XRD Products. CrysAlisPro; Agilent Technologies XRD Products: 2010.
(29) Clark, R. C.; Reid, J. S.Acta Crystallogr.1995,A51, 887.
(30) Altomare, A.; Cascarano, G.; Giacovazzo, C.; Guagliardi, A.;
Burla, M. C.; Polidori, G.; Camalli, M.J. Appl. Crystallogr.1994,27, 435.
(31) Sheldrick, G.Acta Crystallogr.2008,A64, 112.
(32) Petricek, V.; Dusek, M.; Palatinus, L.Jana2006. The crystallo- graphic computing system; Institute of Physics: Praha, Czech Republic, 2006.
(33) Gelato, L. M.; Parthé, E.J. Appl. Crystallogr.1987,20, 139.
(34) Spek, A.J. Appl. Crystallogr.2003,36, 7.
(35) Crystal Impact GbR Endeavour, Version 1.7e; Crystal Impact GbR: Bonn, 2010.
(36) Tecplot, Inc.Tecplot, Version 360, 2010; Tecplot, Inc.: Bellevue, WA, U.S.A, 2010.
(37) Freudenthaler, E. Universität Siegen, 1997.
(38) Freudenthaler, E.; Pfitzner, A.Solid State Ionics1997,101−103, 1053.
(39) Kim, W.; Park, I. J.; Kim, C. S.J. Appl. Phys.2009,105, 07D535.
(40) Kuhs, W.Acta Crystallogr.1992,A48, 80.