RELAXATION PHENOMENA AND POLYMER STRUCTURE
A. E. WoonwARD
Chemistry Department, The City College of the City University
of
New York, U.S.A.INTRODUCTION
In recent years a considerable amount of information concerning seg- mental motion in high polymers and the relaxation phenomena which are a consequence of the onset of such motion has been gathered and our know- ledge of this behaviour has been greatly advanced. Since the extent and types of motion taking place in a solid material strongly influence all the physical properties, these investigations have practical, as well as theoretical, interest. The experimental methods used to obtain this information have incl uded : ( a) d ynamic mechanical, ( b) transien t mechanical, such as creep or stress relaxation, (c) dynamic electrical, and ( d) steady-state and transient nuclear magnetic resonance (NMR) methods. In the present paper we will be principally interested in techniques (a) and (d).
In a dynamic mechanical experiment a time varying stress is applied to a sample resulting in a strain also varying with time which can be split into two components, one in phase with the stress and one 90° out of phase with the stress; the former component is proportional to the energy stored per cycle and the latter to the energy loss per cycle. In such experiments run at near- constant frequency over a wide temperature range, peaks in the loss modulus and dispersions in the storage modulus result. As expected for relaxation phenomena, an increase in measuring frequency Ieads to a shift of these processes to higher temperatures. Attempts to ascribe these processes as due to the onset of such motions as side-chain and main-chain oscillations andjor rotations in the polymer at or near the measuring frequency have been made by comparing results obtained on a variety of different polymers and by correlating the temperature-frequency positions of these processes with those found using other methods, such as: NMR, dielectric and volume-tempera- ture measurementsl. I t also should be pointed out that the storage modulus value at any given temperature is a useful measure of the specimen rigidity or inversely the flexibility, the latter increasing with temperature due to the increasing amounts of chain motion.
Turning now to the NMR techniques, there are two quantities of interest to us, one of these is the width ( or the second moment) of the steady-state NMR absorption envelope, which is a measure of the spin-spin interaction and the other is the spin-lattice relaxation time, T1, the time constant for the energy transfer which can occur between the nuclei in the higher energy spin states or state and the surroundings or lattice. The effect of motion on these quantities is to narrow the absorption ( to decrease the second moment
A.
of the central portion of the absorption) and to shorten the relaxation time, the latter leading to a more efficient energy transfer process. Therefore, when measurements are made over a wide temperature range, starting at low temperatures, the peak-to-peak width of the derivative NMR absorp- tion will decrease, if motion of the magnetic nuclei at the appropriate frequency occurs, this frequency being of the order of the absorption width ,....,._ 104-105 cjs; motion ofthe lattice Ieads to a minimumin the T1-tempera- ture plot, this minimum being found at a temperature where the frequency of the motion is near the resonance frequency (,....,._ 10L108 cjs). Due to the higher frequency ofthe measurement, the T 1 minimum is expected at some- what high er temperatures than the mid-point of the second moment decrease for any particular process.
One definite advantage of the steady state absorption method is that the second moment values can be compared with values calculated using the van Vleck equation2 if the distances between the interacting nuclei are known (1JH2 r-..; 1/r6). In the calculation a value for the rigid lattice is obtained. In addition, estimates of the reduction in this value as a conse- quence of simple types of motion, such as methyl rotation about the C3 axis, can be made3. Replacement of magnetic nuclei with others whose interac- tions are not apparent using the particular conditions of frequency and field employed can also be helpful in determining the type of motion responsible for a given process. Since we will be concerned only with proton resonance, the best nucleus for this replacement would be deuterium since this would probably cause the least change in other physical properties ofthe polymer.
During the remainder of this paper, data for a number of polymers will be presented and discussed. The polymers chosen for discussion have been mainly those studied by the author and his co-workers and have been chosen to demonstrate some of the similarities and differences found in the dynamic mechanical and NMR results. In most cases the explanations given for the various relaxation processes aretentative and are by no means agreed on by all the workers in the field. I t should be noted that in only a few cases have the mechanical and NMR measurements been carried out on the same batch of a given polymer from the same supplier. In general, three or four different samples have been used and therefore ambiguities in the data due to this are bound to occur.
LINEAR POLYETHYLENE
Although linear polyethylene has received considerable study to date and it is well recognized that a number of relaxation processes exist for this polymer, the exact natures of these processes arestill subjects of controversy.
At the lowest temperatures for which sturlies have been reported4 to date, 4·2-6°K among sixteen polymers containing various repeat units, a melt-formed linear polyethylene specimen was found to have the lowest dynamic elastic loss modulus, E", (0·07-0·09 X 108 dynesfcm 2 and the highest dynamic elastic storage modulus, E', (1·0 X 1011 dynesjcm2). As might be expected, therefore, a linear polymer with no side chains and with a high degree of chain order shows little molecular activity at these tempera- tures. However, as i~ evident in Figure 1, this state of low molecular activity does not persist as the temperature is raised, since mechanicalloss maxima,
storage modulus dispersions, NMR line narrowing and T1 minima are found with some of these occurring weil below the melting point.
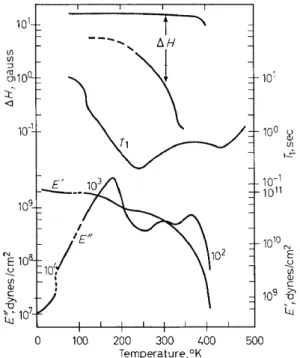
The mechanical data, E' and E", given in Figure 1, at temperatures from 6° to 77°K were obtained for Marlex SO using a longitudinal vibration apparatus5 operating at ~ 104 cjs. The break in the loss curve at ~ 47°K
101 ....
t '
'
t.H(/)
\
(/) :J
~100
::t~
<I
10-1
r,
0 100 200 300 L.OO 500
Temperature, °K
Figure 1. Dynamic elastic storage modulus, E', dynamic elastic loss modulus, E", NMR line width 6.H, and spin-lattice relaxation time, T1, v. temperature for linear polyethylene. Data from references 4, 7, 8 and 9. (Note: the numbers on the loss curve correspond to the approxi-
mate frequency of measurement)
corresponds to a change in method for obtaining the loss with the values at temperatures below 47°K being taken by a free decay type method and those at temperatures above 47°K by a forced vibration band-width type measure- ment. The data at temperatures above ~ 110°K were taken using a trans- verse vibration apparatus6,7, the frequency varying from about 2 X 10³ to 2 X 10² cjs as the temperature increased. In the original publication the loss data were reported in terms of Q-1 ; the E" values given in Figure 1, and in all the following figures which contain transverse vibration data, were cal- culated from the appropriate expression, E'' = Q-1JE'. The broad line NMR data in Figure 1 were obtained8 for Marlex SO at 40 Mcjs and the spin-lattice relaxationtime (TI) measurements9 for Rigidex 3S at 21·S mcjs using the apparatus of Mansfield and PowleslO. In the linewidth data the dashed line for the narrow component, indicates that only approximate values are available due to difficulty in resolution at low temperatures.
The y process, found at 175°K (1·2 X 103 cjs) in the mechanicalloss data, at 245°K (3·5 X 107 cjs) by T1 measurements and probably corresponding to the appearance of the narrow component in the steady-state NMR
measurements for melt formed samples is presently believed by a number of workers in the field to be due, at least in part, to torsional oscillation of a small number (2-4) of CH2 units in the disordered or amorphous parts. Due to the fact that a loss maximum in this frequency-temperature range is found for pressed mats of linear polyethylene crystals grown from dilute solution11 • 12 but is absent or nearly so in unpressed crystals13, has led to the p'roposal that at least part of the y-process may be a consequence of lattice defect rootion. These defects could be of various sorts including the point dislocation proposed by Reneker14 and the single or double kinks described by Peckhold et al12• Unpressed mats of polyethylene crystals exhibit a T1
minimum at about 245°K the same as for the roelt-forroed sample. However, it is possible that motion of a very small portion of protons in diserdered regions could Iead to relaxation of the much larger number in the erdered regions.
A mechanical loss maximum in this frequency-temperature region has also been reported for various other linear polymers including polytetra- ßuoroethylene, some poly( alkylene oxides), a number of polyamides, a polyurethane, a polyurea and some polyesters. Such a maximum has been found for all polyamides studies to date, the material with the smallest number of consecutive CH2 units being Nylon 4 (3CH2 units)15. Data have been reported16 which indicate that poly( ethylene terephthalate), with two consecutive CH2 units may exhibit such a maxiroum. However, due to the presence of a roore pronounced peak at 210°K (1 cjs) the ro--t 130°K peak only appears as a shoulder. Studies of other polymers containing only one or two CH2 units between aroide groups or some other relatively rigid unit should be carried out in order to deterroine experimentally the minimum number of CH2 units involved.
Evidence that the processes in polytetraßuoroethylene17, 18 and poly- oxymethylene19 are associated with motion in the diserdered regions is given by the fact that samples prepared by queuehing show greater modulus dis- persions and somewhat higher loss roodulus maxima than do annealed ones.
The Ya mechanical loss modulus maxirouro at 300°K (810 cjs) has been found to decrease in size with increasing order20, 21 (increasing annealing) which indicates a dependence on the moveroent of chain segments in the diserdered regions. For branched polyethylene this is generally a predomin- ate process and therefore it has been proposed that the motion taking place can involve CH units as weil as CH 2 side chain and roain chain units; this means that rootion of a !arger nurober of segments than the nurober in- volved in the y-process is taking place in the aa process. The narrowing ofthe NMR sharp line at ro--t 320°K ( ~ 104 cjs) (see Figure 1) has been associated with the aa loss maxiroum. In previously unheated crystals this narrow coro- ponent does not appear until heating to elevated temperatures (396°K for 12 h) has been accoroplished which is evidence that defects or diserdered regions are involved 8.
The ac loss roodulus peak seen at 360°K (500 cjs) isfound21 to increasein size upon annealing roelt-formed samples, thereby indicating its dependence on the crystalline regions. Two possible roechanisms, among many, which could be responsible for this loss peak are: the onset of torsional oscillation in the crystalline regions22, and spherulite distortion and motion, known to
occur at 270°K and up23. It is tobe noted that very low frequency measure- ments show two separate loss maxima in the so-called ac region24a. One of these maxima (ac') does not appear to occur at frequencies above 102 cjs prior to melting while the other ( ac) appears tobe connected with the NMR broad line decrease (390°K; 104 cjs) and the high temperature T1 minimum ( 440°K; 3·5 X 107 cjs) leading to its assignment as due to chain torsion in the crystalline parts22 · 24b. It is reasonable to expect that the mechanism with the low frequency cut-off will be connected with motion of large units such as lamellae or spherulites and therefore this is assumed to account for the ac' mechanism. It should be pointed out that the high temperature T1 minimum is found9 above the melting point (410°K) for linear polyethylene when measurements are made as the specimen is heated up. When the melt is cooled from around 500°K the high temperature T1 minimum is found at about 400°K having shifted to lower temperatures presumably due to crystallization taking place at a lower temperature than melting. This is consistent with a strong effect of crystallinity on the process leading to this minimum. Further T1 measurements in this temperature range are neces- sary to specify in more detail the motional behaviour in the 107-108 cjs frequency region.
POLY ( a-OLEFINS)
A majority of the studies of the relaxation behaviour of poly( a-olefins) have been confined to polypropylene, the member with the simplest repeat unit. In Figure 2 mechanicalloss and storage modulus data from 6° to 270°K, obtained4 with the longitudinal vibration apparatus at ,_, 104 cjs and from ,_, 120°-440°K using the transverse beam apparatus25 at frequencies of 2 X 10³ to 102 cjs are shown along with measurements ofthe second moment of the NMR absorption (1JH2)26 from ,_, 77°-310°K and T1 data27 from
"-' 80° to 470°K. A different sample of isotactic polypropylene was used in each ofthese investigations. It is tobe noted that the E" results obtained by the two methods gives the same values in the 235° to 270°K region. At least five separate relaxation processes are apparent in these data.
The aa process in the loss measurements, found at 290°K (103 cjs) is also apparent in the second moment and in the T1 measurements ("-'345°K;
3·5 X 107 cjs). A loss maximum for atactic noncrystallizable polypropylene occurs in the same temperature region and is associated with the change of the polymer from glass-like to rubber-like properties. Therefore, the aa process in the isotactic polymer is believed to involve segmental diffusion in disordered parts due to partial rotations about C-C bonds of the main chain. The T1 minimum at 165°K and the second moment decrease in the
.::=;;; 77°-130°K range have been established to be a consequence of CHa reorientation about the C3 symmetry axis by measurements on poly (3,3',3"- trideuteropropylene)26, 27. Although this type of motion leads to decided changes in the magnetic resonance quantities, a separate loss maximum is not found by the longitudinal vibration method at 104 cjs. However, the loss does increase in the 80°-160°K region, as is shown in Figure 3, and this may be, at least partially, due to the onset of methyl group motion.
If the assignments for the two above mechanisms are correct, then it
10°
() CIJ IJl
...:- 10-1
~
25 20 15 10 N N:r:
(fl (fl :;:) ~ nf109 1011 <l
N
E 0 ...
~108 101QN
c E
>.
"'C ... 0
Isotactic (fl
~ CIJ
107 Polypropylene 109 ~
[TH-cH]
Lu "'CCH3 n
0 100 200 300 400 500 108 Temperature, °K
Figure 2. Dynamic elastic storage modulus, E', dynamic elastic loss modulus, E", NMR second movement, tl.H2, and spin lattice relaxation time, T1, for isotactic polypropylene.
Data taken from references 4, 25, 26, 27
Tem perature, °K
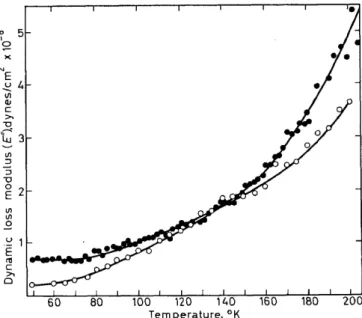
Figure 3. Dynamic loss modulus, E", from 50°-200°K for isotactic polypropylene (0) and non-crystallizable poly( methyl methacrylat e) ( e) calculated from data of Crissman4, 30
346
RELAXATION PHENOMENA AND POLYMER STRUCTURE appears reasonable to attribute the y loss maximum at 245°K (2 X 10³ cjs) to torsional motion of a limited number of chain units in the disordered regions, a mechanism similar to that believed responsible for the y peak for polyethylene. The shift of this mechanism by 70° to higher temperatures in going from polyethylene to polypropylene is believed tobe due to the greater mass of the repeat unit and possibly to steric reasons.
The ac loss modulus maximum has been found to increase in size when measurements are made on solution grown crystal mats, as compared with melt-formed samples28 and therefore appear to involve motion in the crystal- line regions.
The lowest temperature loss maximum (22°K; 104 cfs) has also been reported by Sinnott (19°K; 6 c/s) 29 and attributed to methyl reorienta- tions in the amorphous regions. However, the appearance of a loss maxi- mum in the same region for poly(vinyl chloride)4 , as seen in Figure 4, does not substantiate that assignment. As is further evident in Figures 4-6,
~ 3·0 E u
--;n 2·0
(]) c
>.
u .;:--- 1·0
!:Y-
(/1 :J
-u :J
E
2·o(/1 (/1
0 .~ E 1·0
ro c
>.
0
... ,
,
\I \
I \
I \
/P4MPl \
I \
I \
,'
\I \
-
PPr
PdlPO
/
\· ,/'
, _ . . " " ,
PBl
/
I I I I
66N
PE
PiBMA
20 40 60 20 40 60 so
Temperature, °K
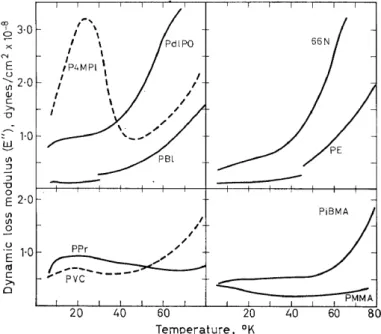
Figure 4. Dynamic loss modulus, E", v. temperature from 6° to 80°K for nine polymers4:
polyethylene (PE), nylon 66 (66N), polypropylene (PPr), poly(vinyl chloride) (PVC), poly- (butene-1) (PBI), poly(4 methyl pentene-1) (P4MP1), poly(dl-propylene oxide) (PdlPO),
poly(methyl methacrylate) (PMMA) and poly(isobutyl methacrylate) (PiBMA)
a large number of polymers of varying chemical units show very low tem- perature loss maxima accompanied by small storage modulus decreases.
The cause of these and the relationships between them are not entirely known, although in some cases they have been tentatively attributed to sidc chain oscillations.
Detailed studies ofthermal and stress history effects, the effects of impuri- ties, and the effect of frequency as well as further studies concerning chemi- cal composition of the polymer should be carried out in order to elucidate the mechanisms for the very low temperature loss maxima.
347
::::
~ gJ'F 3·0 - o ::J~
-g
XE!:
V)~V'l V) 2·0
..Q <11 u c >o
.E"
Cl! c
lO
>o 0
20 40 60 80 100 120 140 160 180 Temperature,°K
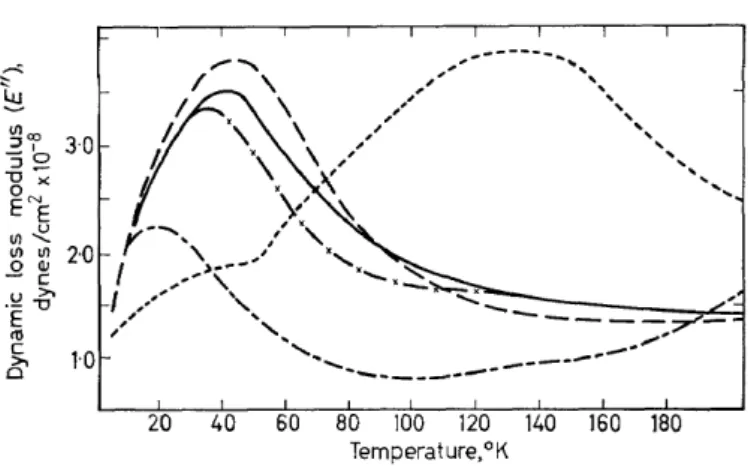
Figure 5. Dynamic loss modulus, E", v. temperature for polystyrene and various poly(methyl- styrenes)31; amorphaus isotactic polystyrene ( - - ) , poly(ortho methyl styrene) ( - / -), poly-(vinyl toluene): 70% para, 30% ortho (--), poly(vinyl toluene): 65% meta 35%
para ( - - - ) and poly(a-methyl styrene) (----)
0
I 0
X
('JE
u Vl
<11
10
u
;,a
~
V'l ::J 7
::J
"0 0
E
~6
~ 0
Vi
4
0 20 40 60 80
Temperature, °K
Figure 6. Dynamic storage modulus, E', v. temperature for various polymers4 • 3l [same legend as for Figure 4 except: poly(ethyl methacrylate)-PEMA, non-crystallizable polystyrene, PS,
and poly(a-methyl styrene), Pa MS]
348
Some results have been obtained on poly(dl-propylene oxide),
[
-OCH2-~H-]CH3 n
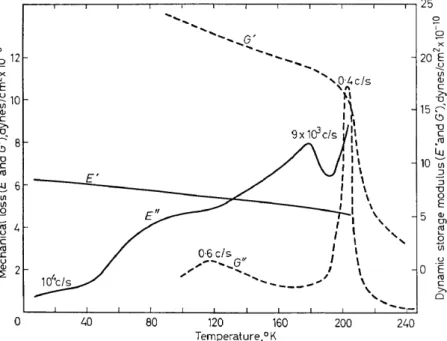
a polymer with the same side group as polypropylene, but a different chain repeat unit; the data for the two polymers do bear some similarities. Dyna- rnie loss and storage modulus results obtained in shear at 0·5 to 0·05 cjs using a torsion pendulum32 and in longitudinal vibration4 at .--104 cjs are given in Figure 7 for samples from the same polymer batch. In addition
CO
\;212
X N
E
~ 10
Cl.>
c >.
r
u 8<!:>
u c
~tU
~ 6
1/l
_g 1/l
-ro u 4
·c: tU
..c u Cl.> 2 2:
0
~--~--~--~--.---~--~--.---.---~--~---.---ro25
104c/s
40 80
...
...
... G' ...
...
...
...
,
'0·4c/s
'I\ .,.,
:\
9 x 1c? c/s 1
l' I\
120 160
Temperature,°K
I I\
I I \ I I \ I I \ I I \ I I \
I ' ,
'
I'
' ,'
\ \\ \
'
....---
200 240 5
0
Q) Ol ~ 0 U)
.E u nJ c
>.
0
Figure 7. Dynamic elastic storage and loss modulus ( E' and E") at ,..., 104 cjs and dynamic shear storage and loss modulus (G' and G") at ,...._, 0·5 cjs v. temperature for poly(dl-propylene
oxide). Taken from the data in references 4 and 32)
to the loss plateau at 6°-40°K, noted in Figure 4, the longitudinal vibra- tion data4 show a loss shoulder at .-- 100°K, a y loss maximum at 180°K (9 X 10⁵ cjs), and an upswing (aa) at .--200°K. The lower frequency shear measurements32, carried out over a shorter temperature range, show one loss maximum at 115°K (0·6 cjs) corresponding to the y process and another at 205°K (0·4 cjs), the aa process. Further measurements are given in Figure 8 where the NMR second moment 33 and the dielectric loss tangent34 at 104 cjs are compared with the mechanical loss tangent4 at .--104 cjs for samples taken from the same batch but having been put through different purification procedures. I t is seen that the dielectric results are in general agreement with the dynamic mechanical data, while the NMR shows two distinct processes, one attributed principally to methyl reorientation ( ~ 180°-1l0°K) and the other to motion associated with a change from
349
glassy to rubber-like properties. The latter mechanism is also believed tobe responsible
±~r
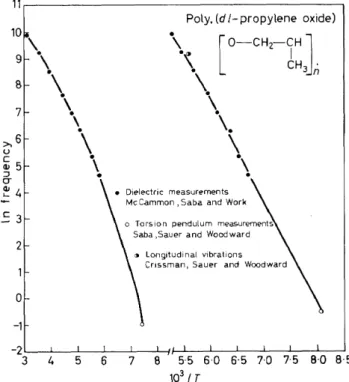
the hlghest temperature mechanlcaf foss process shown.The mechanical and dielectric data given in Figures 7 and 8 plus dielectric results at a number of other frequencies and at higher temperatures are represented on a log frequency v. reciprocal temperature plot in Figure 9.
"0 c CU NI/)
VI :lf")
~ $2 15
N,_:-?
~g
- VI
~.910
E ni
0 u
E
·c:
"0 CU
c .c
0 u 5
u (])
~ E
a: ~
z
0 80 120
T emperature, °K
8
C"l
$2
)(
'\
6c.o ~ c' \
4 ni ~ w .~ ü '-- 2160 200 240
Figure 8. Mechanicalloss tangent4 at ,..._, 104 cjs, dielectric loss tangent34 at 104 cjs, ancl NMR second moment 33 v. temperature for poly(dl-propylene oxide)
11.---~
10
8 7
>.6
u c (]) 5
::J o-
~ 4 c 3 2
0 -1
Poly, (d 1- propytene oxide)
\ .\ [ 0--CH2-CH I
J
• CH3
n
\ .\
\.
\ .\ .
• Die-lectric measureme-nts Mc Cammon , Saba and Work o To;-sion pendulum measurements
Saba ,Sauer and Woodward
<J Longitudinal vibrations
Crissman, Sauer and Woodward
-2~~~~~~--~--~~~~--~--~--~--~--~--~
3 4 5 6 7 8 5·5 6·0 6·5 7·0 7·5 8·0 8·5 103/ T
Figure 9. Log frequency v. reciprocal temperature for poly(dl-propylene oxide). Taken from the data in references 4, 32, 34
The curve on the left gives data for the aa process while the other represents the y process. I t is noted that the plots are somewhat curved precluding the calculation of a temperature independent "apparent activation energy".
The mechanical and dielectric loss shoulders at ~100°K (104 cjs) may, in part, be associated with methyl reorientation about the C3 axis. However, since the dipolar parts are located in the backhone chain, it is believed that some movement of atoms in the main chain also occurs. The y loss maximum is believed tobe analogaus tothat in polypropylene and polyethylene.
T1 measurements have recently been reported35 for the polymer with two minima at ,_,130-160°K and 270-300°K appearing for high molecular weight material. Sturlies of deuterated samples indicate that the lower temperature minimum is associated with methyl reorientation.
NMR and dynamic mechanical results for poly(4-methyl pentene-1).
a poly(a-olefin) containing isobutyl side chains, are given in Figure 10.
u 1·0
Cll Tl
Vl
...:-
0·1
1011
Temperature, °K
25 20 15
N 1/) Vl :::l n1 0\
N
10 :t:
5
1010 NE
-
u Vl Cll c 109 ~~
Figure 10. Dynamic elastic modulus (E") dynamic elastic storage modulus (E'), NMR second moment, !1H2 , and spin-lattice relaxation time, T1, for isotactic poly(4-methyl pentene-1).
Data taken from references 4, 9, 26, and 36
Three different P4MP1 specimens were used in these studies, the broad line NMR26 and the dynamic mechanical results from ~100° to 430°K using the transverse beam apparatus36 being obtained on specimens from the same rod. In the 100° to 200°K region overlap of the E" data from the two mechanical studies occurs.
At least four relaxation mechanisms areevident in the 4 o to 450°K region
from the data in Figure 10. The dynamic mechanical results and the data using both of the NMR methods indicate a relaxation mechanism at about 330-340°K ( ,..._,103-104 cjs) and 430°K (3·5 X 107 cjs) believed tobe associ- ated with the onset of considerable chain motion in the disordered parts.
The T1 minimum at 145°K and the NMR line narrowing process at ::::::;; 80°K, in analogy with results for polypropylene, are attributed to methyl group motion, whereas the mechanicalloss maximum at 150°K (103-104 cjs) is believed to be due to motion of other side chain segments, in addition to the methyl groups. Other poly(a-olefins), such as poly(3-methyl butene-1)36, poly(butene-1)37 and poly(pentene-1)36 with side-chains containing two or more carbon atoms show a loss maximum in this temperature-frequency region; however, as noted above, polypropylene, the polymer with only a methyl side chain, does not. The mechanism responsible for the maximum at 24°K (104 cjs) has not been identified to date.
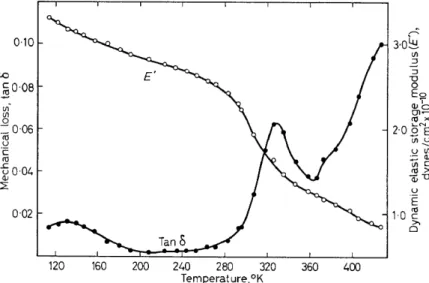
Dynamic mechanical measurements made by Dr ]. A. E. Kail (Imperial Chemical Industries, Ltd., Plastics Division) on a highly crystalline specimen of poly(4-methyl pentene-1) using a vibrating reed apparatus are given in Figure 11. The specimen was prepared by pressing strips of a mat at
0·10
(.Q
$0·08 tfl IJ1 0
=0·06
nJ u
·c:
CU
-5 aJ
0·04 20·02
120 160 200 240 280 320 360 400
Temperature, °K
3·0~
tfl ::J
u ::J 0 Eo
aJ'S
rn~
nJ ><
2·0 ONE Ul~ u tfl
~~ ro>.
ä)U
.E u
1·0 ~ >.
0
Figure 11. Mechanicalloss (tan o) and dynamic elastic Storage modulus, E', v. temperature for a poly( 4-methyl pentene-1) sample prepared from dilute solution crystallized material 60°C, the mat being obtained by fast filtration of material crystallized at 64°C from a dilute solution (0·07 wt per cent in xylene). The y and aa loss peaks are present as in melt-formed samples, the latter being considerably reduced, presumably due to the increase in crystalline order. An additional process or processes are evident at temperatures >370°K which may be associated with motion in or by the crystal lamellae. Two mechanical loss peaks have previously38 been reported in this temperature region (410°
and 450°K; ,..._, 100 cjs). T1 measurements9 on samples prepared from dilute solution crystallized material show two minima, as found for melt formed specimens (see Figure 10).
POLYSTYRENE AND POLY(a-METHYL STYRENE)
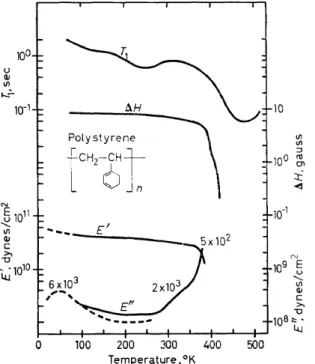
T19, Nl\1R line width40, and dynamic mechanical data, ohtained for polystyrene using hoth longitudinal vibrations31 (- -) and transverse vibrations39 ( - - ) , are plotted in Figure 12; four separate free radical poly- merized (non-crystallizable) polystyrene samples were used. In the ,_,90- 2600K region overlap in E' values occurs although the E" values differ. At
u Q) Vl
0
aH
Polystyrene
rH,-:~t On
...
..., E'6 x10
,_
3 2xl03,
'100 200 300 Temperature, °K
10
Vl Vl :J
100 !ll Ol
:t -<d
10-1
0J
109
5
...
111 Q)
c >.
108~· '0
400 500
Figure 12. Dynamic elastic modulus (E"), dynamic elastic storage modulus (E'), NMR line-width, t::.H, and spin-lattice relaxation time, T1, for free-radical polymerized poly-
styrene. Data taken from references 5, 9, 39 and 40
least two and possibly three relaxation processes are apparent in these data. The process found at the highest temperatures used in the three investigations is attrihuted to segmental diffusion arising as a consequence of the glass to ruhher transition reported at about 100°C. Whether the mechanical loss maximum at 45 °K is related to either the T1 minimum at 265°K on the plateau at ,_,130°K is not known. Higher frequency mechani- cal measurements would help to clarify this point. A partially isotactic poly- styrene sample in both the quenched and annealed conditions showed31 the 45 °K loss modulus peak, although the size of the peak is decreased to some extent. This does not appear tobe in agreement with recent studies of Baccaredda, Butta and Frosini41 who found that the low temperature loss maximum occurs at temperatures of
::>
ll0°K higher for isotactic than for non-crystallizable polystyrene. I t has been suggested29 that this loss peak is due to phenyl group oscillation or wagging. This is consistent with broad- line NMR results40 which indicate little motion at 77°K and below. As is seen in Figure 5, the polymers of various methyl substituted styrenes show a353
A. E. WOODWARD
loss maximum in the low temperature region ranging from values of 20°- 450K. It is not presently known if all of these maxima can be attributed to the same mechanism.
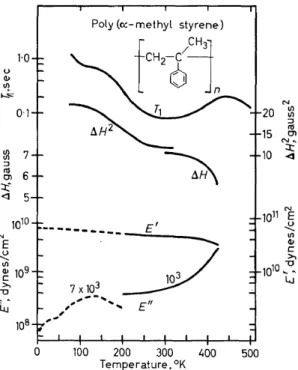
NMR second moment and line width results42, T1 data9 and mechanical loss and storage modulus data obtained with a transverse beam apparatus from 200°K43 in addition to the mechanical results obtained with the longi- tudinal bar apparatus31 (Figures 5 and 6) are shown in Figure 13 for poly- (a-methyl styrene). Two and possibly three relaxation processes areevident
1·0 u
(!)
1/l '-""'
0·1
m
7:J
CU 6
0\
=t: <] 5
1010
N
E u
'
~ 109c >,
"0
~.
Li.J 108
Poly (o:-methyl styrene)
---~-
E'103 /
7x10³
~
,,,
...
-,,, E",~
,
0 100 200 300 400 500
Temperature. °K
N
20 ~
:J
15 CU rn
N"
10 ~
Figure 13. Dynamic elastic loss modulus (E"), dynamic elastic storage modulus (E'), NMR second moment, ßl-!2, and spin-lattice relaxation time, T1, for poly(a-methyl styrene). Data
taken from references 9, 31, 42, 43
from these data. The downswings in T1, line width and E' and the upswing in E" at the highest temperatures employed are believed tobe manifestations of the glass to rubber transition. The T1 minimum at about 305°K and the drop in second moment centred at about 200°K have been attributed to methyl group motion based on second moment calculations42. The loss maximum at 135°K (7 X 10³ cjs) has been tentatively attributed31 to ph~nyl
group oscillations possibly coupled with methyl reorientations. The aceur- ring of the phenyl motion in poly( a-methyl styrene) at temperatures 80-90 degrees higher than for the same motion in polystyrene could be a conse- quence of steric hindrance caused by the methyl group. The origins of the plateau in T1 at 130°K are not presently known.
SOME POLY(ACRYLATES) AND RELATED POLYMERS NMR second moment results44 for free radical polymerized noncrystal- lizable samples of poly(ethyl acrylate), poly(butyl acrylate), poly(vinyl
354
proprionate) and poly(ethyl vinyl ether) are given in Figure 14. The three polymers, for which the hydrocarbon portion of the side chain is an ethyl group, show similar behaviour and it is concluded that the motions contri- buting to the various line narrowing effects for each polymer are similar.
N Vl Vl
20
~ 15
Ol
c QJ
~ 10 E
"U
8
(I) 5U)
100 140 180 220 260 300
Temperature, °K
Figure 14. 1'\MR second moment v. temperature for poly(ethyl acrylate) ( - -), poly(butyl acrylate) (--- -), poly(vinyl proprionate) ( - - -), and poly (ethyl vinyl ether) (--)44 The greater number of protons per repeat unit is believed to be responsible for the higher second moment values for poly(ethyl vinyl ether) as compared to those for poly(ethyl acrylate) and poly(vinyl proprionate). The narrowing process in the ~ 77°-l20°K region is believed tobe brought about by either methyl or ethyl reorientations since the experimental values in this tempera- ture regionfall approximately between the estimated rigid lattice and ethyl rotation values of "_,22-23 gauss2 and ,_,12 gauss2, respectively.
The relatively gradual decrease in second moment from ,._, 120°K to temperatures just below the final precipitous drop is either due to further side chain re-orientations, possibly involving all the protons of the ethyl group, or to small amounts of chain torsion. The final process for all three polymers occurs at temperatures above the glass transition and indicates the large amount of chain motion which becomes possible in the liquid or rubbery state.
The greater slope of the second moment-temperature plot in the 100- 2200K region for poly(butyl acrylate) as compared to that for the others polymers is attributed to the occurrence of propyl and butyl motions in addition to those possible for the ethyl unit. Poly(vinyl stearate) a highly crystalline polymer with a c17 hydrocarbon side-chain, shows a similar second moment decrease tothat for poly(butyl acrylate) as weil as a mechani- calloss peak, attributed to side chain reorientations44.
A torsion pendulum investigation32 of poly(ethyl vinyl ether), using a sample from the same preparation as that used for the NMR study, has shown that a mechanical loss peak exists at 100°K (0·9 cjs); this has been attributed to motions involving the side branch and including the cooperative action of 3-4 consecutive segments. Because of the higher correlation frequency, the associated change in the NMR plots would be expected in the region above 100°K and it is in this region where gradual decreases are found in the experimentalline width and second moment.
355
A. E. WOODWARD
POLY(METHACRYLATE ESTERS)
From the dynamic loss modulus data given in Figure 4 it is seen that poly (methyl methacrylate) shows a smallloss maximum at ,..._,4oK (104 c/8) attri- buted to ester methyl group motion. There is also a plateau in the loss for poly(isobutyl methacrylate) in the 6°-50°K range, the cause of which is not known4. Poly(ethyl methacrylate) on the other hand has a much larger E" peak at ,..._, 50°K, as is seen in Figure 15, presumably due to ester ethyl
(/1 X ( / I N
~ ~10
u -- U) ()') (J)
ro c Q; '"0 >.
u 5
.E
ro c
>.
0
E't
/
u E ro c >.
0 25 50 75 100
Temperature, °K
125 150
°
Figure 15. Dynamic elastic storage (E') and loss modulus (E") v. temperature for poly(ethyl methacrylate). Data taken from reference 4
movements. T1 minima have been reported at ,..._, 80°K for poly(methyl methacrylate )45 and 145 oK for poly( ethyl methacrylate )46 and have been attributed to motions similar to those suggested from the dynamic mech- anical results.
References
1 A. E. Woodward and J. A. Sauer. Physics and Chemistry qf the Organic Solid State Valurne II pp. 637-723, Editors: Fox, Labesand Weissburger), Interscience, New York (1965).
2.J. H. Van Vleck. Phys. Rev. 74, 1168 (1948).
3 E. R. Andrew. J. Chem. Phys. 18, 607 (1950);
E. R. Andrewand R. A. Newing. Proe. Phys. Soe. (London) 72B, 959 (1958);
H. S. Gutowsky, and G. E. Pake. J. Chem. Phys. 18, 162 (1950).
4 J. M. Crissman, .J. A. Sauer, and A. E. Woodward. J. Polymer Sei. A2, 5075 (1964).
5 J. M. Crissman and R. D. McCammon. J. Acoust. Soe. Am. 34, 1703 (1962).
6 D. E. Kline. J. Polymer Sei. 22, 449 (1956).
7 L. J. Merrill, J. A. Sauer, and A. E. Woodward. Polymer 1, 351 (1960).
8 A. Odaima, .J. A. Sauer, and A. E. Woodward. J. Phys. Chem. 66, 718 (1962).
9 B. I. Hunt, J. G. Powles, and A. E. Woodward. Po(ymer 5, 323 (1964).
10 P. Mansfield and J. G. Powles. J. Sei. Instrum. 40, 232 (1963).
11M. Takayanagi. Kautschuk and Gummi Kunststoffe 17, 164 (1964).
12 W. Peckhold, U. Eisile, and G. Knauss. Kolloid Z. 196, 27 (1964).
13 H. Thurn. Kolloid Z. 173, 72 (1960).
14 D. H. Reneker. J. Polymer Sei. 59, 539 (1962).
15 K. D. Lawson, J. A. Sauer, and A. E. Woodward. J. Appl. Phys. 34, 2492 (1963).
16 K. H. Illers and H. Breuer. J. Colloid Sei. 18, 1 (1963).
17 S. P. Kabin. Zh. Tekh. Fiz. 26, 2628 (1956).
1 8 K. H. Illers, and E. JenekeL Kolloid Z. 160, 97 (1958).
19 N. G. McCrum. J. Polymer Sei. 54, 561 (1961).
356
RELAXATION PHENOMENA AND POLYMER STRUCTURE 20M. Takayanagi. !vfem. Fac. Eng. Kyushu Univ. 23,41 (1963).
21 R. S. Moore and S. Matsuoka. J. Polymer Sei. C5, 163 (1964).
22 R. C. Rempel, H. E. Weaver, R. H. Sands, and R. L. Miller. J. Appl. Phys. 28, 1082 (1957).
n S. Hoshino, J. Powers, D. G. LeGrand, H. Kawai, and R. S. Stein. J. Polymer Sei. 58, 185 (1962).
2cl (a) H. Nakayasu, H. Markovitz, and D. ]. Plazek. Trans. Soe. Rheol. 5, 261 (1961).
24 (b) S. Iwayanagi and H. Nakane. Rep. Prog. Polymer Phys. Japan. 1, 179 (1964).
25 .J. A. Sauer, R. A. Wall, N. Fuschillo, and A. E. Woodward. J. Appl. Phys. 29, 1385 (1958).
26 A. E. \Voodward, A. Odajima, and J. A. Sauer. J. Phys. Chem. 65, 1384 (1961).
2 7 J. G. Powles and P. Mansfield. Polymer 3, 340 (1962).
28 S. Minami and M. Takayanagi. Rep. Prog. Polymer Phys, Japan 1, 241 (1964).
2 9 K. M. Sinnott. S.P.E. Trans. 2, 65 (1962).
:Jo J. M. Crissman. PhD. Dissertation, Pennsylvania State University (1963).
:n J. M. Crissman, A. E. Woodward, and J. A. Sauer. J. Polymer Sei. A3, 2693 (1965).
3 2 R. G. Saba,]. A. Sauer, and A. E. vVoodward. J. Polymer Sei. Al, 1483 (1963).
3:3 L. J. Merrill. PhD Dissertation, The Pennsylvania State University (1964).
34 R. D. McCammon, R. N. Work, and R. G. Saba. Bull. Am. Phys. Soc. Ser. II, 9, 221 (1964).
:35 T. M. Connor, D. J. Blears, and G. Allen. Trans. Faraday Soe. 61, 1097 (1965).
36 A. E. Woodward, J. A. Sauer, and R. A. Wall. J. Polymer Sei. 50, 117 (1961).
37 A. E. Woodward, J. A. Sauer, and R. A. Wall. J. Chem. Phys. 30, 854 (1959).
38 J. H. Griffith and B. ]. Ränby. J. Polymer Sei. 44, 369 (1960).
39 R. A. Wall, J. A. Sauer, and A. E. \'Voodward. J. Polymer Sei. 35, 281 (1959).
40 A. Odajima,J. A. Sauer, and A. E. Woodward. J. Polymer Sei. 51,107 (1962).
41 M. Baccaredda, E. Butta, and V. Frosini. Polymer Letters 3, 189 (1965).
4 2 A. Odajima, A. E. Woodward, andj. A. Sauer. J. Polymer Sei. 55, 181 (1961).
4 3 J. A. Sauer, and D. E. Kline. IXth International Congr. Appl. Mechs. 5, 368 (1957).
c~.t L. ]. Merrill, J. A. Sauer, and A. E. Woodward. J. Polymer Sei. A3, 4243 (1965).
4 5 J. G. Pmvles and B. I. Hunt. Physics Letters. 14, 202 (1965).
46 ]. G. Powles, B. I. Hunt, and D. J. H. Sandiford. Polymer 5, 505 (1964).