Report
Lockdown and Voting Behaviour: A Natural Experiment on Postponed Elections during the COVID-19 Pandemic
Author(s):
Giommoni, Tommaso; Loumeau, Gabriel Publication Date:
2020-08-03 Permanent Link:
https://doi.org/10.3929/ethz-b-000466704
Rights / License:
In Copyright - Non-Commercial Use Permitted
This page was generated automatically upon download from the ETH Zurich Research Collection. For more information please consult the Terms of use.
Lockdown and voting behaviour:
A natural experiment on
postponed elections during the COVID-19 pandemic
Tommaso Giommoni
1and Gabriel Loumeau
2Date submitted: 24 July 2020; Date accepted: 29 July 2020
The goal of this paper is to study the impact of the lockdown policy on voting behaviour, during the COVID-19 pandemic. We focus on France, where a differential lockdown was implemented across departments, based on the local diffusion of the disease. In particular, the country has been divided in two areas, red and green, subject to a “hard” and a “soft”
lockdown, respectively. To measure voting behaviour, before and after the policy, we rely on 2020 French municipal elections: the first round took place before the introduction of the restrictions, while the second round was delayed after the end of the lockdown. We estimate a Spatial Regression-Discontinuity-Design model comparing the difference in outcomes between the two electoral rounds, at the border of red and green areas. The main results suggest that lockdown regulations significantly affected electoral outcomes. First, in localities under a harder lockdown, the incumbent's vote share is higher as well as the consensus for Green parties. Second, voter turnout is larger where more stringent restrictions are adopted. These results suggest that lockdown measures strongly lead citizens to rally around the local incumbent politicians.
1 Postdoctoral researcher, ETH Zurich.
2 Postdoctoral researcher, ETH Zurich.
Covid Economics 41, 3 August 2020: 69-99
1 Introduction
The COVID-19 pandemic represents an unprecedented global crisis and poses massive chal- lenges to contemporary democracies. Governments are faced with a global health problem that threatens the life of millions of people in the world and seriously undermines economic devel- opment. A common reaction to the insurgence of the pandemic has been the implementation of a set of social containment measures, known as the “lockdown”, with the goal of limiting the spread of the disease.1 On the one hand, these measures represent an effective tool to contain the diffusion of the virus, on the other hand, they limit individual liberty and constrain economic activity (Fetzer et al.,2020).
There is already evidence that these unparalleled restrictions affect individuals political preferences, as they raise the support for the incumbent (Bol et al.,2020;De Vries et al.,2020), as well as social trust and confidence towards the institutions (Amat et al.,2020;Esaiasson et al., 2020). Nevertheless, due to the impossibility of hosting electoral events during the pandemic, very little is still known on how lockdown measures impact voting behaviour. Studying the relation between lockdown restrictions and electoral outcomes is of vital importance in order to understand who will be in charge of managing the post-pandemic period and, consequently, which policies will be implemented.
To fill this gap in the literature, this paper studies the short-term effects of lockdown measures on voting behaviour and electoral outcomes. We rely on a natural experiment taking place in France during the COVID-19 outbreak. Similarly to the other European countries, France was severely affected by the pandemic with 173,304 confirmed COVID-19 cases and 30,120 total casualties, on July 15th 2020. The French government introduced the lockdown before the surge of the pandemic, on March 17th. This consisted of a series of restrictions which include the closure of most public establishments, such as schools and universities, and the ban of non necessary movements. After the pandemic reached the contagion peak in April, the government decided to start loosening the restrictions butthe relaxation was not uniform across French departments. In particular, the French territory was divided into two areas, a green one and a red one, depending on the local severity of the pandemic. Assignment to either areas was based on an arbitrary threshold defined by four local health criteria.2 Departments in the green zone experienced a faster relaxation – “soft” lockdown – than those in the red
1Lockdown measures have been implemented by many European countries: Italy (March 9), Spain (March 15), Austria (March 17), France (March 17), Denmark (March 18), Germany (March 22), Greece (March 23), the Netherlands (March 24), and the United Kingdom (March 24). Moreover, the recent resurgence of the disease in specific areas, e.g., Atlanta, Barcelona, two German Kreis, has forced governments to reintroduce lockdown measures.
2The four criteria are: (i) number of cases per 100,000 inhabitants, (ii) rate of positive virologic tests, (iii) reproduction number, R0, (iv) hospital bed occupancy rate.
Covid Economics 41, 3 August 2020: 69-99
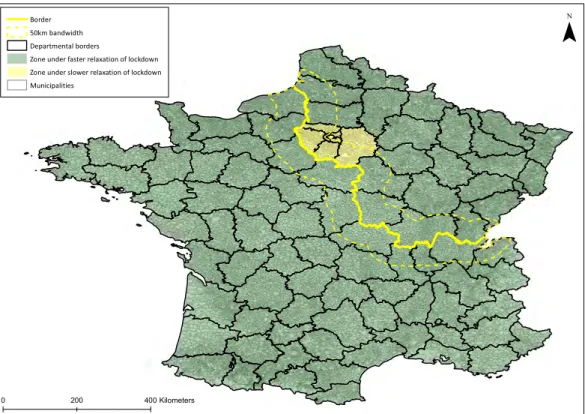
one – “hard” lockdown. In the green zone, movements within 100 Km were allowed again and the economic activity restarted, while in the red zone, the standard restrictions remained in force. This division remained effective from May 11th to June 2nd. Figure1shows the map of France with the border between the red area, North-Eastern France, and the green area. By focusing on municipalities around the lockdown border, we are able to analyze the impact of restriction measures on electoral outcomes in areas with a similar local health situation. We do not observe, indeed, significant differences in the number of cases or deaths by COVID-19 in those departments –in the two zones– that are closely located to the border.3
Figure 1: Differential lockdown from May 11th to June 2nd, 2020
Border 50km bandwidth Departmental borders
Zone under faster relaxation of lockdown Zone under slower relaxation of lockdown Municipalities
¯
0 200 400Kilometers
Notes: The yellow bold line represents the border between the red and the green area, subject to different lockdown policies. Black borders represent departments and grey ones indicate municipalities. Dotted yellow lines represent the 50 Km bandwidths from the border.
3More precisely, we formally test for this assumption by looking at the data on the number of cases and deaths by COVID-19 during the periods preceding the first and second round of elections at the departmental level. We do not observe large differences in the severity of the health crisis between the two zones for the departments close to the border. Given that the disease spreads locally in a smooth manner, the absence of observed differences at the departmental level likely indicates that municipalities at the border indeed experience similar health situations. Therefore, in the sample of municipalities under consideration, the treatment mostly captures the difference in lockdown and we can interpret the main results as, primarily, due to the different containment measures. For more details, see Section2.
Covid Economics 41, 3 August 2020: 69-99
To measure voting behaviour of French citizens before and after the lockdown, we rely on the 2020 French municipal elections, whose implementation was interrupted by the pandemic.4 The first round of the polls took place on March 15th, while the introduction of the lockdown two days after the elections, on March 17th, impeded the conduct of the second round, that was delayed until the conclusion of the restrictions, on June 28th. This unique setting allows us to evaluate the voting behaviour of French voters just before –first round– and just after –second round– the introduction of the lockdown. Furthermore, we naturally control for fixed local characteristics and, given the short time span between the two rounds and the limit on mobility, we deem implausible the presence of endogenous spatial sorting as a response to the lockdown.
Overall, this institutional setting gives rise to two sources of variation we can exploit in order to estimate the causal effect of lockdown restrictions on electoral outcomes. On the one hand, the spatial variation between the red and the green zone allows us to study the effect of the severity of lockdown measures in areas with a similar local health situation; on the other hand, the time variation between the first and the second round can be used to assess the impact of the introduction of these restrictions, accounting for fixed local characteristics. Our identification strategy is structured as a spatial Regression-Discontinuity-Design (RDD), where the distance to the border represents our forcing variable and the dependent variable is the difference in outcomes between the two electoral rounds. Therefore, our strategy is based on the comparison between cities located across the border, and then subject to different rules, before and after the implementation of the lockdown.
The main results suggest that the severity of the lockdown significantly affects electoral outcomes and voting behaviour. First, we find that localities subject to “hard” restrictions have significantly different voting patterns compared to those under “soft” measures. Cities in the red zone, indeed, support more the local incumbent, whose vote share is between 2 and 4.5 percentage points higher. The higher visibility of the mayors in the red zone and the multiple contacts with the citizens may have contributed to increase their local popularity and electoral success. This result is also in line with the “rally around the flag hypothesis” (Baum, 2002;
Mueller,1970), claiming that the trust in leaders tends to raise in the wake of disasters: voters in the areas with longer restrictions may either feel safer or be more aware of the health crisis, and therefore grateful for the policy.5 Moreover, we find that “hard” lockdown measures lead
4The first round of the municipal elections took place after a vivid debate. On the days before the first round, several parliament members publicly asked to postpone the first round due to contagion risks. However, on March 12th (i.e., three days before the elections), President Macron consulted the presidents of the main French political parties who all agreed to maintain the first round on March 15th as initially planned. The Union of French Mayorsalso publicly advocated in favor of maintaining the initial calendar.
5Chanley(2002) shows an important example of the “rally around the flag hypothesis” documenting that in the days following the 11 September 2001 attacks, trust in the U.S. government rose to levels not seen since the
Covid Economics 41, 3 August 2020: 69-99
to stronger support to Green parties, suggesting that a higher awareness of the health crisis persuade voters to be more concerned about environmental issues, potentially connected with the pandemic (Grant and Tilley, 2019). Second, we find that the enforcement of the “hard”
lockdown raises political participation, measured with voter turnout. Being subject to a longer lockdown seems to mobilize voters, motivated to choose the right leader, rather than discourage them to participate, in fear of the disease.6
This paper relates to several strands of literature. First, we contribute to the recent liter- ature on the political effect of lockdown measures during the COVID-19 pandemic. Bol et al.
(2020) rely on an online survey covering 15 Western European countries and show that the lockdown led to higher consensus -vote intention- for the national incumbent, trust in the gov- ernment and satisfaction with democracy. De Vries et al.(2020) find similar conclusions looking at the introduction of restrictions abroad. Moreover,Sibley et al.(2020) use experimental data to show that restrictive measures increased trust in science, politicians and police as well as patriotism in New Zeland.
More generally, our paper is related to the fast growing literature on the effect of the COVID-19 pandemic on political outcomes. Merkley et al. (2020) show that the pandemic led to an increase in consensus for the government in Canada (see alsoHarell (2020)). Leininger and Schaub(2020) study the local elections of the German state of Bavaria at the beginning of the pandemic –before the introduction of the lockdown– and find that the incidence of the disease advantaged the incumbent party. Moreover,Adam-Troian et al.(2020) study the first round of 2020 French municipal elections and find that areas more afflicted by the pandemic showed higher support for conservative parties. At last, there is evidence that the health crisis positively affected social trust and confidence toward institutions (Esaiasson et al., 2020) as well as the support for authoritarian and technocratic government (Amat et al.,2020).
Finally, we relate to the contributions studying the impact of natural disasters and catas- trophic events on political outcomes. A set of studies analyzes the effect of recent epidemics on political preferences and electoral results: there is evidence on the Ebola outbreak (Beall et al., 2016;Campante et al.,2020;Maffioli,2018) and on the HIV/AIDS epidemic (Mansour et al., 2020). Furthermore, many papers focus on the impact of natural disasters such as earthquakes and hurricanes. This literature suggests that the policy response is vital in determining the impact on incumbent’s support: if the reaction is considered to be inadequate, voters tend to punish the leaders (Akarca and Tansel,2016;Eriksson,2016), while a positive response leads to an increase in their consensus (Bechtel and Hainmueller,2011;Healy and Malhotra,2009).
1960s.
6In these regards,Zeitoun et al.(2020) show that there is no association between the level of participation to the (first round of) 2020 municipal elections in France and the subsequent spread of the disease at the local level.
Covid Economics 41, 3 August 2020: 69-99
To the best of our knowledge, we are the first to study the causal impact of the COVID-19 lockdown on electoral outcomes, making use of electoral –post lockdown– data rather than survey or experimental evidence. Moreover, we advance the literature as, thanks to this unique setting, we study within-country differences in lockdown measures and we are able to assess the impact of the severity of these restrictions on electoral outcomes. Finally, we are among the first to focus on local incumbents, rather than on national politicians.
The remainder of the paper is structured as follows. Section 2 describes the institutional setting and the data. Section 3 presents the empirical strategy. Section 4 discusses the main results and the robustness checks and Section 5 concludes.
2 Institutional background and data
2.1 COVID-19 pandemic in France and lock-down measures
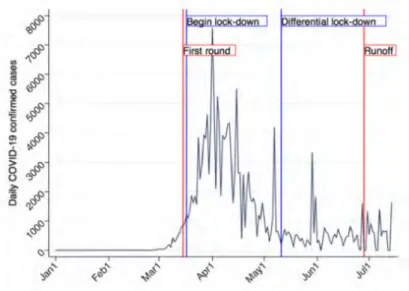
In France, the daily number of confirmed COVID-19 cases started to increase significantly in the first days of March. Figure2display the evolution of the COVID-19 in France from January 1st to July 15th, 2020. Following this increase, the French government announced, on March 16th (i.e., one day after the first round of the municipal elections), a strict lock-down starting on March 17th at 12am. Individuals were only allowed outside of their homes for specific reasons, (e.g., grocery shopping), most of public establishments have been closed as well as schools and institutes of higher education and most of religious gatherings have been forbidden. Police forces controlled the respect of the lock-down, and non-compliance was fined.7
Thanks to the lockdown measures, the pandemic peak was reach in early April. However, whereas the situation was mostly under control in the South-West half of France, the number of cases was still high in the North-Eastern half of the country. Figure1displays the two zones.
Consequently, the government decided to relax the lockdown deferentially as of May 11th. The zones were defined using four indicators at the department level (NUTS3 region): (i) number of cases per 100,000 inhabitants, (ii) rate of positive virologic tests, (iii) reproduction number, R0, (iv) hospital bed occupancy rate. The blue vertical lines, in Figure2, show the evolution of the lockdown policy over time.
In the green zone, movements were allowed within 100km of one’s residential location and the economic activity started again. In the red zone, on the contrary, all the restrictions remained in force and,except for Paris, the lock-down was relaxed only on June 2nd. In Paris’
region, the lockdown was lifted on June 22nd: between June 2nd and June 22nd, the lock-down in this region only slightly loosened relative to before, and the region was attributed a yellow
7In the standard case, amount of the fine wase135.
Covid Economics 41, 3 August 2020: 69-99
Figure 2: Evolution of Covid-19 confirmed cases in France
Notes: The plot shows the total number of confirmed COVID-19 cases in France starting from January 1st 2020. The red lines indicate the dates of 2020 local elections (first round -March 15th-, runoff -June 28th-), the blue lines indicate the dates of the modification in the lockdown policy (introduction of the lockdown -March 17th-, first relaxation of the lockdown -May 11th-).
The source is the French Government data portal (https://www.data.gouv.
fr/fr/).
color by the Health Ministry (Figure5, AppendixA).
2.2 Municipal election
French municipal elections allow local constituents to elect the city council, with the mayor chairing the council. Elections take place every six years. The voting procedure differs by municipality size. On the one hand, in municipalities with less than 1,000 inhabitants, a two rounds block vote with panachage (or majority-at-large voting) takes place. All candidates that received more than 50% of the votes are elected to the council. Those that did not reach this threshold compete in a second round for the remaining seats. On the other hand, in municipalities with more than 1,000 inhabitants, a proportional representation with a premium for the majority takes place. Voters choose between different lists and can neither add nor remove candidates from the lists. If a list obtains the absolute majority from the first round, no second round takes place. Otherwise, lists that have obtained at least 10% of the vote remain for a second round. The first half of the seats is attributed to the lists with the most
Covid Economics 41, 3 August 2020: 69-99
vote, whereas the remaining one is attributed proportionally to all lists that received at least 5% of the votes. Due to the highly personalized nature of the elections in municipalities with less than 1,000 inhabitants (which leads to many candidates being elected in the first round) and to the substantial differences in the two electoral systems, we focus in this paper only on municipalities with 1,000 inhabitants or more.
Based on the decision by the Ministry of the Interieur on July 16th, 2019, the 2020 French municipal elections had been scheduled on March 15th for the first round, and on March 22nd for the runoff. Regardless of the development of the pandemic in France, the first round was maintained and took place as planned on March 15th, one day before the lockdown started.
However, given the COVID-19 outbreak, the second round was postponed after the lockdown on June 28th. All candidates elected during the first round took office immediately, whereas incumbents remained in power when runoffs were required. Overall, a runoff took place in 14%
of all polling stations, and in 20% of all polling stations located in municipalities with 1,000 or more inhabitants. The red vertical lines, in Figure2, show the timeline of the 2020 municipal elections.
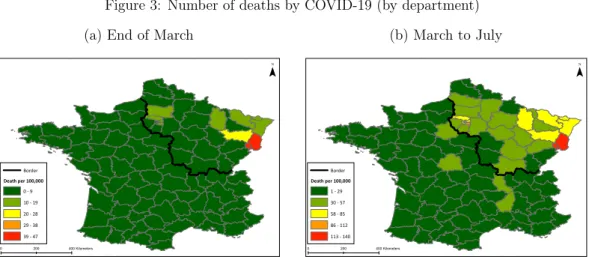
At the time of the first round, the COVID-19 situation was very similar across the future differential lockdown border, as revealed in Panel a of Figure3. Except clusters in the north of Paris and in Alsace, the number of deaths was relatively small (i.e., between 1 and 9 deaths per 100,000 inhabitants).8 Hence, even if voters could possibly expect the pandemic to de- velop across the country, they could not reasonably anticipate that France would be divided in differential lockdown zones; and even less so, forecast the location of the boundary.
Panel b of Figure3displays, then, the number of deaths per 100,000 inhabitants by COVID- 19 during the full period between mid-March and mid-July. As one would expect, given that lockdown zones were defined based on the local evolution of the pandemic, the North-Eastern half of France is significantly more impacted by the virus. However, although the departments on the north side of the lockdown border are indeed more impacted, the difference in the number of deaths per 100,000 inhabitants remains relatively small if we consider departments located around the border. This observation is worth noting to interpret our results, as it implies that the health situation did not differ largely around the border, at the time of the second round.
Hence, pure COVID-19 rational, aside from the lockdown, could not reasonably explain large differences in voting outcomes around the border and we can interpret the main results of this analysis as, mostly, due to the different lockdown policies.
8Looking at the departmental hospitalization rate per 100,000 inhabitants, instead of the death rate, we obtain a qualitatively similar picture.
Covid Economics 41, 3 August 2020: 69-99
Figure 3: Number of deaths by COVID-19 (by department) (a) End of March
Border Death per 100,000
0 - 9 10 - 19 20 - 28 29 - 38 39 - 47
¯
0 200 400Kilometers
(b) March to July
Border Death per 100,000
1 - 29 30 - 57 58 - 85 86 - 112 113 - 140
¯
0 200 400Kilometers
Notes: Death count is reported per 100,000 inhabitants. “End of March” corresponds to the period from March 19th until March 31st, whereas “March to July”jee refers to the period from March 19th until July 14th, 2020.
Source:French Ministry of Health.
2.3 Data
The sample in analysis consists in all municipalities that host a runoff in 2020 French munici- pal elections, with 1,000 or more inhabitants. The data used in this paper comes from mostly three sources. All elections data is provided by the French centralized public data platform (https://www.data.gouv.fr/fr/). Election data is recorded at the polling station level. In- formation about the differential lockdown and health outcomes is obtained from the open data platform of the Health Ministry (https://www.santepubliquefrance.fr/). Finally, all eco- nomic and demographic municipal information is provided by the National Institute of Statistics and Economic Studies (https://www.insee.fr/en/accueil). Based on this data, we use the geographic information software ArcGIS to derive all spatial information.
Table6, in the AppendixA, shows the descriptive statistics. Panel A shows the electoral outcomes expressed in difference between the two electoral rounds: the average difference in incumbent’s vote share is 6.7%, while the one in turnout is -2.8%. Moreover, the average difference in margin of victory and number of white votes is 6.4% and 2.4%, respectively.
3 Empirical approach
In this section, we detail the identification strategy used to identify the causal effect of the lockdown measures on voting outcomes.
Covid Economics 41, 3 August 2020: 69-99
3.1 Estimation strategy
Consider p ∈ P polling stations within i ∈ I municipalities. All polling stations within a municipality are assigned the same location relative to the border.9 Location of polling stations within a municipality are defined by the infinite set of municipal border points, L. Further, considerBas the infinite set of border points constituting the border between the differential lockdown zones. Let us then define the subsetsL∈LandB∈Bof border pointslpi= (lxpi, lypi) andbi= (bx, by), such that the euclidean distance to the lockdown borderdpi=||lpi−bi|| is minimized. Hence, this distance will be equal to 0 for polling station in a municipality at the border. Finally, define two zonesA+andA−as the treatment and the control areas.
Location relative to the border acts as the forcing variable. Assignment into treatment is then a function of a municipality’s location relative to the border. Formally, treatment status Tpiof polling stationpin municipalityiis defined asTpi=1
Lpi∈ A+
. To account for all fixed characteristics of polling station, and by extension of municipalities, we study the difference in outcomes between the two electoral rounds, which we denote with∆Y. We then focus on the discontinuity of the expected outcomes at the geographical border:
τ(d)≡E[∆Y1−∆Y0|dp= 0] = lim
d→0[∆Y|lp∈ A+]−lim
d→0[∆Y|lp∈ A−]. (1) Parametric specification — We approach the spatial RD design in both a parametric and non-parametric way. In the parametric approach, we define the conditional expectations in (1) asE[∆Y0|d] =α+f(d)andE[∆Y1|d] =α+τ+f(d), wheref(d)refers to flexible polynomials of shortest distance to the border. Allowing for asymmetric control distance functions insures that a kink is not misinterpreted as a discontinuityLee and Lemieux (2010). The regression model is then:
∆Y =α+Tτ+f(d) + (2)
The credibility of the model rests on the valid specification of the control functions. There- fore, we run various specifications with different order of polynomials and with different band- width sizes.
Non-parametric specification — For the non-parametric specification, we estimate local- polynomial regression-discontinuities with robust confidence intervals and optimal bandwidth selection followingCalonico et al.(2014). The performance of standard local polynomial esti- mators may be seriously limited by their sensitivity to the specific bandwidth employed. Hence,
9Given the average size of French municipalities, i.e., approx. 5km2, this assumption is expected to have a little impact, if at all, on the spatial distribution of polling stations relative to the border.
Covid Economics 41, 3 August 2020: 69-99
we employ mean squared error optimal bandwidths, which are valid given the robust approach inCalonico et al.(2014).
3.2 Validity of the approach
Causal identification in Regression Discontinuity designs rest on two key assumptions: (i) no selective sorting takes place, (ii) all underlying variables – besides treatment – vary smoothly at the border. The spatial RD design is a special case as assignment to treatment is very difficult to manipulate for municipalities as regional borders are very stable over time. Plus, the suddenty and unpredictableness of the spread of the COVID19 made it very unlikely for individuals and municipalities to anticipate and strategically react to the pandemic.
We approach the second assumption in two ways. First, in this paper, our main outcomes of interest are variable differences between the first and the second round of 2020 French municipal elections across the lockdown border. Hence, all fixed municipal characteristics are differenced out by design. Over extensive exploratory balance tests, this approach offers the key advantage that all fixed characteristics are accounted for as opposed to allobserved fixed characteristics.
Second, smoothness tests are nonetheless required to insure the smooth variation of the underlying voting variables. Two key concerns arise. First, are runoff more likely to occur in either treatment or control zones? Second, are incumbent more likely to be present in the first and second rounds on either side of the border? A positive answer to any of these questions would endanger our estimation strategy. To answer these questions, we run smoothness tests around the border using 1km and 2km bins symmetrically on both side of the border. Results are displayed in Table 1. Overall, we observe no significant difference around the border in the density of runoffs, in the density of incumbent running for reelection, and in the density of incumbent present in the runoff. As always absence of evidence is not evidence of absence;
however, these results are in line with the assumption of smooth underlying variables.
Table 1: Smoothness tests
Runoff Incumbent runs Incumbent in runoff
Bin size 1km 2km 1km 2km 1km 2km
RD Estimate 6.598 12.313 12.157 13.983 12.462∗ 15.740 (11.452) (24.156) (7.904) (14.461) (7.407) (14.269)
Obs. 88 49 70 47 71 47
Notes: The unit of analysis are bands of 1km or 2km width within 50km of the border on either side.
Covid Economics 41, 3 August 2020: 69-99
4 Results
4.1 Spatial regression discontinuity design analysis
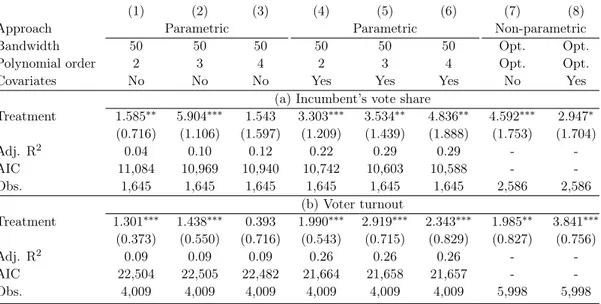
We start by presenting the results of the spatial RD analysis of incumbent’s vote share and turnout.10 Following the identification strategy presented in Section3.1, we compare the dif- ference in outcomes between the two rounds of the election on both sides of the lockdown border.
Table 2, Panel a, presents the results for incumbent’s vote share. The sample focuses on those municipalities where the incumbent runs in the first and in the second round. However, as tested in Section3.2, no differences in the likelihood of the incumbent being present in either the first or second rounds of the election are observed around the lockdown border. Three main specifications are displayed. Columns (1-3) focus on the parametric estimation of the lockdown effectwithout controlling for covariates and using different polynomial orders. Columns (4-6) adopt a similar strategy but include economic, demographic and geographic municipal covari- ates.11 It also includes a dummy equal to unity for Paris region, i.e., the “yellow zone” (Figure 5, in Appendix A). The AIC is used to compared the different parametric specifications. Fi- nally, columns (7-8) present the results of a non-parametric approach à laCalonico et al.(2014) without and with municipal covariates, respectively. Overall, incumbent’s vote share appears between 2 and 4.5 percentage points higher in the zone with the longer lockdown. Controlling for municipal covariates appears to increase the magnitude of the effect. To assess the robust- ness of the parametric results to the choice of the bandwidth, Table7(AppendixA), Panel a, reports results under the parametric specification using a wider range of bandwidth sizes. The bandwidth choice appears to have minor impacts on both the estimated coefficients and the significance levels derived. These results may derive from the higher visibility that the mayors in the red zone received as well as the multiple contacts with the citizens during the health crisis. Moreover, these findings argue in favor of the “rally around the flag hypothesis” (Baum, 2002; Mueller, 1970), as trusts in the local incumbent appears to increase in the wake of the pandemic. In this setting voters subject to longer restrictions could either feel safer or be more aware of the health crisis, and therefore grateful to the administration for the policy.
Table 2, Panel b, focuses on the voter turnout. Overall, both the parametric and non- parametric approaches point at a positive effect of lockdown on voter turnout. An estimated causal effect between 1.5 and 3 percentage points is observed. Controlling for covariates does
10We also studied the local margin of victory and the share of white votes. The lockdown appears to have had no significant effects on these outcomes. The analysis of these outcomes is available upon request.
11In particular, the following covariates are included: number of old people (those in the age groups 60-74, 75- 89, more than 90), number of female individuals, population growth rate between 2011 and 2016 (in percentage) and median income in 2017. We also include department fixed effects.
Covid Economics 41, 3 August 2020: 69-99
Table 2: Spatial RD design analysis of turnout
(1) (2) (3) (4) (5) (6) (7) (8)
Approach Parametric Parametric Non-parametric
Bandwidth 50 50 50 50 50 50 Opt. Opt.
Polynomial order 2 3 4 2 3 4 Opt. Opt.
Covariates No No No Yes Yes Yes No Yes
(a) Incumbent’s vote share
Treatment 1.585∗∗ 5.904∗∗∗ 1.543 3.303∗∗∗ 3.534∗∗ 4.836∗∗ 4.592∗∗∗ 2.947∗ (0.716) (1.106) (1.597) (1.209) (1.439) (1.888) (1.753) (1.704)
Adj. R2 0.04 0.10 0.12 0.22 0.29 0.29 - -
AIC 11,084 10,969 10,940 10,742 10,603 10,588 - -
Obs. 1,645 1,645 1,645 1,645 1,645 1,645 2,586 2,586
(b) Voter turnout
Treatment 1.301∗∗∗ 1.438∗∗∗ 0.393 1.990∗∗∗ 2.919∗∗∗ 2.343∗∗∗ 1.985∗∗ 3.841∗∗∗
(0.373) (0.550) (0.716) (0.543) (0.715) (0.829) (0.827) (0.756)
Adj. R2 0.09 0.09 0.09 0.26 0.26 0.26 - -
AIC 22,504 22,505 22,482 21,664 21,658 21,657 - -
Obs. 4,009 4,009 4,009 4,009 4,009 4,009 5,998 5,998
Notes: Unit of analysis is the polling station. Table7(Appendix) reports results under the parametric specification using a wider range of bandwidth sizes.
not appear to have any systematic impact on the estimated coefficients. As for incumbent’s vote share, we assess the robustness of the parametric results to the choice of the bandwidth in Table7(AppendixA), Panel b, by using a wider range of bandwidth sizes. The bandwidth choice appears to have minor impacts on both the estimated coefficients and the significance levels derived. This results further confirm the “rally around the flag hypothesis” in this setting, suggesting that the longer lockdown seems to mobilize voters, motivated to choose the right leader, rather than discourage them to participate, in fear of the disease.
Figure 4 present non-parametric discontinuity plots of incumbent’s vote share (Panel a) and voter turnout (Panel b). A third order polynomial specification using a symmetric 50km bandwidth is used. Bin size are selected using the IMSE-optimal evenly-spaced method with spacing estimators. Confirming the results in Table2, a positive jump at the lockdown border is observed in both outcomes.
Covid Economics 41, 3 August 2020: 69-99
Figure 4: Non-parametric discontinuity plots (a) Incumbent’s vote share
051015
-50 0 50
Distance to the border (km)
(b) Voter turnout
-4-202
-50 0 50
Distance to the border (km)
Notes: Third order polynomial with 50km bandwidth used. Bin size selected using the IMSE-optimal evenly- spaced method with spacing estimators.
4.2 Evolution in vote share by political groups
In our analysis, we have set party considerations aside so far. We now investigate whether the lockdown has affected parties’ performance heterogeneously. As our estimation strategy relies on polling stations close to the lockdown border, we can only rigorously analyze parties with a good spatial coverage in both the first and second round. Extreme left and extreme right parties in France are highly concentrated in specific locations. The communist party is, for example, present in former blue collar municipalities at the periphery of the Paris metropolitan areas. Similarly, the “Rassemblement National”, i.e., the main extreme right nationalist party, is mostly present in the North and South East of the country. President Macron’s party “La République en Marche” (center right) is also characterized by a weak spatial coverage in the 2020 municipal elections for mostly two reasons. First, the party is very new as it was created for the 2017 presidential elections. Second, it performed badly at the 2020 municipal elections and in many cases was not present in the second round.
For these reasons, we focus on three political groups: (i) left-wing parties; (ii) Greens and affiliated parties, (iii) right-wing parties.12 All three groups have proposed candidates in most municipalities studied and have often been able to qualify for the second round. We test for
12“Left-wing” and “right-wing” parties refer to all parties categorized as “diverse left” and “diverse right”, respectively, by the French Ministry of the Interieur. Green and affiliated refers to the Green party and the lists labeled “Liste Union de la Gauche” (for which a direct translation would be: List of the United Left) which regroups left-wing parties alongside the Green party.
Covid Economics 41, 3 August 2020: 69-99
the smoothness of the presence of each party in the second round in Table8 (AppendixA).
No significant difference is observed around the lockdown border. We also look at different bandwidth sizes to test the robustness of the results to bandwidth selection. In Table3, we display results using 60 km and 50 km bandwidths.
The Green and affiliated parties appear to have gained the most from the lockdown. A treatment effect between 11 and 22 percentage points is estimated.13 We interpret this very substantial gains as the result of the perception of the pandemic as a natural disaster. The possible link between the increased frequency of epidemics in the last 20 years and human activity would substantiate this perception. Right-wing parties also appear to have gained vote share between the two rounds. Discontentment against the health crisis may have induced voters of the presidential party to move to the ideologically nearest party, i.e., right-wing parties.
Table 3: Evolution of the vote share by political groups
Bandwidth 60 60 60 50 50 50
Polynomial order 3 4 5 3 4 5
(a) Left-wing
Treatment 5.522∗∗∗ 5.380∗∗ 3.828 2.782 6.667∗∗ 5.993 (1.858) (2.399) (2.804) (2.601) (2.965) (3.707)
Adj. R2 0.062 0.061 0.062 0.151 0.169 0.187
AIC 15523.89 15527.00 15527.88 6194.26 6178.74 6161.65
Obs. 2,152 2,152 2,152 853 853 853
(b) Green and affiliated
Treatment 6.348 11.190∗∗∗ 22.667∗∗∗ 51.350∗∗∗ 55.147∗∗∗ 68.686∗∗∗
(4.149) (4.272) (5.203) (6.172) (5.245) (8.184)
Adj. R2 0.164 0.192 0.193 0.373 0.580 0.591
AIC 14764.93 14702.01 14701.43 1759.72 1653.38 1647.73
Obs. 1,916 1,916 1,916 271 271 271
(c) Right-wing
Treatment 3.894∗∗∗ 3.723∗∗∗ 3.070∗∗ 5.924∗∗∗ 6.514∗∗∗ 7.839∗∗∗
(1.180) (1.283) (1.367) (1.432) (1.402) (1.822)
Adj. R2 0.080 0.081 0.086 0.136 0.147 0.172
AIC 15625.44 15625.59 15614.78 6303.34 6294.70 6269.39
Obs. 2,188 2,188 2,188 895 895 895
Notes: Unit of analysis is the polling station. Results of smoothness test around the border by partyare displayed in Table8.
13Preferred specification selected based on the AIC value. Overall, the large coefficient estimated using a bandwidth of 50km appears to be mostly driven by outliers given the relatively small number of observations analyzed. Hence, in this particular case, the use of a larger bandwidth appears reasonable.
Covid Economics 41, 3 August 2020: 69-99
4.3 Additional analysis and robustness checks
Local Difference-in-Difference (DiD) analysis — As a robustness check, we run in this section the main analysis with a local difference-in-differences strategy. More precisely, we estimate two different models with the general goal of confirming the results obtained with the spatial RDD analysis. Importantly, in both exercises we only consider municipalities close to the border that marks the two policy areas.
As a first analysis, we estimate a standard difference-in-difference model relying on the variation induced by the differential relaxation of the lockdown policy. Therefore, we compare administrative units located in the red and the green area before -in the first round- and after -in the runoff- the modification of the measures.14 This analysis allows us to include municipal fixed effects in order to capture for municipal-specific and time invariant characteristics. Columns 1-3 of Table4show the corresponding results using three different bandwidths -50, 40 and 30 kilometers-: Panel a confirms the positive effect on the vote share to the incumbent, although the effect is not always statistically significant. Further, Panel b reports the same results for the variable voter turnout and we are not able to confirm the positive effect.15 As a second analysis, we estimate an OLS model using as dependent variable the difference between the value in the runoff and the value in the first round.16 The corresponding results are shown in columns 4-6 of Table4, Panel a and b: the positive effect of lockdown measures on incumbent’s vote share is confirmed, while a positive, but weak, effect emerges when we consider voter turnout as dependent variable.
Naive spatial regression discontinuity design — Instead of using the difference in outcomes between the first and second round of the municipal elections, we now study the
14The estimated model is as follows:
ypir=βP ostr+γRedpir∗P ostr+δXpir+pir (3) whereypirrepresents the dependent variable, for instance, incumbent’s vote share, of polling stationp, in munic- ipalityiin roundr,P ostrindicates the runoff andRedpiris the treatment dummy indicating the municipalities in the red zone. FinallyXpirincludes municipal fixed effects and a set of controls at the polling station level (i.e. number of registered voters and turnout during the first round).
15It is important to mention that we obtain similar results if we include polling station fixed effects instead of municipality fixed effects.
16The estimated model is as follows:
∆ypi=βRedpi+γXpi+ηpi (4) where∆ypiis the difference between the value in the runoff and the value in first round (ypi,2−ypi,1),Redpiis the treatment dummy indicating the municipalities in the red zone andXpirincludes a set of municipal-specific or polling station-specific controls (municipal controls include: distance to the border, latitude/longitude, pop- ulation, age structure, median income in 2017, characteristics of the mayor -gender, year of birth, job category-;
polling station controls include: number of registered voters and turnout during the first round).
Covid Economics 41, 3 August 2020: 69-99
Table 4: Local Difference-in-difference analysis
Bandwidth 50 40 30 50 40 30
DiD OLS
(a) Incumbent’s vote share
Treatment 0.015 2.120∗ 2.306 1.473 2.943∗ 3.692∗∗∗
(1.967) (1.059) (1.794) (1.245) (1.506) (1.137)
N 3290 1602 1078 1645 801 539
R2 0.599 0.632 0.617 0.322 0.181 0.242
(b) Turnout
Treatment -0.781 -0.351 0.877 2.115∗∗∗ 0.521 0.095 (1.312) (0.759) (0.887) (0.672) (0.647) (0.563)
N 8018 2892 1750 3988 1443 875
R2 0.920 0.942 0.941 0.331 0.186 0.220
Municipality FE Yes Yes Yes - - -
Municipal controls Yes Yes Yes Yes Yes Yes
Notes: Unit of analysis is the polling station. The sample includes all French municipalities that experienced a runoff in 2020 municipal election with population higher than 1,000 in- habitants. In Panel A the sample is limited to cities where the incumbent runs in the first round and in the runoff. Standard errors are clustered at the department level.
raw results of the second round around the border. To distinguish it from the spatial RDD specification used above, we label this approach “naive” spatial RDD. As the raw second round results are used, this approach is more prone to violate the smoothness identifying assumption due to differences in fixed municipal characteristics. Nonetheless, it is informative to investigate whether the results in the Table2hold under this specification, even if only to know whether fixed municipal characteristics are indeed a concern in the present setting. Table 5 presents the results. Two key results appear. First, the magnitude of the estimated coefficients increase for both incumbent’s vote share and voter turnout relative to the results using the difference between the election rounds. Second, the parametric approach of the effect of the lockdown on incumbent’s vote share appears much less precisely estimated. This, however, is not the case using the non-parametric approach.
Rolling regressions — To assess the robustness of our results to the exclusion of regional units around the differential lockdown border, we run parametric rolling regressions. We use a 50km bandwidth and various polynomial orders while alternatively excluding all departments around the border. Results are displayed in AppendicesCandB. Overall, results appear robust to the exclusion of any department.
Covid Economics 41, 3 August 2020: 69-99
Table 5: Naive RD design analysis
Approach Parametric Parametric Non-parametric
Bandwidth 50 50 50 50 50 50 Opt. Opt.
Polynomial order 2 3 4 2 3 4 Opt. Opt.
Covariates No No No Yes Yes Yes No Yes
(a) Incumbent’s vote share
Treatment -2.794∗∗ 0.125 0.678 1.893 -1.424 2.734 17.632∗∗∗ 6.877∗∗
(1.215) (1.877) (2.796) (2.009) (2.619) (3.328) (4.096) (3.201)
Adj. R2 0.02 0.05 0.05 0.09 0.12 0.12 - -
AIC 13,078 13,034 13,037 12,964 12,913 12,909 - -
Obs. 1,675 1,675 1,675 1,675 1,675 1,675 2,616 2,616
(b) Voter turnout
Treatment 1.157 3.621∗∗∗ 6.046∗∗∗ 5.523∗∗∗ 7.419∗∗∗ 7.138∗∗∗ 6.241∗∗∗ 5.095∗∗∗
(0.858) (1.213) (1.528) (1.195) (1.538) (1.811) (1.391) (1.243)
Adj. R2 0.08 0.09 0.10 0.23 0.24 0.24 - -
AIC 28,509 28,497 28,420 27,819 27,743 27,743 - -
Obs. 4,009 4,009 4,009 4,009 4,009 4,009 5,998 5,998
Notes: Unit of analysis is the polling station.
Additional analysis — To complete our analysis of the lockdown effects on voting out- comes, we present two complementary analysis in Table 9 (Appendix A). We first look at incumbent’s vote share and turnout in all municipalities jointly (i.e., above and below 1,000 inhabitants). Estimated coefficient point in the same direction with similar magnitude as in Table2, however, results appear much less significant. Given the electoral rules in small mu- nicipalities (i.e., two rounds block vote with panachage), this result is not surprising as many candidates were already elected to the council in the first round. Second, we focus on electoral outcomes in the yellow zone relative to the red zone. To do so, we consider as treated all mu- nicipalities in the yellow zone, and as control all municipalities in the green zone within 50km of the yellow zone. Overall, the lockdown effect in the yellow zone on incumbent’s vote share and voter turnout is similar in sign and magnitude to the effect on the red zone. However, the coefficient are less precisely estimated.
5 Concluding remarks
The COVID-19 outbreak represents an unprecedented global crisis which is likely to deeply affect economic, social and political outcomes. Most governments faced the worst phases of the pandemic imposing a set of social containment measures, the lockdown. In many countries different forms of lockdown measures remained in force also after the peak, as the contagion curve showed weak signs of abating. There are also cases in which these restrictions have been reintroduced after an initial relaxation, as was recently the case in Atlanta, Barcelona
Covid Economics 41, 3 August 2020: 69-99
or in specific areas of Germany, and we may expect these precautionary measures to be used extensively in the near future in many areas.17 Nonetheless, despite the relevance of these policies, very little is still known on their impact on voting behaviour.
This paper is among the first to provide a causal evidence of the impact of the introduction of lockdown measures on voting and electoral outcomes. We focus on France which introduced a differential lockdown, dividing the country between a red area, subject to a “hard” lockdown, and a green area, subject to a “soft” one. Moreover, the occurrence of 2020 French municipal elections allows us to measure voting behaviour before and after the implementation of the restriction measures. Therefore, we can exploit this unique setting to estimate a spatial RDD model using as dependent variable the difference in outcomes between the two electoral rounds:
what we compare are cities located across the border, subject to different rules, before and after the implementation of the lockdown.
Our findings suggest that the severity of the lockdown significantly affects electoral outcomes and voting behaviour. First, we find that areas subject to the longer lockdown display higher support for the local incumbent, as well as for the Green party. Second, it emerges that municipalities in the red area have a higher level of voter turnout. These results seem to support the “rally around the flag” hypothesis: voters subject to the “hard” lockdown, indeed, either feel safer or are more aware of the health crisis, and therefore grateful for the policy.
This reinforces local incumbents and mobilize voters at the polls.
The results of this paper show that voters experiencing containment measures increase their loyalties for political institutions. This legitimates the imposition of such limitations and may have important consequences in terms of political stability in the aftermath of the crisis. In terms of external validity, lockdown policies have been imposed to millions of individuals in many countries but the impact of these restrictions on the approval for governments clearly depends on many local factors such as the management of the health crisis as well as the policies implemented.
17The city of Atlanta was reopened at the end of May 2020, but a new surge in Coronavirus cases led the administration to reintroduce the lockdown in mid July (https://www.ft.com/content/255b99c1-c08c-3df9-874b-400a8cf27e04). Simi- lar episodes happened in Barcelona (https://www.theguardian.com/world/2020/jul/15/
global-report-barcelona-facing-new-lockdown-as-tokyo-raises-alert-level) and in the district of Guetersloh, in the state of North Rhine-Westphalia (https://www.bbc.com/news/world-europe-53217861).
Covid Economics 41, 3 August 2020: 69-99
References
Jais Adam-Troian, Eric Bonetto, Florent Varet, Thomas Arciszewski, and Théo Guiller.
Pathogen threat increases electoral success for conservative parties: Results from a natu- ral experiment with covid-19 in france. 2020.
Ali T Akarca and Aysit Tansel. Voter reaction to government incompetence and corruption related to the 1999 earthquakes in turkey. Journal of Economic Studies, 2016.
Francesc Amat, Andreu Arenas, Albert Falcó-Gimeno, and Jordi Muñoz. Pandemics meet democracy. experimental evidence from the covid-19 crisis in spain. 2020.
Matthew A Baum. The constituent foundations of the rally-round-the-flag phenomenon. In- ternational Studies Quarterly, 46(2):263–298, 2002.
Alec T Beall, Marlise K Hofer, and Mark Schaller. Infections and elections: Did an ebola outbreak influence the 2014 us federal elections (and if so, how)? Psychological Science, 27 (5):595–605, 2016.
Michael M Bechtel and Jens Hainmueller. How lasting is voter gratitude? an analysis of the short-and long-term electoral returns to beneficial policy. American Journal of Political Science, 55(4):852–868, 2011.
Damien Bol, Marco Giani, André Blais, and Peter John Loewen. The effect of covid-19 lock- downs on political support: Some good news for democracy? European Journal of Political Research, 2020.
Sebastian Calonico, Matias D. Cattaneo, and Rocio Titiunik. Robust nonparametric confidence intervals for regression-discontinuity designs. Econometrica, 82(6):2295–2326, 2014.
Filipe R Campante, Emilio Depetris-Chauvin, and Ruben Durante. The virus of fear: The political impact of ebola in the us. Technical report, National Bureau of Economic Research, 2020.
Virginia A Chanley. Trust in government in the aftermath of 9/11: Determinants and conse- quences. Political psychology, 23(3):469–483, 2002.
Catherine E De Vries, Bert N Bakker, Sara Hobolt, and Kevin Arceneaux. Crisis signaling:
How italy’s coronavirus lockdown affected incumbent support in other european countries.
Available at SSRN 3606149, 2020.
Covid Economics 41, 3 August 2020: 69-99
Lina M Eriksson. Winds of change: Voter blame and storm gudrun in the 2006 swedish parliamentary election. Electoral Studies, 41:129–142, 2016.
Peter Esaiasson, Jacob Sohlberg, Marina Ghersetti, and Bengt Johansson. How the coronavirus crisis affects citizen trust in government institutions and in unknown others–evidence from
“the swedish experiment”. 2020.
Thiemo Fetzer, Lukas Hensel, Johannes Hermle, and Christopher Roth. Coronavirus percep- tions and economic anxiety. Review of Economics and Statistics, pages 1–36, 2020.
Zack P Grant and James Tilley. Fertile soil: explaining variation in the success of green parties.
West European Politics, 42(3):495–516, 2019.
Allison Harell. How canada’s pandemic is shifting political views. report for the institute for research on public policy, 2020.
Andrew Healy and Neil Malhotra. Myopic voters and natural disaster policy.American Political Science Review, pages 387–406, 2009.
David S. Lee and Thomas Lemieux. Regression discontinuity designs in economics. Journal of Economic Literature, 48(2):281–355, 2010.
Arndt Leininger and Max Schaub. Voting at the dawn of a global pandemic. 2020.
Elisa M Maffioli. The political economy of health epidemics: evidence from the ebola outbreak.
Available at SSRN 3383187, 2018.
Hani Mansour, Daniel I Rees, and James M Reeves. Voting and political participation in the aftermath of the hiv/aids epidemic. Technical report, National Bureau of Economic Research, 2020.
Eric Merkley, Aengus Bridgman, Peter John Loewen, Taylor Owen, Derek Ruths, and Oleg Zhilin. A rare moment of cross-partisan consensus: Elite and public response to the covid-19 pandemic in canada. Canadian Journal of Political Science/Revue canadienne de science politique, pages 1–8, 2020.
John E Mueller. Presidential popularity from truman to johnson. The American Political Science Review, 64(1):18–34, 1970.
Chris G Sibley, Lara M Greaves, Nicole Satherley, Marc S Wilson, Nickola C Overall, Carol HJ Lee, Petar Milojev, Joseph Bulbulia, Danny Osborne, Taciano L Milfont, et al. Effects of
Covid Economics 41, 3 August 2020: 69-99
the covid-19 pandemic and nationwide lockdown on trust, attitudes toward government, and well-being. American Psychologist, 2020.
Jean-David Zeitoun, Matthieu Faron, Jerome Fourquet, Marc Lavielle, et al. Reciprocal asso- ciation between participation to a national election and the epidemic spread of covid-19 in france: nationwide observational and dynamic modeling study. medRxiv, 2020.
Covid Economics 41, 3 August 2020: 69-99
A Appendix: Supporting material
Figure 5: Differential lockdown from June 2ndto June 22nd, 2020
Border 50km bandwidth Departmental borders
Zone under faster relaxation of lockdown Zone under slower relaxation of lockdown Municipalities
¯
0 200 400Kilometers
Covid Economics 41, 3 August 2020: 69-99
Table 6: Descriptive statistics
Average value Standard deviation N Panel A: Electoral outcomes (polling station)
Incumbent’s vote share (diff) 6.762 9.581 1,737
Turnout (diff) -2.892 6.334 4,462
Victory margin (diff) 6.436 12.062 4,376
White votes (diff) 2.446 6.287 4,462
Number candidates (diff) -4.417 3.309 4,462
Panel B: Controls variables (municipality)
Population (0-14) 69,713.4 117,554.6 4,525
Population (15-29) 114,806.3 197,925.7 4,525
Population (30-44) 107,374.4 188,941.2 4,525
Population (45-59) 87,667.5 154,789.4 4,525
Population (60-74) 66,597.3 118,610.3 4,525
Population (75-89) 31,981.1 55,902.7 4,525
Population (90+) 5,382.5 9,437.7 4,525
Female population 255,901.8 446,613.9 4,525
Pop. growth rate (2011-2016) 1.640 5.989 4,525
Median income (2017) 23,378.4 4,452.2 4,480
Notes: The sample under consideration includes municipalities with population higher or equal than 1,000 inhabitants that have a runoff in 2020 French municipal elections. The variables in Panel A are expressed in difference between the two electoral round. The variableIncumbent’s vote share (diff )is only defined for municipalities in which the incumbent runs in both rounds. Population variables are defined according to 2016 population census.
Table 7: Spatial RD design analysis of turnout
Approach Parametric
Bandwidth 60 60 60 50 50 50 40 40 40
Poly. order 2 3 4 2 3 4 2 3 4
(a) Incumbent’s vote share
Treatment 3.057∗∗∗ 1.541 3.658∗∗ 3.303∗∗∗ 3.534∗∗ 4.836∗∗ 2.436 4.597∗∗ 1.414 (0.987) (1.161) (1.574) (1.209) (1.439) (1.888) (1.590) (1.877) (2.215)
Adj. R2 0.21 0.23 0.24 0.22 0.29 0.29 0.11 0.12 0.14
AIC 13,156 13,099 13,081 10,742 10,603 10,588 5,195 5,187 5,176
Obs. 2,019 2,019 2,019 1,645 1,645 1,645 801 801 801
Covariates Yes Yes Yes Yes Yes Yes Yes Yes Yes
(b) Voter turnout
Treatment 1.315∗∗∗ 1.999∗∗∗ 2.505∗∗∗ 1.990∗∗∗ 2.919∗∗∗ 2.343∗∗∗ 1.500∗∗ -0.078 0.033 (0.453) (0.636) (0.763) (0.543) (0.715) (0.829) (0.682) (0.860) (0.954)
Adj. R2 0.22 0.22 0.22 0.26 0.26 0.26 0.09 0.10 0.10
AIC 27,389 27,375 27,375 21,664 21,658 21,657 7,900 7,880 7,884
Obs. 4,927 4,927 4,927 4,009 4,009 4,009 1,446 1,446 1,446
Covariates Yes Yes Yes Yes Yes Yes Yes Yes Yes
Notes:Unit of analysis is the polling station.