Research Collection
Journal Article
Effects of different energy intakes before and after calving on food intake, performance and blood hormones and metabolites in dairy cows
Author(s):
Kunz, P. L.; Blum, J. W.; Hart, I. C.; Bickel, H.; Landis, J.
Publication Date:
1985
Permanent Link:
https://doi.org/10.3929/ethz-b-000422479
Originally published in:
Animal Science 40(2), http://doi.org/10.1017/S0003356100025320
Rights / License:
In Copyright - Non-Commercial Use Permitted
This page was generated automatically upon download from the ETH Zurich Research Collection. For more information please consult the Terms of use.
ETH Library
EFFECTS OF DIFFERENT ENERGY INTAKES BEFORE AND AFTER CALVING ON FOOD INTAKE, PERFORMANCE AND BLOOD
HORMONES AND METABOLITES IN DAIRY COWS
P. L. KUNZ AND J. W. BLUM
Institute for Animal Production, Swiss Federal Institute of Technology, 8092 Zurich, Switzerland I. C. HART
National Institute for Research in Dairying, Shinfield, Reading RG2 9AT AND
H . BlCKEL AND J. LANDIS
Institute for Animal Production, Swiss Federal Institute of Technology, 8092 Zurich, Switzerland ABSTRACT
An experiment with 25 dairy cows was performed to investigate the effects of different energy intakes on food intake, performance and blood hormone and metabolite levels during the last 70 days of pregnancy and the first 125 days after parturition. Compared with animals fed ad libitum before parturition, cows fed only according to requirements during the same time showed no decrease of food intake at calving. Cows fed at a restricted level also showed a faster increase in food intake, a smaller energy deficiency at the onset of lactation and a smaller weight loss after parturition. Peak milk yield was also lower, but the peak was maintained for a longer period, and during the first 2 months of lactation these cows had higher concentrations of glucose and lactic acid, and lower concentrations of non-esterified fatty acids and ketone bodies in the blood. Weight losses, and decrease of milk production during the 1st weeks of lactation were higher in cows fed only 0-75 of requirements during the first 60 days of lactation than in animals whose energy intake was planned to cover energy requirements, and during the first 2 months of lactation levels of unesterified fatty acids, ketone bodies and urea were higher, whereas levels of insulin, thyroxine and triiodothyronine were lower. Endocrine and metabolic changes seen during early lactation suggested improved glucose homeostasis, diminished fat mobilization and ketogenesis in cows .given reduced amounts of energy during the dry period compared to animals fed ad libitum. To prevent the development of acetonaemia an adequate energy supply during the first part of lactation is, however, of greater importance.
INTRODUCTION Stober and Dirksen, 1982). The effects of feeding cows low and high amounts of energy ENERGY REQUIREMENTS cannot be fully met before parturition on food intake, live-weight in early lactation and animals compensate for changes and milk production have been the resulting energy deficit by mobilizing studied. The experimental conditions made it body tissue primarily in the form of body fat. possible to measure blood levels of hormones As a consequence, considerable amounts of and metabolites in relation to changes in non-esterified fatty acids may be converted to energy metabolism. The relative importance ketone bodies, sometimes leading to ketosis of the degree of energy deficiency during the and other problems, often known as the fat first 2 months of lactation for the cow syndrome (Baird, Heitzman, Hibbit and development of acetonaemia was investigated Hunter, 1974; Farries, 1975; Morrow, 1976; by deliberate underfeeding.
219
MATERIAL AND METHODS
Experimental design and feeding
The experiments were carried out on 25 dairy cows (Schweizerisches Braunvieh purebred or crossed with Brown Swiss) in their second to ninth lactations. Their preceding average lactation yield was 4429 (s.e. 121) kg milk during a 305-day period (standard lactation). The animals were divided into three groups of similar body weights and performance (group A, 8 animals; group B, 9 animals; group C, 8 animals).
The diet was hay, grass pellets, maize cubes (whole plant), concentrates and protein meal fed to achieve the different energy intakes of each group (Table 1). Group A received, during the last 70 days of pregnancy, a ration restricted to meet their requirements. Feeding to requirements was planned after calving, but this was not entirely achieved (see results). Group B received roughage ad libitum and some concentrates during the last 70 days of pregnancy, and after parturition was fed in
the same manner as group A. Group C was fed as group B during the dry period. During the first 60 days of lactation, energy intake was restricted to about 0-75 of the calculated requirements. From 60 to 125 days after calving, this group was fed as groups A and B.
Frequent analysis of food was used as a basis for calculating the energy value (NEL = net energy lactation) by using appropriate regression equations. The energy requirements were calculated as follows:
NEL (MJ/day) required for maintenance = 0-276BW</4 pregnancy = 0-087e""17' milk production = 3 14ECM,
where BW = body weight (kg), measured 12 h after food intake, t = days of pregnancy, ECM = energy-corrected milk yield (kg) = (0-387 g fat per day per 1) + (0-245 g protein per day per 1) + (0155 g lactose per day per l)/3-14.
Metabolizability of the diets in the different groups and in the different periods varied TABLE 1
Intake of food components, dry matter (DM), net energy lactation (NEL) intake and NEL balances
5 to 60 days after parturition
61 to 125 days after parturition
300 001 7-14 0-11
2-98 001 300 001 6-42 0-17 7-21 0-15 70 to 5 days
before parturition Groups A B + C
Mean s.e. Mean s.e. Mean s.e. Mean s.e. Mean s.e. Mean s.e. Mean s.e. Mean s.e.
Hay (kg/day) 2-56 005 2-63 005 2-99 0-08 3-03 0-04 Grass (kg/day) 3-20 0-10 2-72 1-76 5-53 0-13 5-03 0-22 Maize cubes
(kg/day) 2-48 0-11 7-49 0-14 6-44 0-08 6-06 0-17 Concentrates
(kg/day) 0-38 008 0-86 0 1 2-92 011 3-10 012 Protein mealt
(kg/day) DM intake
(kg/day) 7-3 0-8 11-9 l-3a 15-8 0-1 15-6 0-2 NEL intake
(MJ/day) 42-6 2-5 73-5 0-7a 99-4 0-6 99-6 1-3 72-1 0-7a>b 103-4 0-7 101-7 1-0 96-2 0-8 NEL balance
(MJ/day) -1-6 0-3 27-7 0-6" 1-1 1-0 -4-9 1-5 -29-9 0-7a-b 9-4 0-7 4-5 0-5 6 1 0-5 t Components: wheat, 350 g/kg; barley, 230 g/kg; maize, 150 g/kg; soya bean meal, 150 g/kg; oats, 100 g/kg; minerals,
20 g/kg.
a, significantly different from A (P < 0-05); b, significantly different from B (P < 005); no symbol, P > 005. No statistical analysis was done on intake of various food components.
2-97 0-02 5-39 0-10 319 010 0-53 0-01 1-29 0-06
6-73 0-11 6-27 0-14 6-19 014 2-19 007 212 0-08 1-51 0-05 005 0-02 11-8 0-la-b 16-6 0 1 16-2 0 1 15-6 0 1
from 0-56 to 0-59. Corresponding partial efficiency of metabolizable energy (ME) utilization for lactation amounted to 0-601 (s.d. 0-004). Therefore, a common conversion factor, F = 1-704, can be used to calculate ME values from NEL values for this experiment.
Blood samples
Blood samples were obtained by jugular venepuncture between 13.00 and 14.00 h, just before the animals received their afternoon feed. A 40 ml aliquot was immediately transferred to polypropylene tubes containing 2000 units (USP) of heparin (Liquemine, F.
Hoffmann-La Roche and Co., Switzerland) and another 5 ml to tubes containing fluoride and oxalate (Milian SA, 1000 Geneva, Switzerland). Heparinized and fluoride- oxalated tubes were kept on ice until they were centrifuged at 4°C and the plasma was separated within 2 h of collection. In addition, 25 ml blood were transferred to polypropylene tubes containing 25 ml ice-cold perchloric acid (0-7 mol/1). The tubes were vigorously shaken, placed on ice, centrifuged within 2 h at 4°C and the supernatants filtered. Finally, 30 ml blood were transferred to glass tubes, which, after clot retraction, were centrifuged for the collection of serum.
Plasma, serum or perchloric acid extracts were stored in plastic tubes at -20°C until analysed.
Heparinized plasma was used for the determination of immunoreactive insulin (IRI), growth hormone (GH), non-esterified fatty acids (NEFA), albumin, a-amino acid- nitrogen (AAN) and urea. Fluoride-oxalated plasma was used for the determination of glucose and serum for the measurement of thyroxine (T4), 3,5,3'-triiodothyronine (T3) and their non-proteinbound (free) fractions (FT4, FT3). Filtered perchloric acid extracts were used for the determination of acetoacetate (AAC), P-hydroxybutyrate (BHB) and L-lactic acid. These measurements were made in all samples, except for AAC, which in group A and B was recorded only in every second
sample, and for FT4 and FT3, which were determined only in 11 samples from each animal.
Laboratory methods
Concentrations of fat, protein and lactose in milk samples were determined by the Swiss Braunvieh Cattle Breeders Association by the Infrared-spectrometer- analysis method (GP-Industries-Instrumentation, Newcastle-upon-Tyne). Food analysis (crude ash, crude protein, crude fibre and pepsin- HCl-soluble protein) were performed at the Fedral Research Station for Animal Production by standard procedures. The concentrations of IRI, T4 and T3, FT4 and FT3 (by equilibrium dialysis), NEFA, albumin, AAN, urea, glucose, AAC, BHB and lactate were determined as previously described (Blum, Gingins, Vitins and Bickel, 1980; Blum, Kunz, Bachmann and Colombo, 1981; Blum, Kunz and Frohli, 1982; Blum, Kunz, Leuenberger, Gautschi and Keller, 1983a). GH was measured according to the method of Hart, Flux, Andrews and McNeilly (1975).
Statistical analyses
Data were divided into four periods: (1) 70 days to 5 days before parturition; (2) 5 days before to 5 days after parturition (data from this period were not statistically analysed); (3) 5 days to 60 days after parturition; (4) 61 to 125 days after parturition. Because some data were not normally distributed, group differences were uniformly tested by the non- parametric H-test of Kruskal and Wallis (1952) using BMDP-3S programs of Chasen (1977).
RESULTS
Food intake and performance
These results are summarized in Figure 1 and Tables 1 and 2. The dry-matter (DM) intake during the dry period in group A was significantly lower than in groups B and C, which were fed ad libitum (P < 0-001). After a slight decrease at parturition in group B,
222
Group A DM intake (kg/day) 18
14 10
Group C
r - b — r - d ~\
18' 14 10
- 5 0 0 50 100 _5 0 o 50 100 Days from parturition D a y s from parturition
I— a — | c 1 |— b —I c NEL-balance (MJ NEL per day)
401 40"
- 5 0 0 50 100 Days from parturition
rbTdrci
- 4 0
- 5 0 0 50 100
Days from parturition - 5 0 0 50 100 Days from parturition
c
- 5 0 0 50 100 Days from parturition i— d , c ,
25 20 15
0 40 80 120 Days from parturition a —i c 1
r
Body weight (kg) 700"
650 600 550
0 40 80 120 Days from parturition
r
0 40 80 120 Days from parturition
r
bT
dT
cn
700- 650 600 550
700- 650 600 550
- 5 0 0 50 100 Days from parturition
- 5 0 0 50 100 Days from parturition - 5 0 0 50 100
Days from parturition
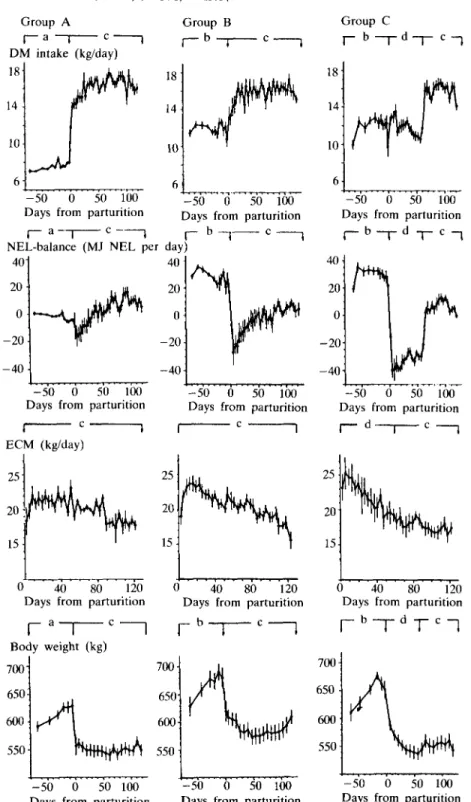
FIG. 1. Dry-matter intake, net energy lactation balances, energy-corrected milk yield and live-weight changes of groups A, B and C before and after parturition.
Animals were fed at different levels: (a) energy supply according to requirements for maintenance, and requirements for the development of foetus, uterus and mammary gland; (b) roughage ad libitum; (c) energy supply according to requirements for maintenance and lactation; (d) feeding with about 0-75 of energy requirements. Data are means ± s.e. of means.
but not in group A, the DM intake then rapidly increased. From 5 to 60 days of lactation DM intake of group C, because of restricted feeding, was significantly smaller than in the other groups (P < 0-01). From 61 to 105 days intakes of all other groups were similar.
NEL intake of all groups closely followed DM intake (r = 0-98). The differences between NEL intakes and NEL requirements (NEL balances) are presented. During the dry period, NEL intakes and NEL requirements were practically identical in group A, while groups B and C had at the same time a considerable energy surplus (P < 0-001). After calving all groups ran immediately into an energy deficit. Group B initially showed a more marked energy deficit than group A, though for the first 60 days of lactation the difference was not statistically significant. According to the experimental design the energy deficit was greatest for group C, but energy intake rapidly exceeded requirements during realimentation, starting 60 days after parturition.
Average milk yield (ECM) during the first 125 days was similar in all groups. The most marked difference between groups was a considerably lower peak yield for group A as compared with groups B and C. However, the peak yield was maintained for up to 60 days by animals of group A, while the yield started to decline after only 20 days in groups B and C.
Milk fat content was similar during the first 125 days of lactation in groups A, B and C,
but decreased in group C from 61 to 125 days post partum (P < 0-05), whereas milk protein and lactose content were similar in all groups throughout the study (Table 2).
Body-weight gains of group A during the dry period were considerably lower and weight losses from 5 to 60 days after parturition were 2-7 and about 4-2 times smaller than in groups B and C, respectively (P < 0-05).
Metabolites
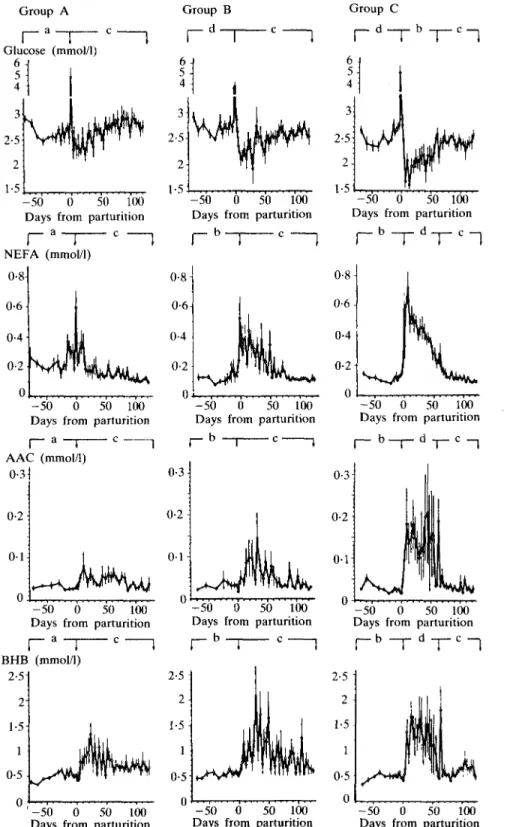
These results are summarized in Figures 2 and 3, and Table 3. Plasma levels of glucose in the three groups were similar during the dry period, transiently increased at parturition and fell thereafter. There was a decrease, post partum, lasting up to 3 weeks after parturition, which was smaller in group A than in group B, and largest in group C.
Glucose levels then slowly increased to a new plateau. From 60 to 125 days after parturition glucose levels remained higher in group A than in group B (but not significantly), but levels in group C were lower than in groups A and B (P < 0-05).
The concentrations of lactate (not shown) changed in a similar manner to those of glucose. They were comparable in all groups during the dry periods. During lactation the highest concentrations were recorded in group A and the lowest in group C.
Plasma NEFA levels were significantly higher, from 70 to 5 days before parturition, in group A than in groups B and C (P < 0-01). They started to increase slightly TABLE 2
Milk yield (ECM) and milk fat, protein and lactose concentrations
Groups
ECM Milk Milk Milk
[ (kg/day) fat (g/l) protein (g/I) lactose (g/l)
A Mean
21-2 41 35 51
s.
0 0 0 0 e.
•2
•2
•1
•1
5 to 60 days after parturition
B Mean
22-2 42 34 51
s.e.
0-2 0-3 0-2 0 1
C
f *
Mean 21-8 42 34 50
s.e.
0-3 0-4 0-2 0-1
A Mean
19-0 42 35 51
s.
0 0 0 0 e.
•1
•2
•2
•1
61 to :125 days after parturition
Mean 19-4 42 34 51
B C i s.e. Mean
0-1 17-7 0-2 39 0-2 33 0 1 50
s.e.
0-2 0-3a 0-3 0-4 a, significantly different from A (P < 005); no symbol, P > 0-05.
Group A
- 5 0 0 50 100 Days from parturition
r
aNEFA (mmol/1)
- 5 0 0 50 100 Days from parturition
- 5 0 0 50 100 Days from parturition
- 5 0 0 50 100 Days from parturition AAC (mmol/1)
0-3
0-2
0 1
- 5 0 0 50 100 Days from parturition
- 5 0 0 50 100 Days from parturition
0-3
0 - 2 -
0-1-
0-3
0-2
0-1
- 5 0 0 50 100 Days from parturition
a —| c 1
r
BHB (mmol/1) 2-5-
2- 1-5
1 0-5
- 5 0 0 50 100 Days from parturition
i— b
0
2-5
0
- 5 0 0 50 100 Days from parturition
i— b —r- d -,— c
~i
2-5 2 1-5 1 0-5 0
- 5 0 0 50 100 - 5 0 0 50 100 - 5 0 0 50 100 Days from parturition Days from parturition Days from parturition
FIG. 2. Blood levels of glucose, non-esterified fatty acids (NEFA), acetoacetate (AAC), and {Miydroxybutyrate (BHB) of groups A, B and C before and after parturition. For details see legend to Figure 1.
Group A Group B Group C
T~
c~l
-50 0 50 100 Days from parturition
-50 0 50 100 Days from parturition
b
-50 0 50 100 Days from parturition
b —i— d -i— c —
r
-50 0 50 100 -50 0 50 100 -50 0 50 100 Days from parturition Days from parturition Days from parturition
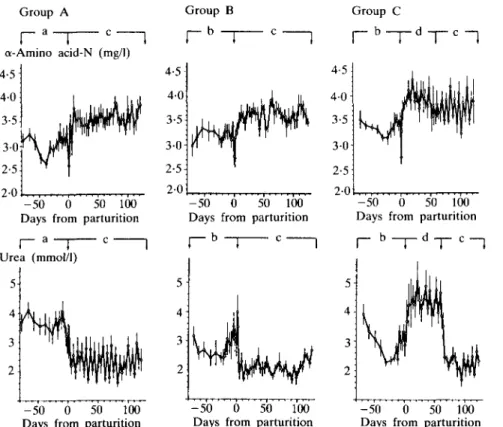
FIG. 3. Bloqd levels of a-amino acid-nitrogen (AAN) and urea of groups A, B and C. For details see legend to Figure 1.
20 days before parturition, reached their highest levels within the first 5 days after parturition and then decreased. From 5 to 60 days after parturition NEFA were lowest in group A and during this period concentrations were significantly higher in group C than in groups A and B (P < 0-01).
From 60 to 125 days post partum group differences were no longer detectable.
Plasma levels of AAC and BHB changed in parallel (r = 0-89). Concentrations were similar in all groups from 70 to 5 days before parturition. After parturition they increased and remained high, compared to values during the dry period, for about 2 months.
From 5 to 60 days after parturition average concentrations were lowest in group A and highest in group C, but were very similar in all groups from 60 to 125 days after calving.
None of the cows developed clinical ketosis.
Concentrations of albumin did not change, were within the physiological range and very
similar in all groups (not shown). Mean AAN levels during the dry period were similar in all groups, they transiently decreased at parturition and then increased within 5 to 10 days above the preparturient concentrations.
AAN levels were highest in group C from 5 to 60 days after parturition, but there were no significant differences between groups A, B and C throughout the experiment.
Circulating urea was significantly higher before parturition in group A than in groups B and C (P < 001). At the onset of lactation, urea levels decreased in groups A and B. In group C urea was raised from 5 to 60 days after parturition markedly above concentrations in groups A and B (P < 0-01), and then decreased.
Hormones
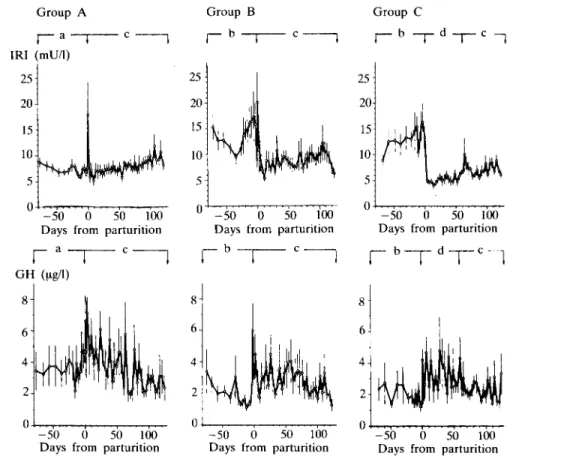
These results are summarized in Figures 4 and 5 and Table 3. From 70 to 5 days before parturition insulin levels were
-50 0 50 100 Days from parturition
a
-50 0 50 100 Days from parturition
b
- 5 0 0 50 100 Days from parturition
r
8 6 4- 2- 0
-50 0 50 100 -50 0 50 100 -50 0 50 100 Days from parturition Days from parturition Days from parturition
FIG. 4. Blood levels of insulin (IRI) and growth hormone (GH) of groups A, B and C. For details see legend to Figure 1.
significantly lower in group A than in groups B and C (P < 0-01), they increased at parturition and transiently decreased during the subsequent 10 days in groups B and C, but not in group A. IRI levels were lowest in group C from 5 to 60 days after parturition, but rapidly normalized following realimentation from 60 to 125 days after parturition.
Plasma GH showed marked variations.
From 70 to 5 days before parturition concentrations were significantly higher in group A than in groups B and C (P < 005), increased at parturition, tended to be elevated during the first 2 months of lactation, but there were no group differences.
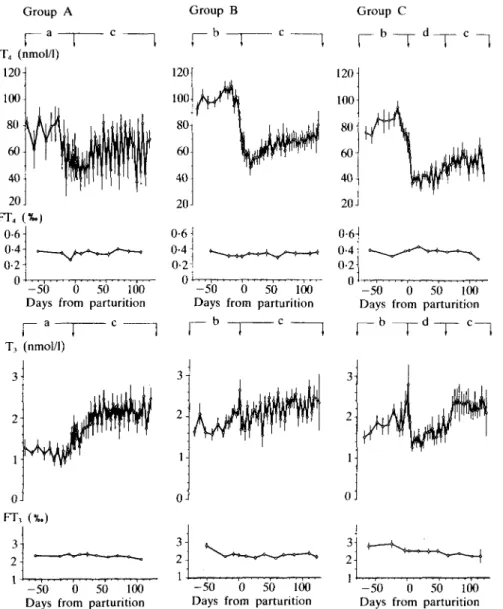
T4 levels, which before parturition were not statistically different between groups, slowly increased up to 20 days before parturition, then rapidly decreased towards calving. T4
concentrations were higher before than after parturition. After parturition they exhibited more marked variation in group A compared to groups B and C. From 5 to 60 days after parturition T4 was significantly lower in group C than in group B (P < 0-05). FT4 fractions did not change during the experiment and were comparable in the three groups.
From 70 to 5 days before parturition T3
concentrations were significantly lower in group A than in groups B and C (P < 0-01).
T, transiently increased at parturition, then from 5 to 60 days after parturition average T3
levels were markedly higher in groups A and B than in group C (P < 001). T, became rapidly normalized during realimentation in group C.
DISCUSSION
Marked fat deposition during the dry period was easily achieved by ad libitum
-50 0 50 100 Days from parturition
r
T, (nmol/1)
2-
1-
FT, (%.) 3- 2 - ' 1
-50 0 50 100 Days from parturition
, — b —i c
-50 0 50 100 Days from parturition
i— b — i — d — i — c —
1
3- 2- 1- 0- 3- 2- 1 -50 0 50 100 Days from parturition
3-
2-
0J
3 2-
1 -50 0 50 100 Days from parturition -50 0 50 100
Days from parturition
FIG. 5. Blood levels of thyroxine (T4) and 3, 5, 3'-triiodothyronine (T3) of groups A, B and C. For details see legend to Figure 1.
feeding. In cows fed reduced amounts of energy before parturition, compared to those fed ad libitum, DM intake after parturition increased slightly faster and energy deficiency and weight losses during the first weeks of lactation were smaller. Although milk yields were initially lower in these cows, total milk production was, however, similar to the other groups as a consequence of its better persistency. Similar findings concerning food intake, energy balance, milk production and changes in body weight have been reported
by Davenport and Rakes (1969), Emery, Hafs, Armstrong and Snyder (1969), Gardner (1969), Gardner and Park (1973), Farries (1975), Lodge, Fisher and Lessard (1975), Hernandez-Urdaneta, Coppock, McDowell, Gianola and Smith (1976), Coenen (1979), Land and Leaver (1981), Garnsworthy and Topps (1982) and Krohn, Hvelplund and Andersen (1983). The more marked energy deficit during early lactation in animals fed ad libitum during the previous dry period, compared to those fed only according to
TABLE 3
Blood levels of metabolites and hormones
Groups
Glucose (mmol/1) Lactate
(mmol/1) NEFA
(mmol/1) A A C
(nmol/1) BHB
(mmol/1) Albumin
(g/1) AAN (mg/1) Urea
(mmol/1) IRI
(mU/1) G H
70 to 5 days before parturition
A B + C
5 to 60 days after parturition
61 to 125 days after parturition
B B
Mean s.e. Mean s.e. Mean s.e. Mean s.e. Mean s.e. Mean s.e. Mean s.e. Mean s.e.
2-5 0-6 2-6 0-1 2-5 0-2 2-3 0-2 2-1 0-1 2-8 0-1 2-6 0-1 2-4 0-la 0-71 0 0 5 0-68 0-05 0-64 0-07 0-54 0 0 2 0-48 0-04a'b 0-71 0 0 2 0-65 0-02 0-62 0-03 0-21 0-3 0 1 2 0-02 0 1 9 0 0 3 0-27 0-07 0-41 0-03a'b 0 1 3 0-01 0-12 0 0 1 0 1 2 0-01 57 14 91 30 140 47 37 4-5 40 5-2 37 6-3
0-27 1-3 0-34 0-68 0-06 0-79 0-11 0-61 0-08 32 3-8 32 5-2
0-51 0-02 0-51 0-05 40
29
0-07 39 1-4 33
1 1 1-1 3-7 0-2 2-9 0-2"
0-86 0-15 11 40 1-1 39 35 1-8 36 2-3 0-3 2-1 7-0 0-8 8-2
T4
(nmol/1) T3
(nmol/1)
7-1 0-6 13-6 2-3
3-6 0-6 2 1 0-6 4-3 0-6 3-0 0-5 69 12 90 6 57 10 60
11 0 1 5 1-7 016a 1-9 0-26 2-1
0-07 41 0-7 41 1-3 39 1-8 36 0-1 4-4 0-3a'b 2-3 1-0 5-3 0-6 9-2
3-2 0-5 5 41 4b
0-19 1-5 0-16b 2-1
1 1 40 1-1 37 0-3 2 1 1-3 9-5 2-8 0-6 2-5 63 11 69
1-0 40 1-1 1-3 37 1-3 0-1 2-3 0-1 1-3 7-5 0-9 0-4 2-2 0-3 6 54 6 0-27 2-3 0-19 2-2 0-25 a, significantly different from A (P < 0 0 5 ) ; b, significantly different from B (P < 0 0 5 ) ; no symbol, P > 0 0 5 .
requirements, can be explained by the probably the consequence of high glucose somewhat slower rise of DM intake after requirements for lactose synthesis calving, and by the higher initial milk yields. (Bickerstaffe, Annison and Linzell, 1974).
A good appetite after parturition is Because the energy-corrected milk yield of considered an important factor for the the three experimental groups was similar, prevention of ketosis (Baird et al., 1974). The whereas glucose levels were different during falling body weight from 5 to 60 days after the first 60 days of lactation, other factors calving was the consequence of fat and than the glucose requirement for lactose protein mobilization. The marked energy synthesis influenced the degree of deficit, achieved in the deliberately underfed hypoglycaemia. The relatively small drop in animals during the first 60 days of lactation, circulating glucose during early lactation in caused a relatively rapid fall in milk yield, animals fed restricted amounts of energy demonstrating that high milk yields cannot be during the dry period, compared to animals maintained over long periods by mobilizing fed ad libitum, expresses improved glucose tissue reserves. homeostasis. The low amounts of energy fed Different levels of feeding during the dry for 60 days after calving to group C was period had no significant influence on most probably responsible for low glucose circulating glucose and lactate. The marked and lactate levels.
increase of glucose and lactate at parturition The increase of NEFA in animals fed only was presumably in part due to stress. The according to requirements before parturition decrease of glucose after parturition was was presumably facilitated by low circulating
insulin and by high circulating GH. The pattern of NEFA before, during and after parturition has already been noted (Radloff and Schultz, 1967; Seidel, Pufe, Mueller, Gruen, Kolb and Schuhmacher, 1973; Blum et al, 1983a). Circulating NEFA after parturition reflected differences in energy supply between groups. The elevated NEFA in animals fed ad libitum during the dry period, compared to those fed at a restricted level, indicate that degree and duration of fat mobilization might also depend on the quantity of fat accumulated during the dry period.
During the dry period, raised NEFA levels in cows fed according to requirements did not lead to increased ketone body formation.
However, the high amounts of NEFA circulating in deliberately underfed cows during early lactation were obviously diverted significantly towards ketone bodies. Our finding of increased ketones during early lactation in cows fed ad libitum during the dry period, compared to animals fed low amounts of energy during the same period, is in accordance with Gardner (1969), Farries (1975), Lodge et al. (1975) and Coenen (1979).
Circulating albumin was comparable in all groups throughout the experiment, indicating that protein supply was adequate (Oldham, Broster, Napper and Siviter, 1979). The transient decrease of AAN at parturition may have been the consequence of amino acid uptake by the mammary gland. Causes of the increase of AAN levels 5 to 10 days after parturition and of the relatively high AAN levels in cows fed an energy-deficient diet during lactation remain to be established.
AAN levels were not markedly affected by differences in energy, intake.
Urea levels were elevated in animals fed energy according to requirements during the dry period, and low amounts of energy during lactation. In our study, differences in the protein content in the food and in tissue protein breakdown probably accounted for the differences seen between the experimental groups.
Low IRI in animals fed only according to requirements, compared to animals fed ad libitum, was associated with a reduced deposition of energy reserves and, as a consequence, comparatively high NEFA levels. The marked elevation of IRI levels at parturition was related to the increase of glucose. Interestingly, IRI levels barely decreased after parturition in group B and remained lowest in group C. Thus, IRI mirrored the degree of energy deficit, which agrees with Hove (1974), Schwalm and Schultz (1976), Hart, Bines, Morant and Ridley (1978) and Blum, Frohli, Moses, Thun, Wanner, Jans and Hart (1983b). It is anticipated that the low insulin concentrations after parturition facilitated fat and protein mobilization, resulting in a reduction of body weight, particularly in the deliberately underfed cows.
Some of the variation of GH seen in this study was presumably the consequence of episodic secretion. Significantly higher GH levels were measured during the dry period in animals fed energy restricted to requirements compared to those fed ad libitum. Energy deficiency has repeatedly been shown to be accompanied by a rise in GH (Hove and Blom 1973; Hart et al., 1978;
Blum, Kunz, Schnyder, Thomson, Vitins, Blom and Bickel, 1979; Blum et al, 1983b).
Although GH was higher during lactation than during the dry period, the concentrations were similar in all groups during lactation, despite markedly different energy intakes.
However, single venepuncture may not adequately represent GH concentrations.
The changes in total T4 during the dry period, pregnancy and lactation have recently been described (Blum et al., 1983a). Because free fractions remained constant during the experiment and were similar in the three groups, blood plasma binding capacities were not altered and measurements of total T4
therefore represented changes in the concentration of free T4. In accordance with previous studies (Blum et al, 1979, 1980, 1983a and b), T4 was lowered by marked energy deficiency.
Measurements of total T3 were also representative of changes in free T3, because free T3 fractions did not change during the experiment and were comparable in the three groups. T3 was markedly influenced by energy intake, in accordance with previous studies in steers and sheep (Blum et al., 1979 and 1980). Thus, it was significantly lower in cows fed during the dry period only according to requirements, and, after calving, T3 continued to increase, except in deliberately underfed cows, a response pattern presumably modified by energy intake (Blum et al., 1979, 1980 and 1983b). Goldberg (1980) has shown that low T3 concentrations during energy deficiency in rats reduced protein catabolism, but this remains to be established for lactating cows.
T3 levels showed a marked peak at parturition, a finding not previously reported.
In conclusion, a low compared to a high level of feeding during the dry period led to characteristic changes in the concentration of various hormones and metabolites. Changes in cows fed at a restricted level indicated that tissue deposition was reduced and that fat was being metabolized more intensively. In contrast, changes in ad libitum-fed cows suggested a marked increase in tissue deposition. Circulating metabolites and hormones during lactation indicated that more bodv tissue, especially fat, was mobilized in cows on a high as compared to a low level of feeding during the dry period. Ketonaemia and associated metabolic changes were reduced in early lactation in animals on a restricted diet during the dry period, because fat mobilization was reduced and more energy was provided from the ration. Although restricted feeding during the dry period appears to reduce the incidence of severe acetonaemia, many other factors, especially the level of feeding after parturition, have to be considered. In our study, cows deliberately underfed for the first 2 months of lactation exhibited classical forms of metabolic and endocrine adaptation to energy deficiency.
Despite marked energy deficiency none of them developed clinical ketosis, demonstrating considerable adaptability and indicating that
additional factors are of importance for the development of the disease.
ACKNOWLEDGEMENTS
This work has been supported by a special fund of the Swiss Federal Institute of Technology (Project No.
2097/41) and is part of the fulfilment of the requirements for Dr.sc.techn. (Thesis ETH 6992, 1982). We thank Prof. H. Heusser, Drs H. Leuenberger and H. Roth for their support and valuable suggestions. The technical assistance of Mrs B. Bacher and M. Gatzi, of Mr W.
Moses, Mr A. Schmidlin and Mr Simmonds is gratefully acknowledged.
REFERENCES
B A I R D , G. D . , HEITZMAN, R. J., HIBBIT, K. G. and
HUNTER, G. D . 1974. Bovine ketosis: a review with recommendations for control and treatment. Br. vet. J.
130: 214-220 and 318-326.
BICKERSTAFFE, R., ANNISON, E. F. and LINZELL, J. L.
1974. The metabolism of glucose, acetate, lipids and amino acids in lactating dairy cows. J. agric. Sci., Camb. 82: 71-85.
BLUM, J. W., FROHLI, D . , MOSES, W., THUN, R., WANNER, M., JANS, F . and H A R T , I. C. 1983b.
Changes of hormones and metabolites during a 24-hour cycle in lactating cows fed different amounts of energy.
Proc. 5th int. Conf. Production Disease in Farm Animals, Swedish Univ. Agr. Sci., Uppsala, pp. 158-
161.
B L U M , J. W., GINGINS, M., VITINS, P. and BICKEL, H.
1980. Thyroid hormone levels related to energy and nitrogen balance during weight loss and regain in adult sheep. Ada endocr., Copnh. 93: 440-447.
BLUM, J. W., K U N Z , P., BACHMANN, C. and COLOMBO,
J. P. 1981. Metabolic effects of fasting in steers. Res.
vet. Sci. 31: 127-129.
BLUM, J. W., K U N Z , P. and FROHLI, D. 1982. Effects of
catecholamines on plasma free fatty acids levels in fed and fasted steers. Endocrinology 110: 452-456.
BLUM, J. W., KUNZ, P., LEUENBERGER, H., GAUTSCHI,
K. and KELLER, M. 1983a. Thyroid hormones, blood plasma metabolites and haematological parameters in relationship to milk yield in dairy cows. Anim. Prod.
36: 93-104.
B L U M , J. W., K U N Z . , P., SCHNYDER, W., THOMSON, E. F . , VITINS, P., BLOM, A. and BICKEL, H. 1979.
Changes of hormones and metabolites during reduced and compensatory growth of steers. Annls Rech. Vet.
10: 391-392.
CHASEN, S. 1977. Biomedical Computer Programs BMDP 3 S, Non Parametric Statistics, pp. 605-617. Univ.
California, Los Angeles.
COENEN, M. 1979. [Influence of energy intake before and after parturition on milk yield, milk composition and on selected blood parameters in medium and high yielding dairy cows.] Thesis Vet. Med., School of Veterinary Medicine, Hannover.
DAVENPORT, D . G. and RAKES, A. H. 1969. Effects of
prepartum feeding level and body condition on the postpartum performance of dairy cows. J. Dairy Sci.
52: 1037-1043.
EMERY, R. S., HAFS, H. D., ARMSTRONG, D. and
SNYDER, W. W. 1969. Prepartum grain feeding effects on milk production, mammary edema, and incidence of diseases. J. Dairy Sci. 52: 345-351.
FARRIES, E. 1975. [Studies on effects of energy intake during the dry periods in dairy cows.] Tierziichter 27:
476-480.
GARDNER, R. W. 1969. Interactions of energy levels offered to Holstein cows prepartum and postpartum. I.
Production responses and blood composition changes.
/. Dairy Sci. 52: 1973-1984.
GARDNER, R. W. and PARK, P. L. 1973. Effects of
prepartum energy intake and calcium to phosphorus rations on lactation response and parturient paresis. J.
Dairy Sci. 56: 385-389.
GARNSWORTHY, P. C. and TOPPS, J. H. 1982. The effect
of body condition of dairy cows at calving on their food intake and performance when given complete diets. Anim. Prod. 35: 113-119.
GOLDBERG, A. L. 1980. The regulation of protein turnover by endocrine and nutritional factors. In Plasticity of Muscle (ed. D. Pette), pp. 469-492. W. de Gruyter, Berlin.
HART, I. C , BINES, J. A., MORANT, S. V. and RIDLEY,
J. L. 1978. Endocrine control of energy metabolism in the cow: comparison of levels of hormones (prolactin, growth hormone, insulin and thyroxine) and metabolites in the plasma of high- and low-yielding cattle at various stages of lactation. J. Endocr. 77: 333- 345.
HART, I. C , FLUX, D. S., ANDREWS, P. and MCNEILLY,
A. S. 1975. Radio-immunoassay for ovine and caprine growth hormone: its application to the measurement of basal circulating levels of growth hormone in the goat.
Hormone Metab. Res. 7: 35-40.
HERNANDEZ-URDANETA, A., COPPOCK, C. E., MCDOWELL, R. E., GIANOLA, D. and SMITH, N. E.
1976. Changes in forage-concentrate ratio of complete feeds for dairy cows. J. Dairy Sci. 59: 695- 707.
HOVE, K. 1974. Nocturnal plasma insulin levels in cows with varying levels of plasma sugar and aceto-acetate.
Ada endocr., Copnh. 76: 513-524.
HOVE, K. and BLOM, A. K. 1973. Plasma insulin and growth hormone in dairy cows; diurnal variations and relation to food intake and plasma sugar and aceto- acetate levels. Ada endocr., Copnh. 73: 289-303.
KROHN, C. C , HVELPLUND, T. and ANDERSEN, P. E.
1983. The effect on performance of different energy concentrations in complete rations for first lactation cows before and after calving. Livest. Prod. Sci. 10:
223-237.
KRUSKAL, W. H. and WALLIS, W. A. 1952. Use of
ranks in one-criterion variance analysis. /. Am. statist.
Ass. 47: 583-621.
LAND, CAROLYN and LEAVER, J. D. 1981. The effect of
body condition at calving on the production of Friesian cows and heifers. Anim. Prod. 32: 362-363 (Abstr.).
LODGE, G. A., FISHER, L. J. and LESSARD, J. R. 1975.
Influence of prepartum feed intake on performance of cows fed ad libitum during lactation. J. Dairy Sci. 58:
696-702.
MORROW, D. A. 1976. Fat cow syndrome. /. Dairy Sci.
59: 1625-1629.
OLDHAM, J. D., BROSTER, W. H., NAPPER, D. J. and
SIVITER, J. W. 1979. The effect of a low-protein ration on milk yield and plasma metabolites in Friesian heifers during early lactation. Br. J. Nutr. 42: 149-162.
RADLOFF, H. D. and SCHULTZ, L. H. 1967. Blood and
rumen changes in cows in early stages of ketosis. J.
Dairy Sci. 50: 68-72.
SCHWALM, J. W. and SCHULTZ, L. H. 1976. Relationship
of insulin concentration to blood metabolites in the dairy cow. J. Dairy Sci. 59: 255-261.
SEIDEL, H., PUFE, M., MUELLER, I., GRUEN, E., KOLB,
E. and SCHUHMACHER, U. 1973. [Changes of some biochemical and physiological parameters around parturition in dairy cows.] Arch. exp. Vet Med. 27:
589-600.
STOBER, M. and DIRKSEN, G. 1982. [The lipid
mobilisation-syndrome (fat cow syndrome) in dairy cows.] Praktische Tierarzt 63: 79-88.
(Received 5 April 1984 — Accepted 13 August 1984)