Correlations between Milk and Plasma Levels of Amino and Carboxylic Acids in Dairy Cows
Matthias S. Klein,
†,#Martin F. Almstetter,
†,§,#Nadine Nürnberger,
†Gregor Sigl,
‡,∥Wolfram Gronwald,
†Steffi Wiedemann,
‡,⊥Katja Dettmer,
†,* and Peter J. Oefner
††Institute of Functional Genomics, University of Regensburg, Regensburg, Germany
‡Physiology Weihenstephan, Technische Universität München, Freising, Germany
*S Supporting Information
ABSTRACT: The objective of this study was to investigate the relationship between the concentrations of 19 amino acids, glucose, and seven carboxylic acids in the blood and milk of dairy cows and their correlations with established markers of ketosis. To that end, blood plasma and milk specimens were collected throughout lactation in two breeds of dairy cows of different milk yield. Plasma concentrations of glucose, pyruvate, lactate,α-aminobutyrate,β-hydroxybutyrate (BHBA), and most amino acids, except for glutamate and aspartate, were on average 9.9-fold higher than their respective milk levels. In contrast, glutamate, aspartate, and the Krebs cycle intermediates succinate, fumarate, malate, and citrate were on average 9.1-fold higher in milk than in plasma. For most metabolites, with the exception of BHBA and threonine, no significant correlations were observed between their levels in plasma and milk. Additionally, milk levels of acetone showed significant direct relationships with the glycine-to-
alanine ratio and the BHBA concentration in plasma. The marked decline in plasma concentrations of glucose, pyruvate, lactate, and alanine in cows with plasma BHBA levels above the diagnostic cutoffpoint for subclinical ketosis suggests that these animals fail to meet their glucose demand and, as a consequence, rely increasingly on ketone bodies as a source of energy. The concomitant increase in plasma glycine may reflect not only the excessive depletion of protein reserves but also a potential deficiency of vitamin B6.
KEYWORDS: metabolomics, gas chromatography−mass spectrometry, plasma, milk, dairy cows
■
INTRODUCTIONDuring early lactation, calories expended by high-yielding dairy cows for milk production exceed those available from feed intake, thus resulting in a negative energy balance (NEB).1 NEB is characterized by mobilization of body fat, protein, and mineral stores to satisfy the requirements for milk production.
Dairy cows that do not cope well with NEB may develop ketosis, which can affect milk production and reproduction.2 The magnitude of metabolic stress during early lactation depends on many factors.3Feeding regime is critical, but the large variation in metabolic status observed among animals of similar productivity consuming the same diet points to individually varying predispositions.4,5 Knowledge of the metabolic adaptation of individual animals to the challenge of lactation and failure to do so is of great relevance to the breeding and welfare of dairy cows.6
Subclinical ketosis in dairy cows occurs typically in early lactation and coincides with peak milk production. It is characterized by supraphysiological levels of ketone bodies in tissues and body fluids that exceed physiological increases in response to the requirement of the mammary gland for acetate and β-hydroxybutyrate (BHBA) for de novo fatty acid synthesis.7 Blood BHBA concentration is the most commonly used marker for the detection of ketosis.8 Threshold blood
BHBA concentrations suggested for the discrimination between healthy cows and animals with subclinical ketosis range between 1.0 and 1.4 mmol/L.9−11Blood collection, however, is an invasive procedure and difficult to perform on a regular basis. Milk, in contrast, is a readily available biofluid, and the introduction of dipstick assays for the semiquantitative determination of BHBA and acetoacetate in milk has made cow-side testing for ketosis feasible.12Elevated milk BHBA and acetoacetate are accepted biomarkers for the detection of acute ketosis. More recently, the milk glycerophosphocholine to phosphocholine ratio in thefirst month of lactation has shown promise as a prognostic marker in assessing risk of developing ketosis, thereby enabling early intervention in cows susceptible to disease and selection of metabolically stable animals for breeding purposes.13
A further advantage of milk in assessing metabolic status is the lower susceptibility of milk metabolite concentrations to endogenously and exogenously driven oscillations. For example, the blood concentrations of both BHBA and urea
Special Issue: Agricultural and Environmental Proteomics Received: July 1, 2013
Published: August 9, 2013
pubs.acs.org/jpr
increase after feeding.14−17 Such and other diurnal variation may also, at least in part, explain conflicting reports on the relationship between concentrations of ketone bodies and other metabolites in blood and milk. Generally, molar ratios and correlation coefficients close to 1 have been reported for blood and milk acetone.11In contrast, varying molar ratios and correlation coefficients between blood and milk BHBA and acetoacetate have been reported, which may also depend on the breed’s usage of BHBA for fatty acid synthesis and conversion of acetoacetate to butyrate.11,12,18 A recent untargeted mass spectrometry-based study offive Holstein cows found overall little correlation between global blood and milk metabolomes, albeit there were a few exceptions of which only creatinine could be identified.19Maher et al., on the other hand, detected several significant correlations between milk and blood metabolites, including trimethylamine, dimethylsulfone, valine, fumarate, trimethylamine-N-oxide, and glycerophosphocholine, in a proton magnetic resonance spectroscopy (NMR)-based study of 54 Holstein cows.20
The present study builds on our recent analysis of different milk metabolites by high-resolution NMR and gas chromatography− mass spectrometry (GC−MS) in two different breeds of dairy cows, namely, Brown Swiss and Simmental, during early and late lactation.21Here, 27 metabolites that had been detected in milk by GC−MS were analyzed in blood plasma, and their levels were correlated to those previously determined in milk collected at the same time. Albeit not thefirst study of its kind, it exceeds previous investigations on relationships between concentrations of metabolites in blood and milk with regard to either the number of animals and/or the number of metabolites studied and extends them beyond thefirst few weeks of lactation.11,19,20,22
Thefindings reported here increase our understanding of the metabolic changes that dairy cows undergo during lactation and their possible association with the development of postpartum ketosis.
■
EXPERIMENTAL SECTION Collection of Blood and Milk SamplesSamples were collected at two research farms near Munich, Germany, from cows with high genetic merit representing different milk production levels. Cows were kept in loose housing and fed a partial mixed ration based on corn and grass silagead libitum. Concentrates were fed additionally according to milk yield. At the research farm Veitshof (Freising, Germany) specimens were collected from high producing multiparous Brown Swiss cows with a lactational milk yield (305 d) of 9,200 kg. Cows were in early, mid, or late lactation, with days in milk (DIM) of (mean±standard deviation) 44± 27 (N = 28), 143± 22 (N = 7), and 347 ± 175 (N = 18), respectively. At the Bavarian State Research Center for Agriculture (Grub, Germany), specimens were obtained from multiparous Simmental cows with a lactational milk yield (305 d) of 8,300 kg. Cows were in early and late lactation with DIM of 22±11 (N= 14) and 256±49 (N= 13), respectively.
Supplemental Figure S1 shows the number of specimens collected from the two breeds with respect to DIM. All cows were milked twice daily, and morning milk was collected for further analysis. Venous blood was obtained at 7:00 a.m. from the Vena jugularis into EDTA-coated vacuum tubes for the Simmental cows or into sodium fluoride (NaF)-containing tubes for the Brown Swiss cows. The plasma was centrifuged immediately after sampling at 4°C for 15 min at 2000×gand stored frozen until analysis.
GC−qMS of Amino Acids
Plasma levels of 17 proteinogenic amino acids (aa) as well as those of ornithine and α-aminobutyric acid (AABA) were determined in 20-μL aliquots of plasma by means of a fully automated quantitative GC−qMS method employing propyl chloroformate derivatization and stable isotope-labeled amino acids as internal standards.23 As reported previously, thermal instability of the propylformate derivatives of arginine and cysteine precluded their measurement, while interaction of the free hydroxyl group of serine with the GC liner rendered its quantitation unreliable.23
GC−MS ofβ-Hydroxybutyrate, Glucose, and Citrate Cycle Intermediates
Quantitative analysis of BHBA, glucose, pyruvate, lactate, and intermediates of the citrate cycle was performed in 10-μL aliquots of plasma that were subjected to online methoximation/
silylation in the presence of stable isotope-labeled internal standards and GC−MS on a Pegasus GC−electron ionization (EI)−time- of-flight (TOF)−MS instrument (Leco, St. Joseph, MI, USA) as described previously.21
Limits of Quantification
The lower limit of quantification (LLOQ) was defined individually for each metabolite as the lowest point of the calibration curve that still yielded an accuracy of 80−120%.
This is in agreement with the FDA guide for bioanalytical method validation.24The LLOQs of the AAs and the remaining analytes were determined for injection volumes of 20 and 10μL, respectively.
Statistics
To analyze correlations between all available pairs of milk and blood metabolites in specimens collected at the same time, Pearson correlation coefficients and corresponding P-values were calculated using the statistical analysis tool R version 2.11.1 based on a two-tailed test. Resulting P-values were corrected for multiple testing by controlling the false discovery rate (FDR) according to the method of Benjamini and Hochberg at the 10% level.25 In the analysis of correlations one can distinguish two cases:directandindirectcorrelations. If one variable is directly influenced by another one, for example, if a compound is a direct product of another compound in a metabolic reaction, this is called a direct correlation. Indirect correlationsarise when two variables are directly correlated to a third variable, but not to each other. In this case the two variables will also show a high correlation coefficient due to their shared connection to the third variable. To analyze only direct correlations and to exclude indirect correlations, partial correlation analyses were carried out based on a method proposed by de la Fuente et al.26 A partial correlation coefficient quantifies the correlation between two variables when conditioning one (first order) or several other variables (second or higher order). Partial correlation coefficients were calculated using the R function pcor.test available at http://
www.yilab.gatech.edu/pcor.html.27 Each significant correlation where the corresponding metabolites showed a significant correlation to at least one additional metabolite was recalculated using first order partial correlation. Calculations of second (or higher) order partial correlations were not performed due to the limited number of samples and the limited interconnection of the quantified metabolites. If a partial correlation yielded an insignificant result according to the significance level from the FDR calculation, the correlation
Table1.PlasmaandMilkMetaboliteLevelsa concentrations[μmol/L]b plasmamilk BrownSwissSimmentalBrownSwissSimmental metaboliteLLOQ [μmol/L]earlymidlatechangeearly vslateearlylatechangeearly vslateearlymidlatechangeearly vslateearlylatechangeearly vslate AABA0.7524.8±10.8 (28)26.3±14.7(7)18.4±6.9 (17)−25.9%12.7±3.8 (14)8.2±3.0(13)−34.9%4.2±1.5(28)3.3±0.7(7)2.9±0.8(18)−31.2%4.2±1.9(14)2.2±0.8(13)−48.5% Ala0.75171.9±47.4 (28)207.0±30.0(7)220.2±47.0 (17)+28.1%182.2±30.1 (14)198.4±32.8 (13)+8.8%31.8±13.4 (28)34.1±11.5(7)44.4±13.7 (18)+39.7%49.4±19.3 (14)39.9±11.4 (13)−19.2% Asn3035.7±8.8(28)39.1±5.2(7)35.4±6.5 (17)−0.8%38±6.5(14)38.6±4.1(13)+1.5%b.l.b.l.b.l.n.d.b.l.b.l.n.d. aspartate7.54.9±1.1(28)5.5±0.6(7)5.6±1.1(17)+14.8%9.8±2.7(14)9.9±2.2(13)+1.4%22.9±9.0(28)30.6±11.3(7)18.6±7.1(18)−18.7%38.2±17.7 (14)29.7±21.7 (13)−22.2% BHBAc4.88905.3±528 (28)680.9±153(7)588.0±224.6 (18)−35.0%517.6±150.2 (14)635.9±243.7 (13)+22.8%101.1±84.3 (28)74.4±54.5(7)113.6±107.3 (18)+12.3%25.2±5.9 (13)39.3±13.4 (12)+56.0% citratec [mmol/L]0.0050.3±0.1(28)0.3±0.1(7)0.2±0.1(18)−15.8%0.2±0.1(14)0.2±0.04(13)+0.1%7.0±1.3(28)6.8±0.9(7)6.1±1.1(18)−12.1%5.8±1.3(13)5.6±1.2(12)−2.6% fumaratec2.4412.5±5.9(8)b.l.9.8±2.1(9)−21.8%5.0(1)14.0(1)n.d.d29.9±18.5 (28)27.4±11.5(7)27.4±8.4(18)−8.4%20.6±6.7 (12)14.5±6.7 (11)−29.8% glucosec [mmol/L]0.0052.5±0.4(28)2.8±0.1(7)2.9±0.3(18)+14.5%2.5±0.2(14)2.5±0.2(13)+1.3%0.2±0.1(28)0.3±0.1(7)0.3±0.1(18)+35.6%0.3±0.1(13)0.3±0.2(12)+17.5% Glu7.542.0±9.2(28)48.4±7.8(7)54.4±25.8 (17)+29.4%70.6±19.5 (14)75.1±18.0 (13)+6.4%282.7±120.5 (28)409.0±130.0 (7)257.8±91.9 (18)−8.8%385±152.3 (14)320.6±131.2 (13)−16.7% Gln75207.5±46.3 (27)219.7±45.6(7)237.9±43.1 (17)+14.7%201.9±39.2 (14)209.0±44.3 (13)+3.5%b.l.b.l.b.l.n.d.b.l.b.l.n.d. Gly7.5577.1±172.2 (28)340.7±74.2(7)331.1±85.8 (17)−42.6%394.2±106 (14)284.2±43(13)−27.9%221.4±206.7 (28)77.1±36.7(7)97.6±44.1 (18)−55.9%230.5±177 (14)92.6±58.7 (13)−59.8% His3039.5±11.5 (28)39.3±19.7(7)45.3±18.2 (17)+14.8%45.8±14.5 (14)35.0±13.1 (13)−23.6%33.5(1)b.l.b.l.n.d.b.l.b.l.n.d. Ile2.2582.8±16.9 (28)83.1±20.4(7)88.3±16.3 (17)+6.7%80.3±23(14)85.5±10.5 (13)+6.5%4.8±1.7(28)5.7±1.5(7)6.1±2.4(18)+27.0%4.2±1.6(14)4.1±1.2(13)−2.2% lactatec2.44418.7±102.9 (28)728.0±313.2(7)585.5±165.7 (18)+39.8%612.9±290.5 (14)928.8±386.9 (13)+51.5%39.9±29.7 (27)32.3±14.0(7)85.7±72.2 (18)+115.1%27.7±22.7 (13)574±1171.4 (12)+1972.8% Leu0.7586.8±17.6 (28)94.9±24.5(7)101.2±21.7 (17)+16.7%78.6±23.5 (14)86.9±17.1 (13)+10.6%5.3±1.7(28)6.5±1.6(7)7.7±3.9(18)+45.5%4.4±1.8(14)5.7±1.6(13)+27.5% Lys2.2560.8±15.5 (28)67.0±18.5(7)69.5±13.8 (17)+14.3%65±16.7(14)68.3±12(13)+5.0%13.0±5.2(28)15.1±5.2(7)30.7±13.2 (18)+135.4%14.7±4.2 (14)27.2±23.7 (13)+85.1% malatec4.8813.3±9.3(28)8.3±1.0(7)14.0±6.7 (18)+5.7%10.1±2.1 (14)10.8±7.1(13)+7.7%190.8±79.5 (28)205.9±64.1 (7)205.3±60.4 (18)+7.6%100.8±44.3 (13)113.3±53.4 (12)+12.4% Met7.516.1±4.5(28)18.9±3.3(7)18.8±3.7 (17)+16.9%18.5±3.7 (14)20.1±1.8(13)+8.6%b.l.b.l.b.l.n.d.b.l.b.l.n.d. ornithine2.2528.3±10.9 (28)41.5±14.8(7)40.8±10.4 (17)+44.5%30.5±10.3 (14)37.4±9.6(13)+22.6%3.9±1.3(28)4.0±1.3(7)3.5±0.8(18)−12.5%6.7±1.4(14)5.4±1.9(13)−18.6% Phe2.2542.5±7.4(28)42.9±4.7(7)43.4±8.4 (17)+2.1%38.4±8.7 (14)41.9±5.1(13)+8.9%3.3±1.1(28)3.3±0.3(7)4.2±1.8(18)+25.1%3.2±1.1(14)3.4±0.8(13)+5.9% Pro0.7566.0±14.8 (28)69.2±5.1(7)68.3±15.3 (17)+3.4%69.1±11.5 (14)67.9±11.7 (13)−1.8%24.8±8.7(28)19.2±5.6(7)26.9±7.2(18)+8.8%29.0±9.5 (14)23.6±6.4 (13)−18.6% pyruvatec4.8835.9±13.1 (28)39.6±8.4(7)48.1±9.4 (18)+33.8%13.0±5.7(2)12.0±6.1(3)−7.7%12.3±5.9(27)19.0±4.1(7)13.0±9.9(18)+5.7%15.2±7.4 (13)24.3±29.3 (12)+60.6% succinatec9.7635.6±11.7 (28)19.3±1.1(7)28.7±8.9 (18)−19.4%23.1±8.4 (14)19.4±5.6(13)−16.0%48.8±18.8 (28)36.7±13.7(7)32.6±16.2 (18)−33.2%61.4±21.4 (13)57.4±11.1 (12)−6.5%
was termed insignificant. A large number of highly correlated pairs did not reach the significance level after correction for indirect correlations, indicating that these pairs are not directly correlated. Please note that metabolites correlating due to indirect connections via unknown or not-measured metabolites cannot be identified and, thus, are deemed as directly connected. Interactions that remained significant after calcu- lation of partial correlations were marked in red and green for negative correlation and positive correlation, respectively, in Tables 2 and 3. The values given in these tables are the (zero- order) Pearson correlation coefficients.
Two-tailed t tests with unequal variance were used to determine significant differences between the breeds or lactation thirds, assuming a significance level ofP< 0.05.
■
RESULTS AND DISCUSSIONChanges in Plasma Metabolites Throughout Lactation A total of 27 metabolites, including 19 amino acids, glucose, and seven carboxylic acids, were quantified in jugular blood specimens collected from 80 dairy cows. The LLOQs and mean concentrations for the different breeds and lactation thirds for each metabolite are listed in Table 1. The table also lists the corresponding, previously determined levels of the 27 metabolites in milk, while Supplemental Table S1 gives the concentrations of seven additional metabolites measured by NMR in milk only.21
The majority of metabolites could be detected above their respective LLOQs in all blood specimens. Exceptions were asparagine, aspartate, fumarate, glutamine, histidine, methio- nine, pyruvate, and threonine (Table 1). A comparison of analyte concentrations between plasma and milk reveals that glucose, pyruvate, lactate, AABA, BHBA, and most amino acids, except for glutamate and aspartate, were on average 9.9-fold (median 6.98) higher in plasma than in milk, while the milk levels of glutamate, aspartate, and the Krebs cycle intermediates succinate, fumarate, malate, and citrate were on average 9.1-fold (median 4.78) higher than their respective plasma levels. The differences in concentration between blood and milk were particularly pronounced for the branched-chain amino acids isoleucine, leucine, and valine, as well as the aromatic amino acids phenylalanine, tyrosine, and tryptophan, the plasma concentrations of which were on average 18.7-fold (median 14.68) higher than their respective concentrations in milk. The marked differences in plasma and milk concentrations of these amino acids reflect their extensive utilization by the mammary gland upon extraction from the blood for milk protein synthesis and generation of gluconeogenic and ketogenic precursors.28 The concentration of citrate, on the other hand, was about 24-fold higher in milk than in plasma and varied little over the course of lactation in both breeds. As mammary epithelium is impermeable to citrate in both directions, milk citrate levels reflect mammary rather than general metabolism.29Milk citrate is believed to be one of the main buffer systems of milk, to regulate the equilibrium between Ca2+and H+ions, to maintain fluidity of milk through its effects on the structure of casein micelles, and to provide reducing equivalents in the form of NADPH for de novo synthesis of fatty acids via the NADP- linked isocitrate dehydrogenase, the activity of which has been reported to increase 5-fold upon initiation of lactation.7,30 In contrast, little is known about the functional significance of malate, whose concentrations in milk as compared to plasma were on average about 18- and 10-fold higher in Brown Swiss
concentrations[μmol/L]b plasmamilk BrownSwissSimmentalBrownSwissSimmental metaboliteLLOQ [μmol/L]earlymidlatechangeearly vslateearlylatechangeearly vslateearlymidlatechangeearly vslateearlylatechangeearly vslate Thr0.7579.7±38.2 (28)73.7±20.7(7)93.5±39.3 (16)+17.2%80.7±21.2 (14)77.5±20.0 (13)−3.9%16.4±12.6 (28)8.3±4.6(7)23.0±16.6 (18)+40.0%14.4±5.7 (14)10.5±3.7 (13)−26.6% Trp0.7537.3±8.3(28)39.7±4.0(7)47.0±11.2 (17)+25.8%31.6±4.6 (14)37.5±6.6(13)+18.8%2.1±0.6(28)2.2±0.6(7)3.2±1.1(18)+49.2%2.0±0.4(14)3.2±0.8(13)+62.1% Tyr2.2537.0±13.2 (28)46.6±13.2(7)46.0±8.8 (17)+24.1%32.9±10.7 (14)41.4±7.1(13)+25.8%4.1±1.2(3)3.1(1)5.8±2.6(9)+29.3%b.l.2.6(1)n.d. Val0.75152.7±32.3 (28)168.5±45.4(7)177.6±40.0 (17)+16.3%165.3±46.7 (14)162.4±32.6 (13)−1.7%11.5±4.5(28)10.9±2.5(7)14.5±4.2(18)+26.4%12.3±4.2 (14)11.8±2.9 (13)−4.7% a Lowerlimitsofquantification(LLOQ)andmeanconcentrationsfordifferentbreedsandlactationstagesaregiven.Numberofsamplesisgiveninparentheses.Milkmetabolitelevelsareadaptedfrom anearlierstudy.21 .Abbreviations:n.d.,notdetermined;b.l.,belowlowerlimitofquantification.b Givenaremeans±standarddeviationandthenumberofvaluesaboveLLOQinparentheses.c LLOQ wascalculatedforasamplevolumeof10μLandfortheremaininganalytesusingasamplevolumeof20μL.d Notdeterminedforfumaratebecauseofthelownumberofvaluesavailable.
Table1.Continued
and Simmental cows, respectively. One may speculate that the relatively high concentration of malate in milk reflects an increased activity of the citrate-malate shuttle in the mammary gland, which transports acetyl-CoA from the mitochondrial matrix into the cytosol, thereby providing acetate units for fatty acid synthesis. Further contributing to the production and subsequent secretion of malate into milk may be the reported absence of NAPD-linked malic enzyme activity, which catalyzes the decarboxylation of malate to pyruvate, in the mammary gland in early lactation.30
Of the plasma metabolites, glycine showed the most striking changes in concentration over the course of lactation.
Compared to late lactation, its levels were significantly increased in both Brown Swiss (P= 1.2×10⁻⁷) and Simmental cows (P= 0.0023) during early lactation (Table 1, Figure 1).
Subsequently, plasma glycine levels dropped about 40% and 30%, respectively, in the two breeds. In early lactation, Brown Swiss cows showed about 45% higher plasma glycine levels than Simmental cows. Elevated levels of glycine during early lactation were also observed in milk, with even more pronounced decreases of about 60% as lactation progressed.
In contrast to plasma, however, absolute concentrations of
glycine in milk were about the same for both breeds. Early postpartum peaks in plasma concentrations of glycine as well as serine had been reported previously.31−33Increases in plasma levels of glycine were also observed to be greater in high- compared with low-yielding cows and were accompanied by decreases in branched-chain amino acids, which was also the case here.31Further, energy and protein content of the rations fed exerted significant effects on the rise in plasma glycine levels.31,32It has been suggested that increased levels of plasma glycine in early lactation might be an indicator of muscle protein mobilization to meet the high nutrient demand in early lactation.33 Shibano et al. suggested the measurement of the glycine-to-alanine (Gly/Ala) ratio in serum as a potential marker for evaluating the nutritional status of peri-parturient dairy cows.34The ratios are shown in Figure 2. High ratios were observed for the high-yielding Brown Swiss cows during early lactation, while lower values were observed for the Simmental cows. An alternative explanation that would account for both the observed increases in glycine and serine as well as the observed decreases in alanine, isoleucine, leucine, and valine in early lactation might be a deficiency of pyridoxal 5′-phosphate, the metabolically active form of vitamin B6.35 Pyridoxal Figure 2.Plasma glycine-to-alanine ratios as a measure for the nutritional status throughout lactation for two breeds. The highly productive Brown Swiss cows show elevated levels in early lactation.
Figure 1.Plasma glycine concentrations versus days in milk for two breeds. The highly productive Brown Swiss cows show elevated levels in early lactation.
5′-phosphate is a critical coenzyme in a variety of enzymatic reactions that include among others the transamination of glucogenic amino acids, glycine decarboxylation through the glycine cleavage system, and glycine-serine transformation by serine hydroxymethyltransferase.36Dietary supply and ruminal synthesis of vitamin B6 are believed to be sufficient in most situations to prevent clinical deficiencies. However, one cannot
exclude entirely the possibility that cows coping poorly with the metabolic challenges of early lactation lack sufficient amounts of vitamin B6 to sustain the multitude of pyridoxal 5′-phosphate-dependent adaptations of glucose, amino acid, and fatty acid metabolism during the periparturient period.37
Plasma concentrations of alanine in Brown Swiss cows were significantly decreased in early lactation as compared to the last Figure 3.Plasmaβ-hydroxybutyrate concentrations versus days in milk for two breeds. Some of the highly productive Brown Swiss cows show elevated levels above the cutoffpoint of 1.4 mmol/L for the detection of subclinical ketosis in early lactation.
Table 2. Partial Pearson Correlations of Plasma Metabolite Levels and Metadata for Early Lactationa
aSignificant correlations with a false discovery rate of 10% are marked in red and green for negative and positive correlations, respectively. The number of value pairs used for calculation is given in parentheses. For better visibility rows and columns without significant correlations were omitted.
third of lactation (P = 0.002), but no significant differences were observed for Simmental cows. Declines in concentrations of amino acids in blood have been generally attributed to their increased extraction by the mammary gland with the onset of lactation to meet amino acid requirements not only for milk protein synthesis but also the marked increases in protein mass of the mammary gland and splanchnic tissues.38 Further, compared to metabolic activities before parturition, there is an immediate postpartum increase in the capacity of the liver to convert alanine to glucose to meet the sharply increased demand of glucose, which exceeds its supply from digestible energy intake in the form of proprionate.39−41 As the lower levels of alanine are accompanied by lower levels of glucose, one may speculate that a shortage of alanine as well as glutamine, which contribute the most to gluconeogenesis in lactating cows, limits gluconeogenesis and, thus, may contribute to the increased formation of ketone bodies from nonesterified fatty acids and the ketogenic amino acids leucine and lysine, whose plasma levels were also markedly reduced.40However, there is plenty of evidence that the decline in alanine is rather a consequence of the reduced availability of carbon from glucose- derived pyruvate rather than amino acids as the source of the
pyruvate carbon of alanine.42The reduced levels of pyruvate and lactate in plasma specimens from high-yielding Brown Swiss cows collected in the first third of lactation further support the notion of insufficient generation of pyruvate carbon from glucose for the replenishment of alanine reserves in skeletal muscle.
The most abundant metabolite in plasma aside from glucose was BHBA, which was detected over a concentration range of 0.191−2.419 mmol/L. It is apparent that blood BHBA levels were generally higher than milk BHBA levels, which did not exceed a maximum level of 0.531 mmol/L. BHBA values above 1 mmol/L were detected in 11 plasma specimens, and the threshold concentration for subclinical ketosis of 1.4 mmol/L11 was exceeded infive plasma specimens collected from Brown Swiss cows during the first third of lactation (Figure 3). In Brown Swiss cows, BHBA levels decreased over the course of lactation. However, large differences in BHBA levels were apparent for individual cows during early lactation, indicating that different animals of the same breed coped differently with the metabolic stress of early lactation. Brown Swiss cows showed significantly increased BHBA concentrations in thefirst compared to the last third of lactation (P= 0.0077), while this was not the case for the less productive Simmental cows, where BHBA concentrations were generally lower. There was no significant difference in plasma BHBA between Simmental and Brown Swiss cows during late lactation.
Other plasma metabolites, the concentrations of which were increased during early lactation, were AABA and succinate.
Elevated plasma levels of AABA during the first month of lactation have been reported previously.43Elevated AABA levels are also observed in milk, as already reported previously.21 Increased plasma levels of succinate, on the other hand, reflect most likely higher rates of glutaminolysis in early lactatation, resulting mainly in the generation of ammonia, alanine, aspartate, glutamate, and CO2 based on tracer studies with [U−14C]glutamine.44Alanine, in turn, is utilized as a glucogenic precursor for hepatic glucose production.
The relative contribution of alanine, as well as that of lactate and glyercol, to hepatic gluconeogenesis has been reported to be increased in the early postportal period, whereas that of proprionate, which is derived from ruminal microbial fermentation of ingested Table 3. Partial Pearson Correlations between Plasma and Milk Metabolites in Early Lactationa
aSignificant correlations with a false discovery rate of 10% are marked in red and green for negative and positive correlations, respectively.
Metabolites measured by NMR are marked by an asterisk. The number of value pairs used for calculation is given in parentheses. For better visibility rows and columns without significant correlations were omitted.
Figure 4. Network of significantly correlated plasma metabolites.
Positive correlations are shown as solid lines, and negative correlations as dotted lines. Note that this network is simply a visualization of Table 2 and does not represent a metabolic pathway network reconstruction, nor does it imply causal connections.
fiber carbohydrates and serves as the major substrate of gluconeogenesis in dairy cows, is slightly decreased.45
Correlation Analysis
Partial correlations were calculated as described in the Statistics section for all plasma metabolites and metadata of both breeds for early lactation and are shown in Table 2. Significant positive and negative correlations (FDR = 10%) are marked in green and red, respectively. For better visibility, Table 2 was reduced by excluding rows and columns that did not contain any significant correlations.
For the full table see Supplemental Table S2. Figure 4 shows a visualization of the observed correlations as a correlation network.
Plasma levels of glycine correlated significantly with those of succinate. The plasma Gly/Ala ratio is significantly correlated to plasma BHBA levels. In contrast, BHBA does not correlate significantly to glycine or alanine alone, underscoring the higher content of information about nutritional status given by the Gly/Ala ratio as compared to the raw concentration values.
Further, plasma BHBA showed a significant negative correlation to plasma glucose in concordance with the expectation of increased ketogenesis when glucose demand exceeds glucose supply.
No significant correlation between plasma AABA and plasma glycine was found, in contrast to the correlation of milk AABA to milk glycine observed in our previous study.21 Significant correlations were observed between the branched-chain AA (BCAA) isoleucine, leucine, and valine in plasma. Mammary cells catabolize BCAA to generate organic acids including α-ketoglutarate and oxaloacetate, which are transaminated to glutamate and aspartate.46 Consistently, most organic acids including glutamic acid and aspartic acid show elevated levels in milk as compared to blood plasma. It is known that these amino acids are of great importance for neonatal health, growth and development.47
Correlations between Plasma and Milk Metabolites An important objective of this study was the correlation of plasma metabolites with previously measured milk metabo- lites.21 FDR-corrected partial correlation coefficients were calculated for specimens from thefirst lactation third of both breeds, including plasma metabolite levels, plasma Gly/Ala ratio, metadata (milk fat, milk protein, milk fat-to-protein ratio and milk somatic cell count), 33 milk metabolites, and the milk glycerophosphocholine-to-phosphocholine ratio that has been identified previously as a prognostic marker of ketosis risk.13
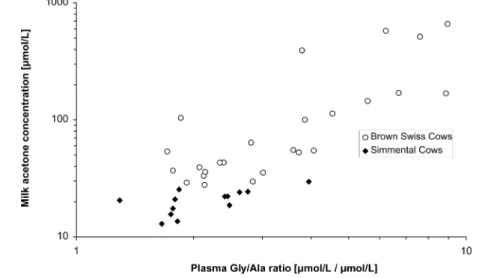
Significant results are shown in Table 3. For better visibility, rows and columns without significant correlations were excluded from Table 3; for the full table see Supplemental Table S3. As an example for a significantly correlated pair of features, plasma glycine-to-alanine ratio is plotted against milk acetone in Figure 5. Plots of the other significant correlations are shown in Supplemental Figure S2.
Plasma BHBA correlated significantly with milk acetone. For each animal whose plasma BHBA concentration in thefirst 40 days of lactation exceeded 1.4 mmol/L, the respective milk acetone value rose above the threshold of 160 μmol/L for subclinical ketosis.11 Additionally, a significant correlation of plasma BHBA with milk BHBA was observed. Elevated concentrations of BHBA in blood plasma are thus an indicator for an increase of milk acetone and BHBA, which are well- known markers for the energy status in dairy cows.10,11
Plasma glyine-to-alanine ratio correlated significantly with milk acetone levels. The correlation between Gly/Ala and milk acetone is a novel finding to the best of our knowledge, underscoring its importance as a marker for the nutrition status and making it a possible marker for the health status of the individual cow.
■
CONCLUSIONSThe metabolic status of dairy cows is reflected in both milk and blood plasma metabolites. The significant direct relationship between the concentration of blood BHBA, which is considered the“gold standard”in distinguishing healthy cows from animals with subclinical ketosis, and milk levels of acetone and BHBA underscores the usefulness of milk BHBA in the discrimination of ketotic cows. Further, the strong positive correlation of the plasma glycine-to-alanine ratio with milk acetone and, to a lesser extent, milk BHBA, may not only reflect excessive protein mobilization and glucose supply falling short of glucose demand in animals prone to ketosis but also indicate a deficiency of vitamin B6in these animals, which merits further investigation. Together with our recent finding that animals that utilize lecithin rather than adipose tissue as their preferred source of fatty acids are less prone to ketosis, the present observations may prove useful in preventing the development of ketosis and in selecting cows that adapt well to metabolic challenges of lactation for breeding purposes.
Figure 5.Plasma glycine-to-alanine ratio versus milk acetone levels in early lactation.
■
ASSOCIATED CONTENT*S Supporting Information
This material is available free of charge via the Internet at http://pubs.acs.org.
■
AUTHOR INFORMATION Corresponding Author*Phone: +49-941-943-5015. Fax: +49-941-943-5020. E-mail:
katja.dettmer@klinik.uni-r.de.
Present Addresses
§Philip Morris International R&D, Biological Systems Research, Neuchatel, Switzerland.
∥Milchgut Bahnitz, Milower Land, Germany.
⊥Institute of Animal Breeding and Husbandry, Christian- Albrechts-University, Kiel, Germany.
Author Contributions
#These authors contributed equally to this work.
Notes
The authors declare no competingfinancial interest.
■
ACKNOWLEDGMENTSThe work of the staffat the Veitshof, Freising, Germany, and at the Bavarian State Research Centre for Agriculture, Poing- Grub, Germany, is gratefully acknowledged. We thank the late Heinrich H. D. Meyer for giving access to milk and blood samples and for helpful discussions. This study was funded by BayGene and the BMBF grant 0315131F of the Fugato plus program.
■
(1) Bauman, D. E.; Currie, W. B. Partitioning of nutrients duringREFERENCES pregnancy and lactation: a review of mechanisms involving homeo- stasis and homeorhesis.J. Dairy Sci.1980,63, 1514−1529.(2) Goff, J. P.; Horst, R. L. Physiological changes at parturition and their relationship to metabolic disorders.J. Dairy Sci.1997,80, 1260−
1268.
(3) Grummer, R. R.; Mashek, D. G.; Hayirli, A. Dry matter intake and energy balance in the transition period.Vet. Clin. North Am. Food Anim. Pract.2004,20, 447−470.
(4) Kessel, S.; Stroehl, M.; Meyer, H. H. D.; Hiss, S.; Sauerwein, H.;
Schwarz, F. J.; Bruckmaier, R. M. Individual variability in physiological adaptation to metabolic stress during early lactation in dairy cows kept under equal conditions.J. Anim. Sci.2008,86, 2903−2912.
(5) Ingvartsen, K. L.; Friggens, N. C. To what extent do variabilities in hormones, metabolites and energy intake explain variability in milk yield?Domest. Anim. Endocrinol.2005,29, 294−304.
(6) Jorritsma, R.; Wensing, T.; Kruip, T. A. M.; Vos, P. L. A. M.;
Noordhuizen, J. P. T. M. Metabolic changes in early lactation and impaired reproductive performance in dairy cows.Vet. Res.2003,34, 11−26.
(7) Garnsworthy, P. C.; Masson, L. L.; Lock, A. L.; Mottram, T. T.
Variation of milk citrate with stage of lactation and de novo fatty acid synthesis in dairy cows.J. Dairy Sci.2006,89, 1604−1612.
(8) Herdt, T. H. Ruminant adaptation to negative energy balance.
Influences on the etiology of ketosis and fatty liver.Vet. Clin. North.
Am. Food Anim. Pract.2000,16, 215−230.
(9) Walsh, R. B.; Walton, J. S.; Kelton, D. F.; LeBlanc, S. J.; Leslie, K.
E.; Duffield, T. F. The effect of subclinical ketosis in early lactation on reproductive performance of postpartum dairy cows.J. Dairy Sci.2007, 90, 2788−2796.
(10) Duffield, T. F.; Lissemore, K. D.; McBride, B. W.; Leslie, K. E.
Impact of hyperketonemia in early lactation dairy cows on health and production.J. Dairy Sci.2009,92, 571−580.
(11) Enjalbert, F.; Nicot, M. C.; Bayourthe, C.; Moncoulon, R.
Ketone bodies in milk and blood of dairy cows: relationship between concentrations and utilization for detection of subclinical ketosis.J.
Dairy Sci.2001,84, 583−589.
(12) Geishauser, T.; Leslie, K.; Kelton, D.; Duffield, T. Evaluation of five cowside tests for use with milk to detect subclinical ketosis in dairy cows.J. Dairy Sci.1998,81, 438−443.
(13) Klein, M. S.; Buttchereit, N.; Miemczyk, S. P.; Immervoll, A.-K.;
Louis, C.; Wiedemann, S.; Junge, W.; Thaller, G.; Oefner, P. J.;
Gronwald, W. NMR metabolomic analysis of dairy cows reveals milk glycerophosphocholine to phosphocholine ratio as prognostic biomarker for risk of ketosis.J. Proteome Res.2012,11, 1373−1381.
(14) Blum, J. W.; Bruckmaier, R. M.; Vacher, P. Y.; Münger, A.; Jans, F. Twenty-four-hour patterns of hormones and metabolites in week 9 and 19 of lactation in high-yielding dairy cows fed triglycerides and free fatty acids.J. Vet. Med., A2000,47, 43−60.
(15) Mansion, R.; Rowlands, G. J.; Little, W.; Collis, K. A. Variability of the blood composition of dairy cows in relation to time of day.J.
Agric. Sci.1981,96, 593−598.
(16) Lefcourt, A. M.; Huntington, J. B.; Akers, R. M.; Wood, D. L.;
Bitman, J. Circadian and ultradian rhythms of body temperature and peripheral concentrations of insulin and nitrogen in lactating dairy cows.Domest. Anim. Endocrinol.1999,16, 41−55.
(17) Bitman, J.; Wood, D. L.; Lefcourt, A. M. Rhythms in cholesterol, cholesteryl esters, free fatty acids, and triglycerides in blood of lactating dairy cows.J. Dairy Sci.1990,73, 948−955.
(18) Moyes, K. M.; Larsen, T.; Friggens, N. C.; Drackley, J. K.;
Ingvartsen, K. L. Identification of potential markers in blood for the development of subclinical and clinical mastitis in dairy cattle at parturition and during early lactation.J. Dairy Sci. 2009, 92, 5419−
5428.
(19) Ilves, A.; Harzia, H.; Ling, K.; Ots, M.; Soomets, U.; Kilk, K.
Alterations in milk and blood metabolomes during the first months of lactation in dairy cows.J. Dairy Sci.2012,95, 5788−5797.
(20) Maher, A. D.; Hayes, B.; Cocks, B.; Marett, L.; Wales, W. J.;
Rochfort, S. J. Latent biochemical relationships in the blood-milk metabolic axis of dairy cows revealed by statistical integration of 1H NMR spectroscopic data.J. Proteome Res.2013,12, 1428−1435.
(21) Klein, M. S.; Almstetter, M. F.; Schlamberger, G.; Nürnberger, N.; Dettmer, K.; Oefner, P. J.; Meyer, H. H. D.; Wiedemann, S.;
Gronwald, W. Nuclear magnetic resonance and mass spectrometry- based milk metabolomics in dairy cows during early and late lactation.
J. Dairy Sci.2010,93, 1539−1550.
(22) Filipejová, T.; Kovácik, J. Evaluation of selected biochemical parameters in blood plasma, urine and milk of dairy cows during the lactation period.Slovak J. Anim. Sci.2009,42(Supplement1), 8−12.
(23) Kaspar, H.; Dettmer, K.; Gronwald, W.; Oefner, P. J. Automated GC-MS analysis of free amino acids in biological fluids.J. Chromatogr., B: Anal. Technol. Biomed. Life Sci.2008,870, 222−232.
(24)Bioanalytical Method Validation; U.S. Department of Health and Human Services, Center for Drug Evaluation and Research: Silver Spring, MD, 2001.
(25) Benjamini, Y.; Hochberg, Y. Controlling the false discovery rate:
A practical and powerful approach to multiple testing.J. R. Stat. Soc. B 1995,57, 289−300.
(26) de la Fuente, A.; Bing, N.; Hoeschele, I.; Mendes, P. Discovery of meaningful associations in genomic data using partial correlation coefficients.Bioinformatics2004,20, 3565−3574.
(27) Kim, S.-H.; Yi, S. V. Understanding relationship between sequence and functional evolution in yeast proteins.Genetica 2007, 131, 151−156.
(28) Mepham, T. B. Amino acid utilization by lactating mammary gland.J. Dairy Sci.1982,65, 287−298.
(29) Linzell, J. L.; Mepham, T. B.; Peaker, M. The secretion of citrate into milk.J. Physiol.1976,260, 739−750.
(30) Mellenberger, R. W.; Bauman, D. E.; Nelson, D. R. Metabolic adaptations during lactogenesis. Fatty acid and lactose synthesis in cow mammary tissue.Biochem. J.1973,136, 741−748.
(31) Foldager, J.; Huber, J. T.; Bergen, W. G. Factors affecting amino acids in blood of dairy cows.J. Dairy Sci.1980,63, 396−404.
(32) Kellogg, D. W.; Darnall, D. W.; Miller, D. D.; Balok, C. J.
Alterations of amino acids in plasma of lactating cows during the experimental induction of ketosis.J. Dairy Sci.1972,55, 1768−1774.
(33) Meijer, G. A.; der Meulen, J. V.; Bakker, J. G.; der Koelen, C. J.
V.; Vuuren, A. M. V. Free amino acids in plasma and muscle of high yielding dairy cows in early lactation.J. Dairy Sci. 1995,78, 1131−
1141.
(34) Shibano, K.-I.; Kawamura, S.; Hakamada, R.; Kawamura, Y. The relationship between changes in serum glycine and alanine concentrations in non-essential amino acid and milk production in the transition period in dairy cows.J. Vet. Med. Sci.2005,67, 191−193.
(35) Park, Y. K.; Linkswiler, H. Effect of vitamin B6 depletion in adult man on the plasma concentration and the urinary excretion of free amino acids.J. Nutr.1971,101, 185−191.
(36) Eliot, A. C.; Kirsch, J. F. Pyridoxal phosphate enzymes:
mechanistic, structural, and evolutionary considerations. Annu. Rev.
Biochem.2004,73, 383−415.
(37) Schwab, E. C.; Schwab, C. G.; Shaver, R. D.; Girard, C. L.;
Putnam, D. E.; Whitehouse, N. L. Dietary forage and nonfiber carbohydrate contents influence B-vitamin intake, duodenal flow, and apparent ruminal synthesis in lactating dairy cows.J. Dairy Sci.2006, 89, 174−187.
(38) Bequette, B. J.; Backwell, F. R.; Crompton, L. A. Current concepts of amino acid and protein metabolism in the mammary gland of the lactating ruminant.J. Dairy Sci.1998,81, 2540−2559.
(39) Felig, P.; Pozefsky, T.; Marliss, E.; Cahill, G. F. Alanine: key role in gluconeogenesis.Science1970,167, 1003−1004.
(40) Drackley, J. K.; Overton, T. R.; Douglas, G. N. Adaptations of glucose and long-chain fatty acid metabolism in liver of dairy cows during the periparturient period.J. Dairy Sci.2001,84, E100−E112.
(41) Overton, T. R.; Drackley, J. K.; Douglas, G. N.; Emmert, L. S.;
Clark, J. H. Hepatic gluconeogenesis and whole-body protein metabolism of periparturient dairy cows as affected by source of energy and intake of the prepartum diet.J. Dairy Sci.1998,81(Suppl.
1), 295.
(42) Wolfsdorf, J. I.; Sadeghi-Nejad, A.; Senior, B. Hypoalaninemia and ketotic hypoglycemia: cause or consequence?Eur. J. Pediatr.1982, 138, 28−31.
(43) Kuhla, B.; Nürnberg, G.; Albrecht, D.; Görs, S.; Hammon, H.
M.; Metges, C. C. Involvement of skeletal muscle protein, glycogen, and fat metabolism in the adaptation on early lactation of dairy cows.J.
Proteome Res.2011,10, 4252−4262.
(44) Okine, E. K.; Glimm, D. R.; Thompson, J. R.; Kennelly, J. J.
Influence of stage of lactation on glucose and glutamine metabolism in isolated enterocytes from dairy cattle.Metabolism1995,44, 325−331.
(45) Aschenbach, J. R.; Kristensen, N. B.; Donkin, S. S.; Hammon, H.
M.; Penner, G. B. Gluconeogenesis in dairy cows: the secret of making sweet milk from sour dough.IUBMB Life2010,62, 869−877.
(46) Harper, A.; Miller, R.; Block, K. Branched-chain amino acid metabolism.Annu. Rev. Nutr.1984,4, 409−454.
(47) Lei, J.; Feng, D.; Zhang, Y.; Dahanayaka, S.; Li, X.; Yao, K.;
Wang, J.; Wu, Z.; Dai, Z.; Wu, G. Hormonal regulation of leucine catabolism in mammary epithelial cells.Amino Acids2012,45, 531−
541.