Cite this:Phys. Chem. Chem. Phys.,2013, 15, 18607
Conformational control of benzophenone-sensitized charge transfer in dinucleotides†
Thomas Merz,zaMatthias Wenninger,zbMichael Weinberger,cEberhard Riedle,*b Hans-Achim Wagenknecht*cand Martin Schu¨tz*a
Charge transfer in DNA cannot be understood without addressing the complex conformational flexibility, which occurs on a wide range of timescales. In order to reduce this complexity four dinucleotide models 1Xconsisting of benzophenone linked by a phosphodiester to one of the natural nucleosidesX=A,G,T, C were studied in water and methanol. The theoretical work focuses on the dynamics and electronic structure of1G. Predominant conformations in the two solvents were obtained by molecular dynamics simulations.1Gin MeOH adopts mainly an open geometry with a distance of 12–16 Å between the two aromatic parts. In H2O the two parts of1Gform primarily a stacked conformation yielding a distance of 5–6 Å. The low-lying excited states were investigated by electronic structure theory in a QM/MM environment for representative snapshots of the trajectories. Photo-induced intramolecular charge transfer in the S1 state occurs exclusively in the stacked conformation. Ultrafast transient absorption spectroscopy with1Xreveals fast charge transfer from S1in both solvents with varying yields. Significant charge transfer from the T1state is only found for the nucleobases with the lowest oxidation potential:
in H2O, charge transfer occurs with 3.2109s1for1Aand 6.0109s1for1G. The reorganization energy remains nearly unchanged going from MeOH to the more polar H2O. The electronic coupling is rather low even for the stacked conformation withHAB= 3 meV and explains the moderate charge transfer rates. The solvent controls the conformational distribution and therefore gates the charge transfer due to differences in distance and stacking.
Introduction
Charge transfer in DNA is a phenomenon with two opposing
‘‘faces’’. On the one hand, charge transfer has been intensively studied over the last twenty years.1Yet on the other hand it has become obvious that charge transfer processes in DNA cannot be understood without explicitly addressing the manifold of confor- mational states present in DNA.2The concept of ‘‘conformational gating’’ has been presented to describe the influence of DNA conformations and conformational flexibility on charge transfer.3 The main problem is that the conformational flexibility of double
helical DNA is very complex and occurs on multiple timescales.
Since charge transfer rates strongly depend on the DNA base environment we expect not to observe single kinetic rate con- stants for DNA-mediated charge transfer, but rather a distribu- tion of rates.4Hence, the central question is how the issue of conformational influence on charge transfer can be addressed properly by the combination of time-resolved measurements and theory. For this purpose, we designed the dinucleotides1X as the smallest possible models for photoinduced charge transfer in DNA. They consist of benzophenone as an artificial C-nucleoside linked by a phosphodiester bridge to one of the natural nucleosides (X = A, G, T or C). These dinucleotides are soluble both in water and in polar organic solvents like MeOH. It is expected that the conformational scenario changes significantly between water and MeOH and, therefore, the con- formational influence on photoinduced singlet and triplet charge transfer5 can be studied in full detail by both time-resolved transient absorption spectroscopy and theory, including mole- cular dynamics and quantum chemical calculations to describe the charge transfer states.
Using benzophenone as the photo-induced electron acceptor has the advantage that the dinucleotides 1X represent both
aInstitute of Physical and Theoretical Chemistry, University of Regensburg, Universita¨tsstraße 31, D-93040 Regensburg, Germany.
E-mail: martin.schuetz@chemie.uni-regensburg.de
bLehrstuhl fu¨r BioMolekulare Optik, Ludwig-Maximilians-Universita¨t Mu¨nchen, Oettingenstraße 67, 80538 Munich, Germany
cKarlsruhe Institute of Technology, Department of Chemistry, Fritz-Haber-Weg 6, Campus Su¨d, Geb. 30.42, 76131 Karlsruhe, Germany
† Electronic supplementary information (ESI) available: Details of (1) preparation of dinucleotides, (2) transient spectroscopic methods and raw data, (3) modeling of the ET dynamics with Marcus theory and (4) computational work. See DOI:
10.1039/c3cp52344f
‡ These authors contributed equally.
Received 5th June 2013, Accepted 11th September 2013 DOI: 10.1039/c3cp52344f
www.rsc.org/pccp
PAPER
Published on 11 September 2013. Downloaded by Universitaetsbibliothek Regensburg on 03/08/2016 11:59:40.
View Article Online
View Journal | View Issue
interesting biologically relevant systems with respect to DNA damage6 and the starting point for future applications in chemical biology and photocatalysis. Benzophenone (BP) is a well characterized organic chromophore for biological photo- chemistry and chemical photocatalysis due to the very efficient inter-system crossing (ISC) to the triplet (T1) state.7–17With respect to photoaffinity labeling there are several other advantages:8 (i) benzophenone is chemically more stable than azides and diazirines, especially under the special or harsh conditions of peptide and nucleic acid synthesis. (ii) The T1state of BP is able to extract hydrogen atoms from unreactive C–H bonds in biopolymers,e.g.,a-hydrogen from amino acids.9(iii) The absorp- tion of BP in the UV-A region allows selective excitation outside the typical absorption range of biopolymers including tryptophan in proteins and DNA/RNA bases. On the other hand, BP plays an increasingly important role as an excitation antenna collecting the light and thereby initiating substrate conversion in photochemical reactions.10,11Molecular BP architectures can be considered as chemical photocatalysts if they bear a substrate binding site, and substrate conversion occurs initiated by energy or electron transfer.12 In fact, both processes have been applied success- fully for the development of BP- and xanthone-based photo- organocatalysts.13 Template-assisted photocatalysis yields enantioselective [2+2] cycloaddition14–16 and, more importantly, templated photoinduced electron transfer can be applied to enantio- selective aminocyclizations.17With respect to the mentioned proper- ties of BP and its derivatives, covalent conjugates with nucleosides and nucleic acids could be of significant interest.18–23 New photoaffinity labels based on BP-modified nucleic acids could help to identify DNA- and RNA-binding proteins. On the other hand, BP as an artificial nucleoside provides the molecular basis to develop photocatalytically active DNAzymes. Among the few examples found in the literature, BP-substituted nucleosides have been prepared as models for ribonucleotide reductases18,19and as photoreactive dyads.20BP has been attached to phosphothioates in RNA21 and to 20-deoxyuridine in DNA22 to form interstrand crosslinks. 4-Cyanobenzophenone-substituted 20-deoxyuridines have been extensively used for photoinduced charge transfer studies with DNA.23,24
We recently presented the synthesis of a novel C-nucleoside consisting of BP directly attached to the anomeric center of 20-deoxyribofuranoside.25Thereby, the chromophore is placed as an artificial DNA base and can be incorporated synthetically into oligonucleotides by automated phosphoramidite chemistry. In the present study, we furnish a complete characterization of the optical properties of1as an artificial nucleoside and in the context of four different dinucleotides (1G,1A,1C and1T, Scheme 1) to evaluate the influence of the neighboring DNA base on the BP properties. The photophysical properties of1can be influenced by two different protic solvents, water and methanol. Time-resolved measurements of singlet and triplet lifetimes elucidate how conformational changes control the photophysical properties of BP and gate the charge transfer in the dinucleotides.
The theoretical part of our work focuses on the dynamics and electronic structure of the dinucleotide1G, which is the most interesting dinucleotide based on the knowledge that BP-initiated
charge transfer could lead to oxidation of guanine,23,26,27and the results from the time resolved studies (vide infra) that will be described. At first, the isolated1G(and for comparison1T) dinucleotides were investigated. Geometry optimizations were performed for the electronic ground state, and excitation energies were computed at the resulting minimum energy geometry. Second, 1Gwas also investigated in two different solvent environments (H2O and MeOH)viaMolecular Dynamics (MD) simulations and subsequent hybrid Quantum Mechanics/Molecular Mechanics (QM/MM) calculations. Representative snapshots from related MD production trajectories were selected, and the individual geometries reoptimized at the QM/MM level. At the resulting geometries, excitation energies and other properties of the relevant low-lying excited states were calculated in the QM/MM framework.
In the following sections we present the detailed results of these calculations.
Theoretical elucidation of conformations and molecular dynamics in water
and methanol
First, DFT geometry optimizations (BP functional,28def-SVP basis set29) were performed for the isolated1Gand1Tmolecules. For simplicity,1Gand1Twere considered as neutral molecules with a proton added to the phosphate in all calculations presented here.
Two strongly differing basic geometries of1Gand1Twere found;
(i) a compact, folded structure for1Gas displayed in Fig. 1(b), with the G and one of the phenyl rings undergoingp-stacking, and (ii) a stretched, unfolded structure as shown in Fig. 1(a) (analog figures for the folded and unfolded structure of1Tcan be found in Fig. SI-19, ESI†).
The latter constitutes in both cases a local minimum on the potential energy surface. At the Coupled Cluster level (CC2 model)30 in the same basis the unfolded structure is not stable and folds to the geometry given in Fig. 1(a). The absence of long-range van der Waals dispersion in the pure DFT/BP description is mainly respon- sible for the existence of the unfolded structure, which can be repaired to some extent, bye.g.the inclusion of Grimme’s-D2 correction,31which is employed in the subsequent DFT QM/MM calculations. Nevertheless, the unfolded structure reappears again if we perform the calculations notin vacuo but in a methanol environment (vide infra). Hence, both folded and unfolded struc- tures were further investigated.
Scheme 1 BP nucleoside1and dinucleotides1Xwith BP as an artificial DNA base (X = G, T, A, C).
Published on 11 September 2013. Downloaded by Universitaetsbibliothek Regensburg on 03/08/2016 11:59:40.
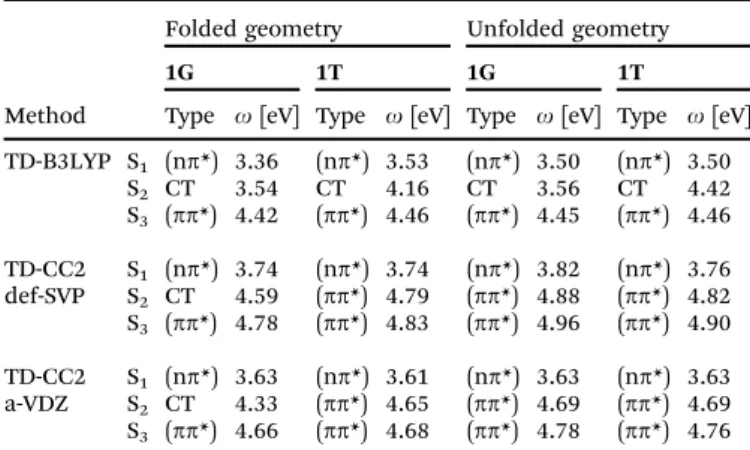
Next, for the isolated dinucleotides, excitation energies, density differences between excited and ground state, and related dipole moment differences of the three lowest singlet states were calcu- lated at the respective ground state minima. To this end, TD-DFT (B3LYP functional32,33), as well as TD-CC2 response30,34–36(often casually termed as just CC2) were applied. The def-SVP and aug- cc-pVDZ basis37sets were used for these calculations (for the latter basis set excitation energies were computed only). The resulting excitation energies of the three lowest excited singlet states are compiled in Table 1 for the unfolded and folded geometries of1Gand1T(triplet excitation energies for1Gcan be found in the ESI,†cf. Table SI-2, for comparison).
Fig. 2 depicts the related electron density differences for the case of the folded geometry of 1G (related electron density differences of the folded geometry of1Tare displayed in Fig. SI-20 (ESI†); for the relevant molecular orbitals for1G and1Tcf.Fig. SI-21 and SI-22 (ESI†)).
For the folded geometry of1Gthe S1, S2, and S3states are of (np*), charge transfer (CT), and (pp*) type. The CT state features depletion of electron density on G, and increase of electron density on the BP part. Comparison of the TD-DFTvs.TD-CC2 results shows a substantial increase in the energy gap between the S1and S2from 0.18 eV (TD-DFT) to 0.85 eV (TD-CC2, def SVP) and 0.70 eV (TD-CC2, aug-cc-PVDZ). CT states are notoriously underestimated by TD-DFT with local, or semi-local functionals
due to the electronic self-interaction problem inherent in DFT.38,39 For isolated folded 1T, on the other hand, only the TD-DFT calculation features a CT state among the three lowest states.
The order and type of characters are similar to1G. However, the gap between the S1and the CT states is significantly increased, compared to1G (0.63 vs. 0.18 eV). For TD-CC2, the CT state disappears among the three lowest excitations, and the S1, S2
and S3 states correspond to a (np*), (pp*) and (pp*) types, respectively. Hence, the CT state in the TD-DFT calculation for 1Tis just an artifact, caused by the abovementioned electronic self-interaction problem. Adding diffuse functions has the usual effect of decreasing the TD-CC2 excitation energies by 0.1–0.2 eV, which is seen in both cases.
For the unfolded geometry the S1, S2, and S3states calculated by TD-CC2 are of (np*), (pp*), and (pp*) type for both1Gand1T.
The CT state for1Gis clearly absent, which is not too surprising since the distance between donor (G) and acceptor (BP) is much larger than in the folded geometry. For TD-DFT, on the other hand, the CT state is clearly present (as the S2 state) and features about the same excitation energy as in the folded geometry. This is the typical irregular behavior of TD-DFT, since CT states described by that method do not reflect the proper distance dependence between donor and acceptor (according to the Coulomb law).
Based on the gas phase results presented so far we conclude that (i) the distance between the BP and the G subsystems intimately affects the character of the three relevant, lowest excited states. In particular there is a low-lying CT state present for the folded geometry, which is absent for the unfolded one.
(ii) All these excitations are either localized on G, or BP, or both for the CT state, as is evident from Fig. 2. The sugar and phosphate
Fig. 1 Optimized structures of1Gin the gas phase. The five- and six-membered rings are colored in red/green and blue for better recognition. Also the distances d(C6–O39) andd(C6–C37) are given. (a) Unfolded structure computed with DFT/BP in the def-SVP basis;d(C6–O39) = 15.59 Å andd(C6–C3) = 16.09 Å. (b) Folded structure computed with CC2/def-SVP;d(C6–O39) = 6.92 Å andd(C6–C37) = 6.10 Å.
Table 1 Results for folded and unfolded molecules of1Gand1T; optimized ground state; TD-B3LYP/def-SVP TD-CC2/def-SVP and TD-CC2/aug-cc-pVDZ
Method
Folded geometry Unfolded geometry
1G 1T 1G 1T
Type o[eV] Type o[eV] Type o[eV] Type o[eV]
TD-B3LYP S1 (np*) 3.36 (np*) 3.53 (np*) 3.50 (np*) 3.50 S2 CT 3.54 CT 4.16 CT 3.56 CT 4.42 S3 (pp*) 4.42 (pp*) 4.46 (pp*) 4.45 (pp*) 4.46 TD-CC2 S1 (np*) 3.74 (np*) 3.74 (np*) 3.82 (np*) 3.76 def-SVP S2 CT 4.59 (pp*) 4.79 (pp*) 4.88 (pp*) 4.82 S3 (pp*) 4.78 (pp*) 4.83 (pp*) 4.96 (pp*) 4.90 TD-CC2 S1 (np*) 3.63 (np*) 3.61 (np*) 3.63 (np*) 3.63 a-VDZ S2 CT 4.33 (pp*) 4.65 (pp*) 4.69 (pp*) 4.69 S3 (pp*) 4.66 (pp*) 4.68 (pp*) 4.78 (pp*) 4.76
Fig. 2 Electron density difference plots for the first three excited states of the folded geometry of1G, calculated with TD-CC2 in def-SVP basis. Isosurfaces are plotted for0.005 a.u., red refers to a decrease, green to an increase in the density upon excitation. (a) S1: (np*) state; |Dm| = 1.72 D (b) S2: CT state; |Dm| = 10.58 D (c) S3: (pp*) type state; |Dm| = 1.32 D.
Published on 11 September 2013. Downloaded by Universitaetsbibliothek Regensburg on 03/08/2016 11:59:40.
groups linking these two subunits do not play a role and can therefore be safely omitted from the QM part in the subsequent QM/MM studies of the system in solvent environments. (iii) A CT state in1Tcannot be observed, neither in the unfolded, nor the folded geometry.
In order to generate proper starting structures for a subsequent QM/MM treatment of1Gin water and methanol solvent environ- ments, classical molecular dynamics (MD) simulations were carried out first. Similar MD simulations were also carried out for1T, which however will not be further discussed. For the latter we refer to Fig. SI-26 and SI-27 in the ESI† (Section 4). Also the technical details of these simulations are described in the ESI† (Section 4). MD simulations in water and methanol were performed by starting from either the folded or the unfolded gas phase structure of 1G (overall four MD simulations). It turns out that the resulting trajectories are rather independent of the starting geometry:1Gsolvated in water primarily exists in the folded form, while1Gsolvated in methanol primarily exists in the unfolded form.
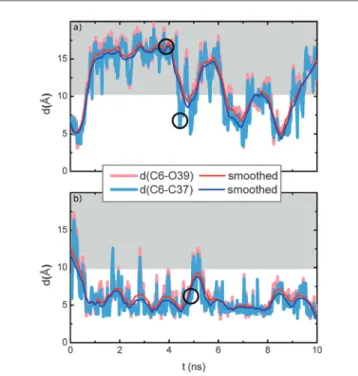
The trajectories of the MD simulation of1G in methanol (starting from the folded geometry) and of the MD simulation of 1Gin water (starting from the unfolded geometry) are displayed in Fig. 3(a) and (b). The trajectories of the two other MD simulations with converse starting geometries are included in Fig. SI-25 (ESI†).
The degree of folding is measured by the distancesd(C6–C37) andd(C6–O39) (cf. Fig. SI-18, ESI†), which reflect the spatial separation of the BP and G subunits. For the isolated molecule these distances amount to 5–6 Å for the folded, and 15–16 Å for the unfolded form. Thus, in our MD simulations we consider
geometries with distances of above 10 Å as unfolded (grey shaded area in Fig. 3), and geometries with distances of below 10 Å as folded forms. Evidently, unfolded1Gin water folds and stays folded most of the time. In contrast, folded1Gin methanol unfolds and stays in that form most of the time. Obviously, in the polar water solvent, the two hydrophobic ring systems BP and G stick together and undergo p-stacking, while in the less polar methanol they are individually solvated by methanol molecules.
For the subsequent QM/MM study we have selected five representative snapshots: from each of the four trajectories, as indicated in Fig. 3 and in Fig. SI-25 (ESI†), there are two snapshots related to the water environment, a1GH2O and b1GH2O, corre- sponding to the folded form, and two related to the methanol environment, a1GMeOH, and b1GMeOH, corresponding to the unfolded form; additionally, a fifth snapshotc1GMeOH, which represents the rather rare event of a folded form in the methanol environment, was also considered.
Spectroscopic results
For the time resolved measurements and their interpretation the optical properties of the artificial nucleoside 1 and the dinucleotides1Xwere characterized. The spectra of compound 1in MeOH (Fig. 4a and b) are typical for all other compounds.
One prominent strong absorption band is centered at 259 nm (4.79 eV) that corresponds to a1(pp*) transition located on BP. A much weaker band is centered at 329 nm (3.77 eV) and corresponds to the1(np*) transition of BP.40The assignment of the bands to transitions located on BP is corroborated by the high similarity to the spectrum of BP (Fig. 4a). Furthermore, the band positions are in good agreement with the TD-CC2 excitation energies
Fig. 3 Trajectories of MD run; (a) shows1Gin methanol environment and (b)1Gin water; the distancesd(C6–C37) andd(C6–039) in Å are plotted against the simulation time in ns. The grey area is the region in which the molecule is unfolded. The cycles depict the chosen snapshots. (a) MD of1GMeOH, folded (4.2 ns;c1GMeOH) and unfolded (4.0 ns;a1GMeOH) starting geometry. (b) MD of1G water, folded (4.5 ns;a1GH
2O) starting geometry.
Fig. 4 (a) Absorption of BP and1in MeOH at r.t. (b) Phosphorescence of1,1C and1Gat 77 K in MeOH. (c) Phosphorescence of1,1Cand1Gat 77 K in H2O.
Published on 11 September 2013. Downloaded by Universitaetsbibliothek Regensburg on 03/08/2016 11:59:40.
reported in Table 1. The latter transition allows selective excita- tion of the BP chromophore outside the nucleic acid absorption range. This is an important prerequisite for the photochemical and photobiological applications. Both electronic transitions are broad and structureless at r.t. due to the thermal population of low frequency vibrational levels and the interaction with the environment.
Upon excitation at 355 nm, nucleoside1in MeOH shows a well structured phosphorescence at 77 K. This structure becomes visible due to the lack of thermal vibrational excita- tion and the long lifetime of the T1state. The first vibronic peak corresponding to the 0–0 vibrationless electronic transition is found at 413 nm. The shape and the energetic positions are very similar for all dinucleotides 1X (compare spectra for 1G and1Cin Fig. 4b). This observation differs from the phospho- rescence in aqueous buffer solution (Fig. 4c). 1 dissolved in H2O exhibits the 0–0 peak at 435 nm. Due to the characteristic intensity pattern we can be sure that we observe a shift and not a disappearance of the 0–0 subband. The shift compared to the MeOH solution is interpreted as the exposure of the chromophore to water. The 0–0 phosphorescence peak of the dinucleotides in H2O is found to be very similar to MeOH. This shows that the DNA base adjacent to the BP in the dinucleotides is able to shield the chromophore from the electrostatic influence of the water molecules. We therefore expect that the photochemical reactivity of the BP derivative 1 as part of the synthesized dinucleotides1Xis more similar to1in organic solvents (like MeOH) than 1 in water. We can confirm the presence of a preferred stacked (folded) conformation of 1X in water as suggested by the molecular dynamics simulations.
Electron transfer (ET) between nucleobases and an excited organic chromophore is well established and usually occurs on time scales of 10–100 ps when the two moieties are in close proximity.41,42We used femtosecond transient absorption (TA) spectroscopy43to measure the kinetics of the various compounds.
Directly after excitation of the lowest1(np*) transition, pure BP in MeOH shows the spectrum of the S1 state with prominent absorption maxima at 340 and 580 nm (Fig. SI-9, ESI†). BP in MeOH serves as reference according to the results obtained with the steady state spectroscopy. The decay of the singlet spectral signatures is dominated by very fast ISC.40Upcoming absorption bands at 320 and 530 nm can be uniquely assigned to the BP triplet state T1. We find a lifetime oftS
1= 12.5 ps for the S1state.
Assuming a quantum yield ofFT= 100% for the population of the BP T1state in agreement with the literature44the rate of ISC is determined askISC= (tS1)1. An analogous modeling will also be used in the analysis of the more complex TA data of the BP dinucleotides1X.
A first measurement series of the BP nucleosides 1X and reference compound 1 was performed in MeOH (Fig. 5 and Fig. SI-10 to SI-13, ESI†). Directly after excitation we observe transient spectra which are very similar to those of pure BP showing the absorption features of the BP S1state. The covalently bound 20-deoxyribofuranoside does not significantly affect the excited state spectral features. The ultrafast ISC is also found for the nucleo- sides1Xand reference1, the lifetime of1in MeOH istS
1= 9.4 ps.
The slightly faster ISC compared to BP is reasonable in view of the covalently bound substituent. In comparison to1all nucleosides 1Xshow a further reduced lifetime of the S1state and a depen- dence on the adjacent nucleobase. Especially the lifetime of compound 1G, where BP is linked to guanine (the nucleobase with the lowest standard oxidation potentialE0) is considerably reduced: we findtS
1= 7.6 ps in MeOH. All obtained time constants are summarized in Table 2. The lifetime of the triplet states in MeOH cannot be determined by the ultrafast TA spectroscopy, since it exceeds the maximum pump–probe delay of 2 ns.
We therefore set it to infinity for the analysis.
It is interesting to compare the variation of the S1lifetimestS
1
with the variation of the standard oxidation potential E0 of the corresponding nucleobase.45In1G, which contains the nucleobase with the lowest E0 and hence is the most easily oxidized, tS
1 is significantly reduced in comparison to all other compounds. This indicates that ET from the covalently bound nucleobase to the excited singlet state of BP can compete with the ISC process, which explains the reducedtS
1of all1Xin comparison to1. The transient signature of the intermediate BP radical anion expected at 333 and 720 nm46is not visible. A charge recombination process, which is fast in comparison to the ET process, can readily explain the absence of the spectral signatures of the intermediate charge separated state.
From the inhomogeneous distribution of conformations it could be expected that the S1decay time does not conform to a simple exponential behavior.47 We fitted the curves with a stretched exponential and obtained somewhat unexpected exponents around 1.1 and not the expected values below 1. A rational can be that we have a highly nonstatistical distribution as we find indeed from the trajectories in Fig. 3. Since this precludes any reasonable analytical modeling, we decided to use the single-exponential fit values for further interpretation.
The ET time constant1tETdetermined from the measured lifetime tS
1 for all dinucleotides 1X is depicted in Table 2.
Fig. 5 Transient absorption spectra of 1Cin MeOH after 358 nm excitation (a) selected spectra (b) temporal evolution at selected wavelengths (dots) with corresponding traces from the global fit (lines).
Published on 11 September 2013. Downloaded by Universitaetsbibliothek Regensburg on 03/08/2016 11:59:40.
The ET time constant 1tET was calculated using kISC from compound1 as the intrinsic lifetime of the S1 state of BP in the dinucleotide environment as
1tET1
¼1kET¼ 1
tS1kISC (1) We interpret the dependence of the ET rate on the standard oxidation potential E0 of the nucleobase with the help of standard Marcus theory.48For details see the ESI† (Section 3).
We calculateDG0, which serves as the driving force for the ET reaction between the nucleobase and the BP S1or T1according to Rehm–Weller:49
DG0¼e E 0ðDþ=DÞ E0ðA=AÞ e2
4pe0erDE00 (2) whereE0is the one-electron oxidation/reduction potential,eis the permittivity of the solvent,ris the average donor–acceptor distance, andDE00is the energy of the excited state relative to the ground state. For the lowest BP1(np*) singlet state, 1DE00 equals 318 kJ mol1(3.30 eV, 376 nm) and for the lowest triplet state3DE00is 293 kJ mol1(3.04 eV).49The standard potential E0for the reduction of BP isE0=1.00 V against the normal hydrogen electrode (NHE).50The average distancerbetween the donor and acceptor was found from the molecular dynamics calculations to be1rMeOH=3rMeOH= 12 Å for the S1and T1states of all1Xin MeOH, and1rH2O=3rH2O= 6 Å in H2O. The use of an average value instead of the distance distribution is justified since the distance dependence in eqn (2) only causes minor variations ofDG0. The values of the permittivity of the solvents are eMeOH = 32.66e0 andeH
2O = 78.36e0.51 The results of the calculatedDG0values are listed in Table 3 for BP in its S1and T1 states in MeOH and in H2O.
The Marcus equation is highly nonlinear and an intuitive prediction of the dependence of1kETonDG0is difficult. From a detailed consideration we conclude that onlylvalues around 62 kJ mol1andHAB= 1.49 meV (12 cm1) allow a good reproduc- tion of the experimental observations. We find that the ET process already seems to be in the Marcus inverted regime for 1G, in agreement with the reported behaviour in DNA hairpin structures.52 Another approach to verify an ET process between the nucleo- base and BP in its S1state is the spectroscopic determination and analysis of the triplet yieldFTfor each compound. If a deactivation pathway of the BP S1state competes with ISC, the triplet quantum yield FT of BP should be reduced. For the measurements in MeOH we are indeed able to quantify FT. By dividing the integrated transient absorption of an S1specific absorption band (303–350 nm, blue shaded area in Fig. 6) directly after excitation (t= 0.5 ps) by the integrated transient absorption of a T1specific absorption band (450–600 nm, red shaded area) at a pump–probe delay ofDt= 100 ps we calculateFTfor each compound. The yield FTdetermined in this way (see Table 2) is in good agreement with the triplet yield calculated from the values of1kETandkISC
determined above according to eqn (3) FT¼ kISC
1kETþkISC (3)
Turning to the triplet manifold, we note that in MeOH there are seemingly no charge transfer processes between the BP moiety and the attached nucleobase which are faster than a nanosecond.
This stands in contrast to the results in water (see below) and
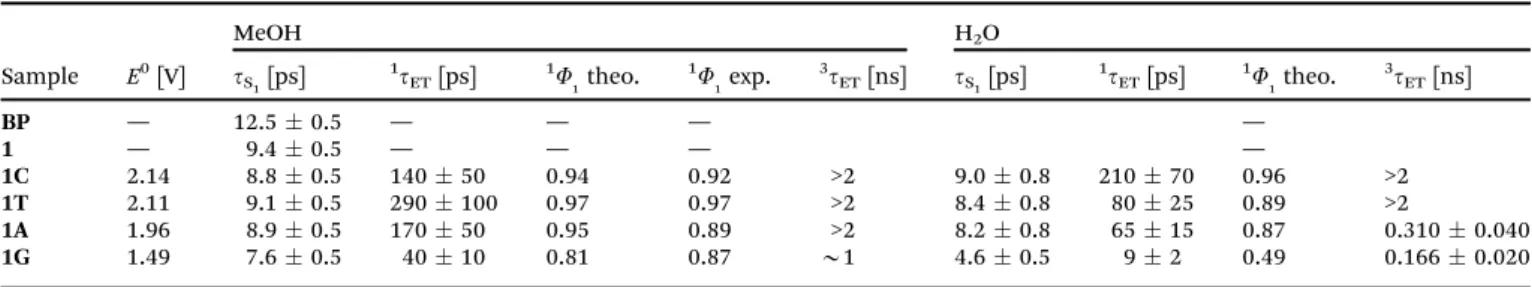
Table 2 Time constants of excited state dynamics in MeOH and H2O: standard oxidation potentialE0of the nucleobase from ref. 45,tS1obtained from a global fit,
1tETwas calculated by using the S1lifetime of compound1in MeOH as intrinsic lifetime of the S1state and3tETfrom the dynamics of the integrated transient absorption at 300–400 nm. The triplet yieldFT1was determined by inserting the quantities into a rate model based on eqn (3) (FT1theor.) and also experimentally by integration of the triplet specific transient absorption (FT1exp.)
Sample E0[V]
MeOH H2O
tS
1[ps] 1tET[ps] 1F
1theo. 1F
1exp. 3tET[ns] tS
1[ps] 1tET[ps] 1F
1theo. 3tET[ns]
BP — 12.50.5 — — — —
1 — 9.40.5 — — — —
1C 2.14 8.80.5 14050 0.94 0.92 >2 9.00.8 21070 0.96 >2
1T 2.11 9.10.5 290100 0.97 0.97 >2 8.40.8 8025 0.89 >2
1A 1.96 8.90.5 17050 0.95 0.89 >2 8.20.8 6515 0.87 0.3100.040
1G 1.49 7.60.5 4010 0.81 0.87 B1 4.60.5 92 0.49 0.1660.020
Table 3 Change of free energyDG0corresponding to the oxidation of DNA nucleobases by the S1(1DG0) and T1state (3DG0) of BP in MeOH and in H2O
Sample E0 44 [V]
MeOH H2O
1DG0 [kJ mol1]
3DG0 [kJ mol1]
1DG0 [kJ mol1]
3DG0 [kJ mol1]
1C 2.14 20 6 20 5
1T 2.11 22 3 23 2
1A 1.96 37 12 38 12
1G 1.49 82 57 83 58
Fig. 6 SAS of BP S1(blue) and T1state (red) after 358 nm excitation of1Cin MeOH.
The shaded integrals were used to determine the relative triplet yield.
Published on 11 September 2013. Downloaded by Universitaetsbibliothek Regensburg on 03/08/2016 11:59:40.
implies gating of electron transfer by conformational changes, as discussed later in the theoretical part. The calculated DG0 values for1A, and particularly1Cand1Tfor the BP T1state are close to zero or even positive in MeOH and effectively prohibit an ET process. This is in agreement with our measurements. For1G we see a weak signature of the BP anion around 333 nm toward the end of the probe range that might well be due to slow and inefficient ET between guanine and the BP triplet state.
The species associated spectra (SAS) of compound1Cin MeOH (Fig. 6) are determined from the decay associated difference spectra (DADS) directly obtained from a global fit. The species decaying with 9 ps is assigned as the S1state, the species with the long lasting spectral contribution as the T1 state. The corre- sponding spectra of all other compounds are identical within experimental precision to these two spectra. The SAS corroborate our qualitative discussion given above that the early spectral features are due to the initially populated S1state, and the later ones to the T1state. The lack of sizable anion signatures in the transient spectra indicates that the back ET is considerably faster than the forward rates of 3109to 2.51010s1.
It was shown above that the phosphorescence spectrum of the BP chromophore in1is affected by water as a solvent (Fig. 4).
This influence is, however, not observed for the nucleosides1X.
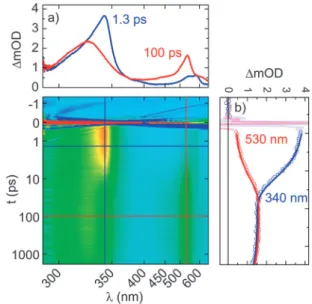
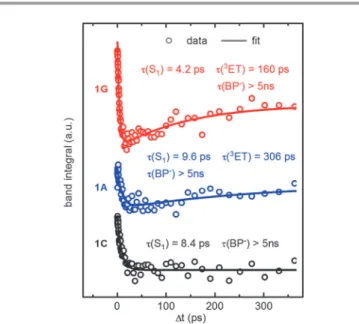
To clarify the kinetics behind this observation, a second series of measurements was performed in H2O, the natural environment for DNA. Directly after excitation of compounds1Xwe observe the transient signatures of the BP S1state as already observed in MeOH. The lifetime of the S1 state reduces with decreasing standard oxidation potential E0 of the adjacent nucleobase, similar to what is observed in MeOH. In contrast to the measurements in MeOH, we also find changes in the transient spectra for 1G and 1A at delay times in the 100 ps regime (Fig. 7). They have to be interpreted as a significantly reduced lifetime of the T1state due to ET from the adjacent nucleobase.
The spin multiplicity of the dinucleotide is conserved in this process and the formed intramolecular radical ion pair still exhibits triplet character.53 All determined time constants are summarized in Table 2.
The dominant influence of the nucleobases in compounds 1Xdissolved in H2O is the singlet ET. A plot of 1kETvs. 1DG0 (see Fig. SI-17, ESI†) confirms the picture which we already obtained from the measurements in MeOH. We also applied the Marcus equation for evaluation of the dependence of1kET on1DG0in H2O. The reorganization energy ofl= 67 kJ mol1 (0.70 eV) is close to the value found for MeOH, while the fitted electronic coupling strength is HAB = 2.64 meV (21 cm1).
Again, the parameterHABis just an effective value and will be later discussed in connection with the distribution of donor acceptor distances.
Due to the decay dynamics of the triplet state,i.e.the significant ET in the triple state, we were not able to quantify the triplet yield in the same fashion as for MeOH. The transient spectra of samples1Gand1Ain H2O show a decay of the triplet spectrum with simultaneously upcoming sharp spectral signatures of the BP radical anion at 335 nm (Fig. 7 and 8). The assignment of the spectral features to the spectrum of the BP radical anion is done in accord with the literature.46 The spectra in Fig. 7 for compound 1G are exemplary also for compound1A with the exception of the precise values of the time constants.
To further clarify the charge transfer dynamics between the nucleobase and the BP T1state it seems reasonable to analyze the dynamics of the integrated transient absorption between 300 and 340 nm due to well distinguishable absorption characteristics of the excited singlet, triplet, and radical anion state in this spectral region. A multi-exponential fit provides within experimental error the same time constants as already obtained from the global data analysis. The data points and the corresponding multi-exponential fit curves are depicted in Fig. 8. All data have a sizable offset,i.e.the integral signal does not decay to zero within the observation window. This is due to the lasting charge separation in the triplet state. Such a long living CT state is not unexpected, due to the remaining spin correlation in the intramolecular radical ion pair.53
Fig. 7 TA spectra of compound1Gin H2O for selected pump–probe delays after 358 nm excitation. The wavelength region containing scattered light of the pump pulse was clipped.
Fig. 8 Integrated transient absorption from 300 to 340 nm of samples1G,1A, and1Cin H2O after 358 nm excitation. The time constants are obtained from multi-exponential fits.
Published on 11 September 2013. Downloaded by Universitaetsbibliothek Regensburg on 03/08/2016 11:59:40.
Despite differing sample concentrations and experimental conditions, the differing temporal behavior can be well seen from the displayed curves. Note in particular that the signal for 1Cis settled after 100 ps while the signals for1Gand1Akeep increasing due to the triplet charge transfer.
All processes and the energetics of the involved levels are summarized for1Gin H2O in Fig. 9. ET is found both in the singlet and the triplet system, but the charge separation is only persistent for the triplet system. These observations are similar to the recent reports on anthraquinone–DNA conjugates.5aFrom the experimental data no solid reasoning for this striking observa- tion can be deduced. The only argument to be invoked would be spin correlation between the radical ions and the forbidden character of the back transfer involving spin flip. It should also be remembered that ET in the triplet system is not found for MeOH. For an explanation of these observations we turn to quantum chemical calculations.
QM/MM studies for the energy landscape of 1G
In the following, the discussion of the results is divided into two parts discussing 1G solvated in water, and in methanol, respectively.
According to our MD simulations reported in Fig. 3, 1G in water almost exclusively exists in the folded form. We therefore have selected two snapshots a1GH2O, and b1GH2O
which represent the folded configuration. The calculated singlet excitation energies for these two snapshots are compiled in Table 4 (for triplet energies at the optimised ground state see Table SI-7, ESI†).
First we concentrate on the results for the optimized ground state. The folded snapshots feature a distance between C7 and O39 of about 3.3 Å. As is evident from Table 4, the excitation energies of the three lowest excited states are very similar for the two individual snapshots. For all snapshots the S1, S2, and S3states are of (np*), (pp*) and (pp*) types. Hence, in contrast to the isolated molecule, there is no low-lying CT state in the Franck–Condon region for the folded form of 1G in water.
Apparently, the solvent shell relaxed for the ground state destabilizes the CT state. Presumably, primarily the BP subunit
is responsible for this effect (BP is not soluble in water); the solvent shell around BP changes considerably when optimizing the geometry on the potential energy surface of the CT state.
The density difference plots and dipole differences (relative to the ground state) corresponding toa1GH2Oare displayed in Fig. 10 (for the relevant molecular orbital contributions cf.Fig. SI-29-a, ESI†).
The density difference of the S1 state looks similar to that of the S1state of the isolated system (Fig. 2).
It has the character of a (np*) transition with a dipole moment difference of about 1.9 D. The S1’S0excitation energies of the two snap shots amount to 320–330 nm, which fits the experimental value of 329 nm quite well. Relative to the gas phase values, the solvated molecules appear to be blue shifted by 10–20 nm.
Fig. 9 Excited state energetics and kinetics of1Gin H2O.
Table 4 TD-CC2 QM/MM excitation energies o at the respective TD-DFT minima, calculated in aug-cc-pVDZ basis, respectively.DEcorresponds to the total energy difference of the optimised (np*) state and the (np*) state at the ground state geometry (aDE=Etot(np*)optEtot(np*)FC), or of the optimised CT state and the (np*) state at the ground state geometry (bDE =Etot(CT)opt Etot(np*)FC); solvent: H2O
Structure State
FC point (np*) state CT state
DE[eV]
Type o[eV] Type o[eV] Type o[eV]
a1GH
2O S1 (np*) 3.85 (np*) 3.02 CT 2.83 0.08a S2 (pp*) 4.62 (pp*) 4.57 (np*) 3.38
S3 (pp*) 4.75 (pp*) 4.71 (pp*) 4.18 0.36b
S4 — — CT 4.74 — —
b1GH
2O S1 (np*) 3.80 (np*) 3.12 CT 2.58 0.18a S2 (pp*) 4.57 (pp*) 4.51 (np*) 3.34
S3 (pp*) 4.61 (pp*) 4.57 (pp*) 4.14 0.20b
S4 — — CT 4.76 — —
Fig. 10 Electron density difference plots for the first three excited singlet states ofa1GH
2O, calculated with TD-CC2 in the aug-cc-pVDZ basis in the QM/MM framework at the Franck–Condon point. Isosurfaces are plotted for0.005 a.u., red refers to a decrease, green to an increase in the density upon excitation.
(a) S1: (np*) state, |Dm| = 1.86 D (b) S2: (pp*) state, |Dm| = 2.43 D (c) S3: (pp*) state,
|Dm| = 2.46 D.
Published on 11 September 2013. Downloaded by Universitaetsbibliothek Regensburg on 03/08/2016 11:59:40.
S2and S3are quite well separated from S1, but the gap between S2 and S3 is very small. These are (pp*) states with dipole differences of 2.4–2.5 D.
Geometry optimization on the S1state surface, which was done in order to check if on the route downhill to the S1state minimum a crossing with a CT state occurs, showed that the above mentioned distancesd(C7–O39) compared to the ground state optimized ones (see Table SI-5, ESI†), do not alter much. Relative to the FC point the total energy drops slightly by 0.1 eV (a1GH2O) and 0.2 eV (b1GH2O).
Similarly as at the Franck–Condon point the S1, S2, and S3states are again of (np*), (pp*), and (pp*) type, respectively. Again, S2and S3are energetically rather close, while the gap between S1on the one hand, and S2, S3on the other hand, is fairly large. However, a CT state now comes into play as the S4state.
Therefore, fora1GH2Oandb1GH2Ofurther geometry optimiza- tions on this CT state surface were performed. The relevant density difference plots and dipole moment differences related toa1GH2Oare given in Fig. 11. The CT state minimum for the
a1GH2Oandb1GH2Osnapshots isDE= 0.4 andDE= 0.2 eV below the FC point (cf.Table 4), hence at about the same energy as the S1 state minimum (b1GH2O), or slightly below (a1GH2O). This allows population transfer from the excited S1state to the dark CT state with reasonable efficiency.
Interestingly, the S3 (pp*) state at the CT state minimum now corresponds to a local excitation on the G subunit with a relatively large dipole moment difference (relative to the ground state at that geometry) of more than 10 D.
In the course of the optimization on the CT state surface, the distance between the oxygen O39 of the carbonyl group of BP
and the C7 atom of the G decreases substantially from 3.22 Å (a1GH2O) or 3.39 Å (b1GH2O) for the ground state minimum to 2.73 Å (a1GH2O) or 2.93 Å (b1GH2O) for the optimized CT state.
The shortening of this distance might indicate a possible subsequent proton transfer, equalizing the charge separation induced by the preceding electron transfer (cf.Fig. 11).
From the MD trajectory in methanol three individual snap- shots were taken, i.e. two snapshots a1GMeOH and b1GMeOH, which represent the characteristic unfolded conformation, and a representative snapshotc1GMeOHfor a folded conformation in methanol. As already discussed,1Gexists in the methanol environ- ment predominantly in the unfolded conformation. The folded conformation was selected to check if in such a geometry a transition to the charge transfer state is also possible in the methanol environment. For the optimized ground state geo- metries, the distance d(C7–O39) of the unfolded conformers ranges between 14 and 17 Å, while that of the folded conformer amounts to about 3.1 Å (see Fig. SI-28, ESI†). This is comparable to the folded snapshots in water. The excitation energies of the three lowest excited singlet states obtained by the QM/MM calculations are compiled in Table 5 (for triplet energies at the optimised ground state see Table SI-7, ESI†).
Evidently, the excitation energies of the two unfolded snapshots are very similar: the first excitation corresponds to a (np*) state. As is the case also in water, the calculated first excitation energies fit the experimental value of 329 nm quite well. Again, similar to the spectrum in water, the (np*) state is well separated from the S2and S3states, which in turn are rather close together.
S2and S3are (pp*) states. In contrast to1Gsolvated in water the S3state now corresponds to a local excitation on the G, rather than on the BP subunit.
The S1state of the folded snapshot also has (np*) character with similar excitation energy as the S1 states of the two unfolded snapshots, and similar also to the S1state excitation energies of the two folded snapshots in water (vide supra). It thus appears that the S1state is hardly affected by the different solvent environments and the dynamics of folding and unfolding.
The S2state of the folded snapshot on the other hand has CT character: in contrast to the case of the water environment and
Fig. 11 Electron density difference plots for the first three excited singlet states ofa1GH
2O, calculated with TD-CC2 in the aug-cc-pVDZ basis in the QM/MM framework, at the TD-DFT/BHLYP CT minimum. Isosurfaces are plotted for 0.005 a.u., red refers to a decrease, green to an increase in the density upon excitation. (a) S1: CT state; |Dm| = 15.59 D (b) S2: (np*) state; |Dm| = 2.34 D (c) S3: (pp*) type state; |Dm| = 14.24 D.
Table 5 TD-CC2 QM/MM excitation energies o at the respective TD-DFT minima, calculated in aug-cc-pVDZ basis, respectively.DE (DE=Etot(CT)opt Etot(np*)FC) corresponds to the total energy difference of the optimised CT state and the (np*) at the FC point; solvent: MeOH
Structure State
FC point (np*) state CT state
DE[eV]
Type o[eV] Type o[eV] Type o[eV]
a1GMeOH S1 (np*) 3.78 (np*) 3.15 — — S2 (pp*) 4.70 (pp*) 4.66
S3 (pp*) 4.82 (pp*) 4.71
b1GMeOH S1 (np*) 3.84 (np*) 3.13 — — S2 (pp*) 4.58 (pp*) 4.43
S3 (pp*) 4.65 (pp*) 4.61
c1GMeOH S1 (np*) 3.96 — CT 2.28 0.84
S2 CT 4.28 (np*) 3.48
S3 (pp*) 4.61 (pp*) 3.75
Published on 11 September 2013. Downloaded by Universitaetsbibliothek Regensburg on 03/08/2016 11:59:40.
similar to the case of the isolated system, we find a low-lying CT state already at the FC point, only 0.32 eV above the S1state.
Here, in contrast to the water environment, the solvent shell relaxed for the electronic ground state also stabilizes the CT state (note that BP is soluble in MeOH, but not in water).
The density difference plots, dipole differences and relevant molecular orbitals related toa1GMeOHandc1GMeOHare given in the ESI† (Fig. SI-29-b, SI-29-c and SI-30).
In analogy to the calculations performed for 1G in water geometry optimizations on the S1state surface were also performed.
For the two unfolded conformers the resulting geometries overall look quite similar to those of the ground state. The distanced(C7–O39) measuring the degree of unfolding does not alter much.
The S1state excitation energy decreases by about 0.7 eV on going from the ground state to the S1state minimum, which is very similar to the situation of1G in water. The characters of the three lowest excited states at the S1state minimum geometry are (np*), (pp*), and (pp*), respectively, with the S3state corre- sponding to a local excitation on the BP, rather than on the G subunit. No CT state occurs.
The situation is entirely different for the folded snapshot:
during optimization on the S1 state surface, the S1 state switches character from (np*) to CT. An optimization of the respective state with (np*) character was not possible. The CT state minimum energy geometry definitely constitutes the deepest minimum; the total energy drops by about 0.8 eV on going from the FC point to the CT state minimum (cf.Table 5).
Furthermore, thed(C7–O39) distance contracts from 3.1 to 2.85 Å.
Population transfer from the excited (np*) to the CT state thus appears to be rather efficient.
The S2state at the CT state minimum geometry has now (np*) character. It is similar to the S1state at the Franck–Condon point with a dipole moment difference of |Dm| = 2.04 D. The S3state now corresponds to a (pp*) state localized on the G subunit with a very high dipole moment difference of |Dm| = 11.11 D, which looks quite similar to the S3 state at the CT minimum of1G in water (cf.Fig. 10c). The density difference plots and dipole moment differences related to the S1 (CT) state minimum of
c1GMeOHare given in Fig. 12.
From the QM/MM results discussed in this section the following conclusions, independent of the solvent environment, can be drawn: (i) for1Gin the unfolded form no low-lying CT state is found, which could quench the excited (np*) singlet state. Here, the lifetime of the excited (np*) state is primarily determined by intersystem crossing to the triplet state. (ii) For 1Gin the folded form, on the other hand, there indeed exists a low-lying CT state in some regions of the configuration space, which could quench the excited (np*) singlet state. In the methanol environment, provided that1Gadopts the folded form, the transition from the (np*) to the CT state should be more efficient than in the water environment, where the conical intersection apparently does not cross the downhill path from the FC to the S1state minimum point. However, in the methanol environment 1G predominantly exists in the unfolded form, hence transition from the (np*) to the CT state is overall not very frequent. On the other hand, in water,1G predominantly exists in the folded form, but the state transition itself is less efficient. We conclude that in both environments quenching of the S1state due to population transfer to the dark CT state can occur, but with rather low efficiency due to different reasons.
Nevertheless, the calculations predict that the lifetime of the (np*) singlet state is not solely governed by ISC, as is also seen in the experiments.
Discussion
The major goal of this study is to elucidate the conformational influence on photoinduced charge transfer in four different dinucleotides that were designed and synthesized as models to reduce the complexity of the conformational manifold present in double-stranded DNA. The first advantage of the models is that the influence of each of the four different DNA bases on the photo- physical behavior of BP can be studied exclusively. Therefore this approach provides the best chance to get a profound understanding of BP interactions in nucleic acids. The second advantage is that two different solvents can be chosen since the dinucleotides are soluble in H2O and MeOH. H2O represents the typical solvent for oligonucleotides in a pH-controlled buffer, whereas MeOH mimics a protic solvent54approximately the polarity of the inner part of double stranded DNA (DNA base stack). BP as an artificial nucleo- side, allows selective excitation of its photochemically important
1(np*) transition outside the typical nucleic acid absorption range (>300 nm), which is an important prerequisite to use the chromophore in photochemistry and photobiology.
Fig. 12 Electron density difference plots for the first three excited singlet states ofc1GMeOH, calculated with TD-CC2 in the aug-cc-pVDZ basis in the QM/MM framework, at the TD-DFT/BHLYP CT minimum. Isosurfaces are plotted for 0.005 a.u., red refers to a decrease, green to an increase in the density upon excitation. (a) S1: CT state; |Dm| = 19.75 D (b) S2: (np*) state; |Dm| = 2.04 D (c) S3: (pp*) type state; |Dm| = 11.11 D.
Published on 11 September 2013. Downloaded by Universitaetsbibliothek Regensburg on 03/08/2016 11:59:40.