Printed in Great Britain.
@ 1991 IUPAC
Some scattering studies of polymer microstructures, surfaces, and interfaces
Richard S. Stein
Polymer Research Institute, University of Massachusetts, Amherst, MA 01 003
A b s t r u
-
The use of light, x-ray, and neutron scattering and reflection techniques for the study of the structure of polymers in their solid state is discussed for polyethylene blends, liquid crystal polymers, and surfaceenrichment in polystyrene. For polyethylene blends, the role of one component in affecting the crystallization kinetics and morphology of the second is
demonstrated. With liquid crystal polymers, the importance of texture
coarsening accompanying disclination annihilation is discussed. Differences in surface and bulk concentration as affected by composition and molecular weight are shown for polystyrene blends
INTRODUCTION
The study of the scattering of radiation is a valuable means for the characterization of the structure of polymers in their solid state.
cases: (1) blends of polyethylenes, (2) nematic liquid crystalline polymers, and (3) surface enrichment with multicomponent polymers.
This approach will be illustrated for three
POLYETHYLENE BLENDS
Three types of polyethylene (PE) are commonly encountered: linear or unbranched high density polyethylene (HDPE), long chain high pressure low density polyethylene (LDPE), and linear low density polyethylene (LLDPE) which is a copolymer of ethylene with other alpha olefins such as butene, pentene, and octene. This contains a controlled number of short chain branches.
properties of blends (or alloys) of these materials,
For practical applications, it is of interest to explore the
It has been established (ref. 1) using small-angle neutron scattering (SANS), that commercial varieties of PEs are miscible in the melt. A question is, what happens when such melts crystallize? Possibilities are that they may either co-crystallize or
segregate. Since the species often have different melting points, the choice may be established using differential scanning calorimetry (DSC). With a HDPE/LLDPE blend, co- crystallization is often found with crystall/zation at high degrees of supercooling, whereas with HDPE/LDPE and LLDPULDPE blends, segregation is more common
(refs. 2,3). We shall concern ourselves with these latter cases.
The crystallization usually leads to spherulitic morphology. Light microscoby reveals that a single species of spherulite usually arises from the blend. With HDPE/LDPE, the spherulites are considerably smaller for pure LDPE than for HDPE. For most compositions of the blend, the spherulite size corresponds to that of the larger ones for the HDPE (refs.
2,3,4).
'This paper is dedicated to Professor Herman F. Mark, the "Gehimerat", my "hero" whose inspiration played a major role in my scientific life.
941
942 R. S. STEIN
These observations may be quantized using the small-angle light scattering (SALS) technique (ref. 5). Figure 1 shows a series of SALS crossed polarization (Hv) patterns obtained when a typical HDPEILDPE blend is isothermally crystallized at 60 deg. (ref. 2).
It is evident that the "four-leaf clover" type pattern is associated with the spherulitic morphology, and that the angle at which the scattering maximum occurs is related to their diameter, R, by (ref. 5)
where
q = (4 7c / h ) sin ( 012)
The larger pattern obtained for the LDPE spherulite corresponds to its smaller size.
Smaller and similar size patterns are obtained for HDPE and the blends indicating larger spherulites. Corresponding results are obtained from SALS measurements made using parallel (Vv) polarization.
The SALS studies may be extended by making quantitative intensity contour
measurements as a function of time during isothermal crystallization using an optical multichannel analyzer (OMA) scattering apparatus previously described (ref. 6 ) . Typical results are shown in Fig. 2 for Vv patterns obtained during isothermal crystallization of the pure components and their blends (ref. 4). It is seen that there is an initial increase in intensity of the pattern which is, at first, somewhat circularly symmetrical. With further crystallization, the intensity then drops and the pattern changes shape, becoming elongated in the polarization direction.
again increase its intensity.
At still later times, this elongated pattern may
1.08
0:12m, 5 9 3 7.00 9 05
LLDPE 4:11&
6 05* 4 . 5 0
"-
Io0rrit-l 1.57 2.00 5 07 7.93 a,'=?
Fig. 2. Vv patterns obtained with an optical multichannel analyzer during the isothermal crystallization of HDPE, LDPE and a 50/50 blend.
2 0 . 0
1 6 . 0 .
r + i2.0
n A
3
r
.o T I M E (minutes)
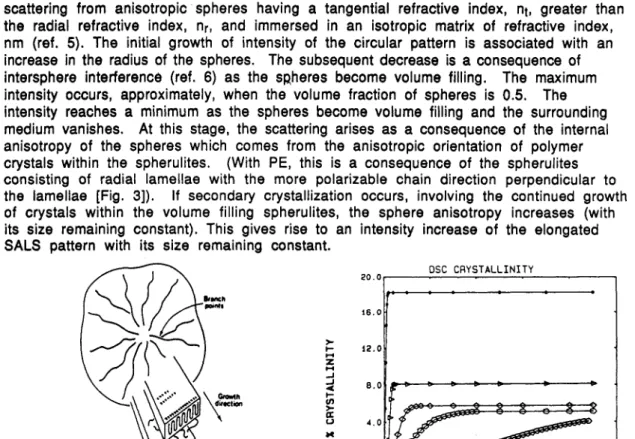
Fig. 3. The structure of a spherulite consisting of radial lamellae with polymer chain orientation
perpendicular to the lamellae (After J. D. Hoffman, a differential scanning calorimeter for linear G.T. Davis and J.I. Lauritzen, Jr. in Treatise on
' VOl. 3,
&%.
B. H a n z i c e P l % m ,New York, Chapt. 7 [1976]).
Similar analyses may be made for the Hv patterns. In this case, the initial circularly symmetrical pattern associated with the refractive index difference between the spherulites and the medium is not seen. Only the pattern associated with the sphere anisotropy appears, which, in this case, has the "four leaf clover" appearance.
These analyses permit the resolution of the crystallization kinetics into components associated with spherulite nucleation, growth, and secondary crystallization. Such a study for the blends has led to the conclusion that, for example, in a HDPE/LDPE blend, the HDPE component first crystallizes, giving rise to volume filling spherulites which initially contain the LDPE in its molten state. With not too low supercooling, these may become volume filling before appreciable crystallization of the LDPE occurs. The LDPE then crystallizes as "secondary crystallization" within these pre-existing HDPE
spherulites. Consequences of this mechanism are: (a) the size of the final spherulite is controlled by that of the first crystallizing component (the HDPE). This is true, even with relatively small amounts of this component (5%). (b) The rate of crystallization of the second crystallizing component (the LDPE) is greatly increased by the presence of the first. This occurs because the second component need not independently nucleate. Its crystals grow, probably epitaxially, upon the surfaces of the crystals of the first.
Figure 4 shows typical crystallization isotherms, determined by DSC, for LLDPE/LDPE blends. It is seen that the LLDPE crystallizes very much faster than the LDPE. However, the addition of rather small amounts of LLDPE to the LDPE gives rise to appreciably faster crystallization. Blends of HDPEILDPE show very similar behavior to those of LLPPULDPE.
Fig. 4. Crystallization isotherms obtained using low density polyethylene (LLDPE) (*), low density polyethylene (LDPE) (0) and blends, with (LLDPE/
LDPE) of 5/95 10/90 (Q), and 30nO (0) by weight.
t te
944 R. S. STEIN
An additional means for the study of the kinetics of the crystallization is by real-time x-ray diffraction using synchrotron radiation. This permits a measurement of the
variation of the degree of crystallinity with time during isothermal crystallization. Such studies, carried out in collaboration with Professor B. Chu of SUNY (Stony Brook) at the National Synchrotron Light Source at Brookhaven National Laboratory confirm the proposed crystallization mechanism (ref. 7).
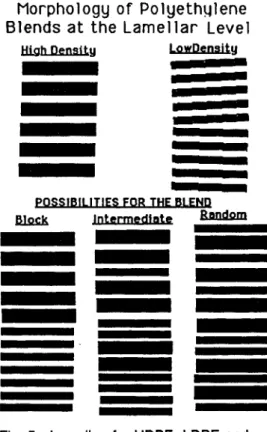
One may inquire about the morphology at the level of the crystalline lamellae. The crystals of the
two
species of the blend are separate in the case considered. It is possible for these to be segregated in separate regions of the polymer (within the spherulite) or to be intermingled, as shown in Fig. 5. This may be determined using small-angle x-ray scattering. If the lamellae are segregated, one expects to findseparate SAXS peaks characteristic of the spacings of the two species. However, if they are intermingled, a single peak is expected corresponding to an intermediate spacing. The observation is that of an intermediate situation indicating partial segregation to an extent dependent upon the degree of supercooling. Greater supercooling results in less segregation. This may be understood on the basis of the exclusion of lower melting component during the crystallization of the higher melting one with the aid of Fig. 6. The excluded polymer molecules lie between the lamellae of those that first crystallize.
Since the amorphous chain dimensions may be of the order of the distance between lamellae, the configurations of the chains are restricted resulting in a decrease in their entropy. Thus, their escape from this interlamellar region results in a decrease in free energy and tends to occur. Whether or not it does depends upon whether it can diffuse out of this interlamellar region before it crystallizes. At high temperature, diffusion is fast and crystallization is slow so segregation occurs.
diffusion is slow and crystallization is fast, so the crystals grow between the lamellae, resulting in their being intermixed. Synchrotron measurements have also been carried out to follow these kinetics of lamellae formation (ref. 7).
However, at low temperature,
Morphology o f
Polyethulene Blends a t the Lamellar Level
l l L g h u LowDensitY
L
- -
__I LIT h i s r e p r e s e n t s a p o s i t i v e A S .
AG * A H
-
T A SFig. 6. The exclusion of a non-crystalline component from the interlamellar region during crystallization.
Fig. 5. Lamellae for HDPE, LDPE and a blend where they are segregated or intermixed.
These observations made during the crystallization of polyethylene blends are generally applicable to blend crystallization and indicate the important effect of interaction between blend components on the crystallization kinetics and the resulting morphology and properties.
LIQUID CRYSTALLINE P O L Y M E R S
Rather than packing randomly, stiff polymer molecules tend to arrange themselves in ordered structures. If molecular irregularity is such as to prevent packing in ordered crystalline lattices, the structure may be that of a liquid crystalline polymer in which molecules have a common direction of orientation (the "director") but are disordered in position. A single textured material is one in which all of the molecules in the sample have common orientation. This is the lowest energy state but is unlikely for kinetic reasons, Thus, one usually achieves a "multi-textured" arrangement in which there is local orientation in "domains" which are randomly oriented with respect to each other (Fig, 7). This picture implies discrete boundaries between domains which represent regions of high energy and are unstable. The lowest energy means for packing such stiff molecules was explored by Charles Frank (ref. 8 ) who proposed the existence of
disclinations.
represent anisotropic molecules. The figure shows the boundary of a region where, on the right, the molecules are vertically orientated, while on the left, they are horizontal.
There is a transition zone in which the orientation changes from vertical to horizontal.
This contains a singularity called a "disclination" which may be characterized by a number,
s,
called its "strength" which, in this case, iss
= +1/2. The energy associated with a disclination may be calculated in terms of force constants associated with the misalignment of neighboring molecules. The orientation pattern may be represented schematically, as shown in Fig. 8, by lines which are tangents to the orientation direction.A typical disclination is shown in Fig. 8 where the small ellipsoids
This represents a "disclination field".
Slqle Texture XUlWOrBn
Fig, 7. Single textured and domain structures for a liquid crystalline polymer.
ition o f D i s
I
II)
= strength
= + 1/2
,cI inations
o f disclinati on
Fig. 8. The arrangement of anisotropic molecules in a liquid crystal
disclination of strength,
s -
112. The lines are tangents to the director directions.946 R. S. STEIN
Frank has shown that disclinations represent arrangements of minimum energy. These are quantized in that there are particular stable disclinations represented by values of
s
that are integral multiples of 1/2 as shown in Fig. 9, such as s
-
112, 1, 3/2, 2, etc. They may have positive or negative sign.disclinations have least energy and are most probable. The commonly observed "schlieren texture" seen when nematic liquid crystals are viewed between crossed polars may be explained in terms of arrays of disclinations.
The energy depends on s2, so that the s = 1/2
S - h 51 -n 5.-1
511. C.0 5=1, caw 5.1. c=xn
Fig. 9
Another prediction of the Frank model is that disclinations exert forces on each other. As with electric charges, disclinations of the same sign repel each other whereas those of opposite sign attract. Liquid crystalline materials have mobility, so their attraction results in their diffusion toward each other. When they combine, the resulting disclination has a strength equal to the sum of the strengths of the combining disclinations.
-1/2 leads to s = +1/2
-
112 = 0, signifying their annihilation.In particular, the combination of disclinations of strengths of +1/2 and
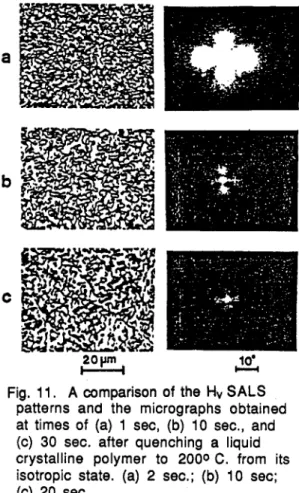
The small-angle light scattering from such liquid crystalline polymers leads to patterns of the sort shown in Fig. 10. These have been interpreted (ref. 9) as arising from the orientation fluctuations associated with the disclination field. The decrease in the size of the patterns with time is a consequence of the increase in the distances over which orientations are correlated. This occurs as a consequence of the increasing average separation of disclinations associated with a decrease in their number as a result of their annihilation as they diffuse together. This interpretation is further confirmed by comparison with micrographs, as shown in Fig. 11. The decrease in size of the SALS pattern is associated with an increase in the coarseness of the texture. It is noted that, in this case, changes are occurring in second time scales, which are comparable with times encountered in the processing of such materials.
The position of the maximum in the Hv scattering maximum is related to the distance, D, over which orientation correlations occur by the approximate relationship
The value of D is related to the average distance between disclinations and increases as they are annihilated.
Fig. 10. Hv small-angle light scattering patterns obtained a s a function of time at 1500
C
following the quenching of a liquid crystalline polymer from its isotropic state. (a) 1 min; (b) 30 min; (c) 5 hrs.a
f o r m I c-.l 10'
Fig, 11. A comparison of the Hv SALS patterns and the micrographs obtained at times of (a) 1 sec, (b) 10 sec., and (c) 30 sec. after quenching a liquid crystalline polymer to 2000 C. from its isotropic state. (a) 2 sec.; (b) 10 sec;
(c) 20 sec.
A plot of ( l / q max.) vs time at various temperatures of quench is shown in Fig. 12. It is noted that the growth in D is more rapid at higher temperatures, being diffusion
controlled. Also, there appears to be a common origin, with the initial value of (l/q max.) (or D) being independent of degree of quench. We are attempting to determine whether this is a general result or if it may arise from heat transfer limitations.
indicates that the transition from the isotropic to the liquid crystalline state may follow different kinetics than for crystallization where crystal size varies inversely with degree of quench.
A plot of In ( l l q max,) vs In (time) is given in Fig. 13.
If true, it
:
0.61
0.0 i4.0 28.0 42.0 56.0 70.0 TIHE (mln.)
Fig. 12. The variation in ( l / q max) with time for a sample at various temperatures of quench. (a) 130OC: (b) 140OC; (c) 150OC;
(d) 160%
- 5 . o c
0 . 5 1.0 1.5 2.0 2 , s 3 . 0
LOG (t/mln.l
Fig. 13. The variation of In ( l / q max) with In (time) for a sample
quenched to 1300
C.
948 R. S. STEIN
This is approximately linear, suggesting the relationship
D = A t n (4)
where the exponent of time, n, usually lies in the range of 0.3
-
0.4. This dependence can be accounted for on the basis of a model of diffusion of disclinations following a Frank- type force law.Liquid crystals may readily be oriented by mechanical, electrical, or magnetic fields.
This usually involves the reorientation of local directors in a manner such as to minimize their energy with respect to the applied field Their ability to reorient relates to the nature of the disclination field. The diffusion of disclinations toward or away from each other will be driven by the forces associated with the applied field as well as by the forces of their mutual interaction. Also, it seems likely that the reverse process to disclination annihilation, that of disclination "pair production", analogous to the Frank- Read process (ref. 10) of dislocation pair production that has proved so useful in describing the mechanical properties of crystalline solids. Thus, we believe that the understanding of the dynamics of disclinations is of utmost importance in the description of the response of liquid crystalline systems to applied fields. The observation of changes in the SALS accompanying such behavior can be very useful.
We have observed changes in Hv SALS patterns occurring upon shearing thermotropic liquid crystalline polymers between glass microscope slides. As can be seen in Fig. 14 (ref. 1 l), the pattern becomes distorted in a manner associated with disclination rearrangement. Studies following this approach (refs. 11,12) are proving extremely useful in describing the rheo-optics of these systems.
A second type of experiment involves studying the effect of molecular weight upon surface enrichment. With a mixture of low and high molecular weight polystyrene samples, using deuterium labelling of one of the species, it is found that the low molecular weight component tends to migrate to the surface (ref. 14). (It is necessary,
of course, to separate the molecular weight effect from the isotope effect.) The reason for this preference for the low molecular weight component going to the surface may be two-fold: (a) Chains near the surface are restricted in conformation and have lower entropy. The effect may be larger for high than for low molecular weights, and (b) chain ends prefer to be at the surface rather than within the bulk of a polymer. Low molecular weight species have more ends. This latter effect may be dependent upon the nature of the chain ends which may be chemically different from the rest of the molecule, being determined by the initiation and termination steps of polymerization. This presents the possibility for controlling molecular weight enrichment and surface properties through modification of the nature of the chain ends.
A third structural variable that we have studied is that of molecular topology. For example, cyclic polymer molecules have different entropy constraints than linear ones.
Furthermore, they do not have ends. Experiments are in progress (in collaboration with
G.
Hadriiannou) involving studies of mixtures of cyclic polymers with linear ones and of cyclic ones
of
different molecular weight with each other.C O N C L U S I O N S
Multicomponent polymer systems are complex and have properties which depend upon phase separation, crystallization, orientation, and imperfection content.
related optical methods can prove very useful in characterizing these changes.
Scattering and
N E U T R O N REFLECTIVITY F R O M POLYMER SURFACES
It is evident that polymer surfaces are of great importance in their application. The appearance, feel, wear, and adhesion of polymers relates to the nature of their surfaces.
It is also apparent that the surface and bulk properties of polymers may differ, especially when dealing with multicomponent systems.
Various techniques are available for the study of surfaces, including contact angle
measurement, fourier transform infrared (FTIR) spectroscopy, attenuated total reflection (ATR) spectroscopy, x-ray photoelectron spectroscopy (XPS or ESCA), Rutherford back scattering (RBS) or forward recoil spectroscopy (FIBS), and SIMS. Recently the related techniques of x-ray and neutron reflectivity have been applied for such studies.
When a beam of radiation passes through a surface from a high refractive index medium to a low, it is bent toward the surface. When the angle to the surface is reduced to a
"critical angle", the refracted beam travels parallel to the surface and the reflectivity approaches unity. At smaller angles to the surface, there is no refracted beam, and the incident beam is totally reflected. Thus, as the incident angle is reduced, there is an abrupt increase in reflectivity as one passes through the critical angle.
The abruptness of the change in reflectivity with angle depends upon the nature of the interface.
wavelength of the radiation being used, the reflectivity increase becomes more gradual.
It is possible to model the interface so as to account for the observed reflectivity variation.
It is useful to use x-ray or neutrons for such experiments since (a) their wavelengths are in the range of 0.1
-
2.5 rnp which is a useful one for exploring surface structure, and (b) the refractive indices for most materials for these is less than unity, so that total reflection occurs when passing from air into the material, making the experiment easier.Neutrons have an advantage over x-rays in that their "refractive index" is very sensitive to the replacement of hydrogen by deuterium, so that in a multicomponent mixture, components may be labelled by such isotopic substitution.
If the interface is rough or diffuse over a distance scale comparable with the
$
- b
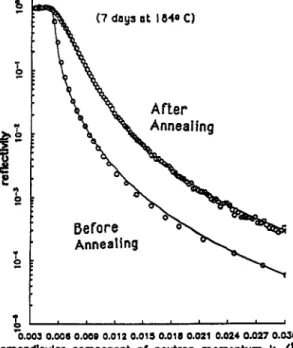
Fig. 15. The variation in neutron reflectivity with q for a sample of polystyrene contain- ing 10% deuterium-substituted polystyrene before and after annealing for 7 days at 1840 C. Here, k = ( 2 d X ) sin (W2).
' 0 '
0.003 0.006 0.009 0.012 0.015 0.010 0.021 " ' " 0.024 0.027 " 0.030 Iperpondlculor component of neutron mommtwn, k
/i
950 R. S. STEIN
An illustration of the application of this technique is shown in Fig. 15 (ref. 13), where the neutron reflectivity is plotted as a function of q for a sample of polystyrene (PS) containing 10% of deuterium-substituted polystyrene (d-PS). The reflectivity is also shown after annealing the sample, and it is seen to change in a more gradual manner with q. The interpretation of this experiment is that, initially, the d-PS is uniformly mixed with the h-PS, but, with annealing, the d-PS migrates to the surface. Typically, with a bulk concentration of d-PS of lo%, the surface concentration may approach 40%. This surface enrichment and the accompanying concentration gradient of d-PS may be understood in terms of the differences in interaction energies of h-PS and d-PS previously observed using SANS.
Acknowledgements
The work reported in this paper represents contributions from a large number of students, coworkers, and collaborators. With fear of omission, the names of the following should be mentioned:
Polvethvlene BlenclS: S . R. Hu (PRC), T. Kyu (Univ. Akron), M. Ree (IBM), M. Satkowski (Proctor & Gamble), P. Esnault (Michelen), S. McGuire (Monsanto), B. Chu (SUNY, Stony Brook), D. Wu (Dupont), and F. Stehling (Exxon).
E.
Goldberg (MIT), H.H. Winter and R. W. Lenz (Univ. Mass.), R. Gaudiana and N. Weeks (Polaroid).id Crvstak: S. Rojstaczer (Occidental), T. Hashimoto (Kyoto Univ.) B. Hsaio (Dupont),
Neutron Reflectivity: R. Composto (Univ. Penn.), T. Mansfield (Univ. Mass.), G. Felcher, A. Mansour and A. Karim (Argonne), E. Kramer and R. Jones (Cornell Univ.), and
G. Hadziioannou (Univ. Gronigen)
The work reported was supported by a number of organizations, primarily including the National Science Foundation (Division of Materials Research), the Office of Naval Research, the Materials Research Laboratory of the University of Massachusetts, the Center of Excellence Corporation of Massachusetts, and the Polaroid Corporation. We appreciate obtaining samples from the Exxon Chemical Company and the granting of neutron scattering beam time by Oak Ridge National Laboratory, the National Institute for Standards and Technology, Argonne National Laboratory, and Los Alamos National
Laboratory and of synchrotron beam time by the National Synchrotron Light Source at Brookhaven National Laboratory.
1.
2.
3.
4.
5.
6.
7.
8.
9.
10.
11.
12.
13.
14.
REFERENCES
a,
71 (1987).M. Ree and R. S. Stein, in preparation.
25, 89 (1987).
S.R. Hu, T. Kyu and R.S. Stein,
a,
105 (1987).T. Kyu, S.R. Hu and R.S. Stein, Sci.
!eolvm.
Phvs. F a M. Ree, T. Kyu and R.S. Stein, 3. Polvm. Sci. IPolvm. Phvs. F a M.B. Rhodes and R.S. Stein, 1873 (1960).R.J. Taber, M.B. Long and R.S. Stein, J. P o l v r ~ & L IPolvm. Phvs.
M. Ree, R.S. Stein, H.H. Sung, D.Q. Wu, J.C. Phillips, A. LeGrand and B. Chu, Macromolecules, 21. 1180 (1988).
F.C. Frank, D i s c . v SOL a 1 9 (1958).
T. Hashimoto, A. Nakai, T. Shiwaku, H. Hasagawa, S. Rojstaczer and R.S. Stein,
Macromolecules, 22, 422 (1989)
F.C. Frank and W.T. Read, ehys. Rev,,
a,
722 (1950)S. Rojstaczer, Ph.D. Dissertation, Univ. of Mass., Amherst, MA, pp.102-105 (1989).
B.S. Hsiao, R.S. Stein, K. Deutscher and H.H. Winter, -Part B. P&m,
P-
Ed. ,
28, 1571 (1990).R.Jones, L.Norton, E.Kramer, R. Composto, R.S. Stein, T. Russell, A. Mansour,
A. Karim, G. Felcher, M. Rafailovich, J. Sokolov, X. Zhao and S. Schwartz,
EuroDhvsics Letters,
11, 41 (1 990).R.J. Composto, R.S. Stein, G.P. Felcher, A. Mansour and A. Karim,
Materials
Res- 2041 11982).Pf OL,
, 485 (1990).