The Tip of the Iceberg: On the Merits of Finding Security Bugs
NIKOLAOS ALEXOPOULOS,Technical University of Darmstadt, Germany
SHEIKH MAHBUB HABIB,Continental AG, Germany
STEFFEN SCHULZ,Intel Labs, Germany
MAX MÜHLHÄUSER,Technical University of Darmstadt, Germany
In this paper, we investigate a fundamental question regarding software security:Is the security of SW releases increasing over time?We approach this question with a detailed analysis of the large body of open-source software packaged in the popular Debian GNU/Linux distribution. Contrary to common intuition, we find no clear evidence that the vulnerability rate of widely used software decreases over time: Even in popular and
“stable” releases, the fixing of bugs does not seem to reduce the rate of newly identified vulnerabilities. The intuitive conclusion is worrisome: Commonly employed development and validation procedures do not seem to scale with the increase of features and complexity – they are only chopping pieces off the top of an iceberg of vulnerabilities.
To the best of our knowledge, this is the first investigation into the problem that studies a complete distribution of software, spanning multiple versions. Although we can not give a definitive answer, we show that several popular beliefs also cannot be confirmed given our dataset. We publish ourDebian Vulnerability Analysis Framework (DVAF), an automated dataset creation and analysis process, to enable reproduction and further analysis of our results. Overall, we hope our contributions to provide important insights into the vulnerability discovery process and help in identifying effective techniques for vulnerability analysis and prevention.
CCS Concepts: •Security and privacy→Software and application security; •General and reference
→Empirical studies.
Additional Key Words and Phrases: Empirical Study, Vulnerability Discovery Rate, Debian GNU/Linux ACM Reference Format:
Nikolaos Alexopoulos, Sheikh Mahbub Habib, Steffen Schulz, and Max Mühlhäuser. 2020. The Tip of the Iceberg: On the Merits of Finding Security Bugs.ACM Trans. Priv. Sec.1, 1, Article 1 (January 2020), 33 pages.
https://doi.org/10.1145/3406112
1 INTRODUCTION
Modern Free and Open Source Software (FOSS) systems comprise a multitude of interacting components, by different developers. Such software products are used in various critical aspects of our everyday lives, such as telecommunications, hospitals, transportations, etc., and therefore their security has become a critical issue. A number of high-profile vulnerabilities have gathered
Authors’ addresses: Nikolaos Alexopoulos, alexopoulos@tk.tu-darmstadt.de, Technical University of Darmstadt, Germany;
Sheikh Mahbub Habib, sheikh.mahbub.habib@continental-corporation.com, Continental AG, Germany; Steffen Schulz, steffen.schulz@intel.com, Intel Labs, Germany; Max Mühlhäuser, max@informatik.tu-darmstadt.de, Technical University of Darmstadt, Germany.
Permission to make digital or hard copies of all or part of this work for personal or classroom use is granted without fee provided that copies are not made or distributed for profit or commercial advantage and that copies bear this notice and the full citation on the first page. Copyrights for components of this work owned by others than ACM must be honored.
Abstracting with credit is permitted. To copy otherwise, or republish, to post on servers or to redistribute to lists, requires prior specific permission and/or a fee. Request permissions from permissions@acm.org.
© 2020 Association for Computing Machinery.
2471-2566/2020/1-ART1 $15.00 https://doi.org/10.1145/3406112
media attention over the last years. For example,Shellshock(CVE-2014-6271) was a vulnerability of the widely used UNIX Bash shell that allowed attackers to gain complete control of a victim’s machine without any prior knowledge of their credentials. Shortly after its disclosure, thousands of attacks took place that included compromising a number of machines and using them as a botnet to launch DDoS attacks [17]. Another infamous vulnerability,Heartbleed(CVE-2014-0160), was also discovered by white-hat hackers, but resulted in several exploits, like the leak of millions of hospital patient data [16]. The fact that known (discovered by white-hats) and patched vulnerabilities can cause such great disturbance, indicates that yet unknown (to the vendor and/or the public) vulnerabilities (zero-days), which can potentially affect billions of devices, are an even greater threat. At the same time, the amount of discovered security bugs is increasing at an impressive pace with over 20 thousand new vulnerabilities discovered through HackerOne’s bug bounty program in 2016 alone [18], while the amount of CVEs reported in each of the years 2017, 2018, 2019 was rougly double the amount reported for any previous year [14].
The security community has come up with various defense mechanisms to prevent, locate and fix vulnerabilities, includingformal verification, static/dynamic code analysisandfuzzing. Unfortunately, formal verification often requires a lot of manual extra work, and does not readily scale to large SW projects. Even widely used, high-risk components such as theopensslcryptographic library are not formally verified. In recent years, significant resources have therefore been allocated to automated vulnerability discovery. State of the art static analysis tools (e.g. [8, 10, 44]) offer ways to check software for possible vulnerabilities pre-release by pinpointing risky code segments. Additionally, there has been significant progress in the area of dynamic analysis and fuzzing tools (e.g. [30, 34, 38], as well as the AFL fuzzer1), that discover vulnerabilities via testing the runtime behaviour of the program. In practice, even high-criticality SW that was subject to extensive validation will often still contain (security) bugs, e.g. [9, 23].
There is a general feeling among security researchers and practitioners that the rise in the overall number of reported vulnerabilities in recent years is attributed to the sizeable increase of the codebase, and hence the increase of the overall attack surface, while the quality of established and widely used software components is improving. For instance, Ozment and Schlechter [28]
report a gradual decrease in the number of foundational vulnerabilities of the OpenBSD operating system. In this paper, we set out to answer a fundamental question regarding the state of open source software security, with the popular Debian GNU/Linux ecosystem as a case study:Is the security of software increasing?- Can we trust software more than in the past or are we introducing vulnerabilities at a faster rate than we are finding them? In the process of trying to find an answer, we developed theDebian Vulnerability Analysis Framework, a system for automatically collecting relevant data from publicly available sources, and for applying different data analysis techniques in a reproducible manner.
We choose the Debian distribution for our case study due to three important characteristics: (a) it is one of the biggest and most popular collections of FOSS in existence; (b) its policy of only adopting critical patches into the stable release makes it very amenable to testing our “maturing”
hypotheses; (c) security is handled rather consistently, using a dedicated team with transparent workflows, public reports and status tracking.
While the dataset is limited to Debian, it is likely that the results can be generalized to all general- purpose Linux distributions because the vast majority of SW projects and code base underlying the various distributions is identical: A vulnerability in a particular SW suite will affect the respective package regardless of how it is distributed. In fact, our dataset likely underestimates the vulnerability rates of many other popular distributions since the Debian release policy is known to be rather
1http://lcamtuf.coredump.cx/afl/
conservative. However, the precise effects of program selection or release policy is not currently known but in fact it is one of the motivations of our research. More information on how Debian works can be found in Section 2.
Methodology and contributions:We approach our central question in three steps, by forming three main hypotheses of increasing depth and detail, which we investigate in dedicated sections by analyzing plots and employing statistical tests to confirm the statistical significance of our observations. Our three main hypotheses and a short summary of our results is given in Table 1.
– H1: The vulnerability rate of widely used FOSS is showing signs of maturity (Sec- tion 4):We found no clear signs of maturing behavior (e.g. as expected by standard software reliability models) when looking into the whole Debian distribution, even when consider- ing a single stable release over its entire lifetime. More specifically, for popular packages that underwent major updates, although a maturing behavior was observed until the next version is released, the introduction of the new version caused a surge in the vulnerability rate of the older version, indicating that maturity does not necessarily come with time.
Generally, even experienced developer teams find it hard to produce secure software.
– H2: There are less severe bugs and certain types are decreasing (Section 5): H2.1 (severity): Although the ratio of high-severity vulnerabilities compared to the total is drop- ping, their absolute number does not show a sign of decrease. H2.2 (types): Bug type ratio also appears stable over time, with memory indexing (CWE-118) and semantic resource control (CWE-664) bugs accounting for more than half of all vulnerabilities in recent years.
Again no maturing behavior is observed for any of the main vulnerability types. Tools and methodologies targeting specific types don’t seem to contribute to maturity until now.
– H3: Vulnerability prices for FOSS in bug bounty programs are rising (Section 6):
Our investigation of a community-driven bug bounty program showed that there is no increase in the prices paid, even when considering only high severity vulnerabilities of pop- ular FOSS. Interestingly, the bounties paid on the platform overall, even when considering proprietary programs, have remained stable over time. Furthermore, the number of bugs found in the program showed a decreasing trend, showcasing: (a) its effectiveness in the initial stages, and (b) its relative ineffectiveness in the long term (considering bugs were found at a non-negligible rate outside the program and prices did not increase). Our results are in contrast to recent reports of huge rewards offered for zero-days by offensive-oriented buyers.
Table 1. Short summary of results and contributions
Regarding our main question, we conclude that there is no maturing effect evident for the security of FOSS. An interpretation could be that the current practice of vulnerability discovery is similar to “scratching off the tip of an iceberg”; it rises up a little2, but we (developers and the security community) are not making any visible progress. Our analysis is, to the best of our knowledge, the first to address the issue looking into such a large variety of software (whole Debian distribution), spanning multiple versions.
2Typically about one tenth of an iceberg’s volume is above water (the “tip”), while the rest is submerged. By removing volume (“scratching”) from the tip, part of the previously submerged portion will rise above the surface, so that the ratio is preserved.
Testing these hypotheses required analyzing data from Debian’s security team’s advisories to retrieve the vulnerability identifiers that affected the package versions of the stable distribution at each point in time. We repeated the procedure with the reports of the LTS (long-term support) team. Then, we retrieved the CVE numbers of those bugs, allowing us to better estimate when they were first publicly disclosed. We used this data to search for trends in the vulnerability rates of Debian overall, specific stable releases, and single programs. By utilizing the National Vulnerability Database (NVD), we then matched the CVEs with their assigned severity score (CVSS) and type (CWE), allowing us to make further inferences on trends considering bug severity and type (see H2).
Finally, to investigate the hypotheses relating to bug bounty prices (H3), we retrieved all publicly available data from the HackerOne platform and analyzed it. In each case, the Laplace trend test and an ordinary least squares regression (OLS) were used to support our observations from the manual analysis (plots) of the data.
To achieve our results, we developed theDebian Vulnerability Analysis Framework(DVAF) – see Section 3 – for vulnerability data analytics on software contained in Debian GNU/Linux. It automatically mines publicly accessible vulnerability repositories, such as the National Vulnerability Database (NVD) and Debian Security Advisories (DSA), in order to create datasets for applying different data analysis techniques in a reproducible manner. We publish theDVAFto enable further reproducible analysis (e.g. by investigating some of the questions we raise later in the paper).
2 BACKGROUND & TERMINOLOGY
In this section we briefly go over some necessary material for the comprehension of the paper.
The Debian GNU/Linux distribution: Debian is a distribution of the GNU/Linux operating system including over 40 000 software packages, covering a significant portion of all widely used FOSS in existence [5] (for comparison 4 000 in Red Hat). All packages are open source and free to redistribute, usually under the terms of the GNU General Public License [37]. Debian officially supports 9 different architectures, and several other operating systems (e.g. Ubuntu, Raspbian) are based on it. It follows a conservative maturing release cycle aiming for maximum production-level stability and security for itsstablerelease. The stable release is updated about every 2 years and only patches are applied to the packages during its lifetime. In the meantime, developers and testers have time to examine and patch the newer versions of the packages to be introduced in the next stable release. In this phase, these packages comprise thetestingdistribution. Debian releases are characterized by a number and a name, traditionally from Toy Story3. Security vulnerabilities are handled in a transparent manner by the Debian security team [1]. The security team reviews incident notifications for the stable release (only) and after working on the related patches, publishes a Debian Security Advisory (DSA). The DSAs contain detailed information on the vulnerability, including the affected packages and the corresponding CVE numbers.
Statistical trend tests: To support observations made via visual inspection of plots, it is often required to provide evidence that the observations carry statistical significance. Therefore, specif- ically in the field of reliability theory, the Laplace trend test has been traditionally employed to support evidence of a decrease in the rate of failures of a system. It tests if the distribution follows a Poisson process or there is an increase or decrease in the rate of events (failures) taking place.
Although the Laplace test is mathematically not entirely suitable for the scenario of vulnerability discoveries [29] (as it does not satisfy the independence requirement), it has been widely used by seminal previous work [28, 32, 45] in the area and therefore it is also employed by us (always with a pinch of salt). Although statistical tests are important to support our observations, they do not
3For an overview of Debian Releases see https://www.debian.org/releases/.
offer much to the presentation of the paper, and as such, graphical representations of the Laplace tests, as well as the complete statistical test results are confined to the appendix.
3 DATA COLLECTION AND THE DVAF
During the dataset creation process, an important goal was to construct a platform that would provide the means for researchers to validate and extend our results in a reproducible way. Therefore, we offer an extensible platform that automatically generates up-to-date datasets via parsing relevant repositories. The framework consists of two basic components, data collection (Input) and data analysis (Analysis). These abstractions are in turn instantiated by various modules in an extensible way, as shown in Fig. 1. Our implementation consists of around 1 000 lines of python3 code and is available as open source on github4.
Data Collection
DLA collect DSA collect
CVE collect Bounty collect
...
...
Data preparation
Analysis Plot Laplace test Linear Regression
Fig. 1. The DVAF’s extendable architecture and workflow The currently implemented modules work as follows:
DSA Input:Debian Security Advisory text is automatically collected via downloading the html source from Debian’s security information pages, and then applying the relevant filters and regular expressions to extract the names of the affected packages, the date of the advisory, and the associated CVE references. The URLs of DSA pages are of the form https://www.debian.org/security/YYYY/
dsa-NNNN, withYYYYstanding for the year when the DSA was reported, andNNNNfor the unique DSA identifier.
DLA Input:Debian long-term support advisories are automatically collected by parsing the text of entries of thedebian-lts-announcemailing list. The same information points as in the case of the DSAs are extracted from the mail text. DLAs are available over https with URLs of the form https://lists.debian.org/debian-lts-announce/YYYY/MM/msgXXXXX.html.
CVE Input:CVE data, including the date of the CVE, and various metadata (CVSS score, CWE type etc.) are collected by employing thecve-search5tool, a tool for local lookups on reported CVEs.
Bug bounties Input:Bug bounty data are collected by scraping the HackerOne platform’s publicly visible portion. All available information is obtained (product affected, date, bounty amount, etc.)
4https://github.com/nikalexo/DVAF 5https://github.com/cve-search/cve-search
by utilizing the platform’s API6.
Data preparation:The preparation of the data consists of manual corrections of known mistakes in the vulnerability reports, dealing with package versioning and possible date differences between the DSA and CVE reports, and formatting the data in a standard, transferable format.
For example, DSA-2103 does not include a CVE reference, although CVE-2010-3076 references the DSA and matches its description. We identified a number of such issues. Furthermore, due to trademark issues regarding the Mozilla logo, Mozilla products were distributed under alternative names in Debian from 2006 to 2016 (Iceweasel instead of Firefox, Iceape instead of Seamonkey, Icedove instead of Thunderbird). Also, some packages have names based on the software version they distribute (e.g. php5 and php7.0), while others, such as the Linux kernel have changed their naming conventions over time (from kernel-* to linux).
Note that the manual effort is a one-time process, as appendable lists with package name changes etc. are maintained as configuration files, and the rest of the process is automated. As the date of vulnerability disclosure, we choose the earliest of the dates reported in the DSA and the corresponding CVE. Vulnerabilities for source packages are grouped by month and a time-series of vulnerability incidents is created for each source package. For most of our studies, we created a single time-series for all the versions of a package using regular expression rules, however this can be configured. All data points are stored in JSON text representations of python dictionaries.
Analysis functionality:To check our hypotheses, we developed a number of analysis and plotting scripts and made an effort to render them re-usable to the extent possible. The basis of the framework can be used for other studies or as a starting point for software security metrics and risk assessment methodologies.
4 VULNERABILITIES IN DEBIAN
linux samba
python-django quagga wpa sendmail movabletype-opensource pdfkit dnsmasq wget evince
egroupware traceroute-nanog
acpid tnef cscope websvn xerces-c w3m-ssl
kdelibs-crypto lurker libdbd-pg-perl libsoup2.4 rtmpdump
mtr nethack neon simpleproxy cgiirc nagios-plugins aria2
extplorer mod-wsgi
tidy intel-microcode
10
110
210
3Vulnerabilities
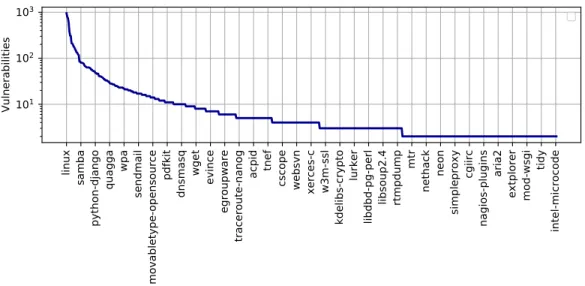
Fig. 2. The distribution of vulnerabilities per package (years 2001-2018). Every twentieth package name appears on the x axis for space reasons. The y axis is logarithmic. Packages with at least two vulnerabilities are taken into account.
6During the revision process of the paper, we noticed that the new HackerOne API is now only available for a fee, whereas an older version of the API was available for free during our study.
101 102 103 Vulnerabilities 10−2
10−1 100
ccdf
data power-law fit
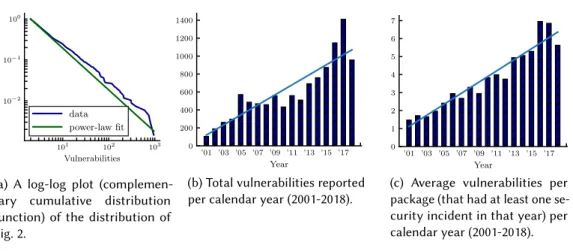
(a) A log-log plot (complemen- tary cumulative distribution function) of the distribution of Fig. 2.
’01 ’03 ’05 ’07 ’09 ’11 ’13 ’15 ’17 Year
0 200 400 600 800 1000 1200 1400
Totalvulnerabilities
(b) Total vulnerabilities reported per calendar year (2001-2018).
’01 ’03 ’05 ’07 ’09 ’11 ’13 ’15 ’17 Year
0 1 2 3 4 5 6 7
Averagevulnerabilitiesperpackage
(c) Average vulnerabilities per package (that had at least one se- curity incident in that year) per calendar year (2001-2018).
Fig. 3. Vulnerabilities: distribution and trends.
In this section, we present an overview of the Debian ecosystem w.r.t. its security characteristics and draw some interesting conclusions, aiming to investigate H1. Contrary to previous studies (e.g. [2, 12]), we do not investigate the vulnerability rate of specific versions of software during their development cycle and immediately after their introduction, but the software versions that are included in the corresponding stable releases of Debian. The question we ask ourselves in this section is whether there are signs that the quality of software (w.r.t. security bugs) is increasing over time; in other words, whether we have reached the point where the vulnerability discovery rate in stable versions of popular software is slowing down. Therefore, we choose to study the raw vulnerability numbers discovered in Debian packages, rather than their vulnerability density, a choice that we also discuss later on. In Fig. 2, we see the distribution of vulnerabilities among source packages of Debian for the years 2001-20187. In the figure, packages that had at least two vulnerabilities in the specified time frame are included, yielding a total of 634 source packages. An additional 561 source packages had a single vulnerability and were not included in the figure for readability reasons (the complete figure is available in the appendix).
The rich club effect: Interestingly, the distribution is characteristically heavy-tailed (notice that the y axis is logarithmic) with a few packages dominating the total vulnerabilities reported and a long tail of a large number of packages with only a few vulnerabilities. Inspecting the plot (Fig. 3a) of the probability distribution of the data in (double) logarithmic axes, we can observe a near-straight line, indicative of a potential power-law distribution (Zipfian). Power-laws are heavy-tailed distributions that are the result of generative mechanisms like scale-free networks or the distribution of wealth in society (Pareto distribution). Following detailed statistical testing using the seminal methodology of Clauset et al. [13] and thepowerlawpackage [4], we fit a power-law of the formp(x) ∼x−k,x >xminwithk =2.02 andxmin =2 , wherexis the number of vulnerabilities andptheir probability density function8. In short, we observe that the majority of vulnerabilities is discovered in a small set of packages, with the rest contributing little to the total number. Although
7Our analysis in this paper is limited to data until the end of 2018 for two reasons. First, it is the last completed year at the time of writing. Second, some time is needed for entries in the NVD to be filled with information (e.g. severity, type) regarding discovered vulnerabilities.
8It is common in literature (e.g. [42]) to ignore the light lower tail and focus on the heavy upper tail when investigating potential heavy-tailed behavior. In our case, the best fit was achieved forxmi n=9 withk=1.94, but the fit forxmi n=2 was good enough and explained most of our data points.
the distribution of vulnerabilities fits a power-law, other heavy-tailed distributions (power-law with exponential cut-off, lognormal) are also possible fits, and in general very difficult to statistically disprove [13].
One should not jump to conclusions regarding the mechanism(s) that generate this distribution.
Most likely, a combination of mechanisms leads to our observations, including social and time- dependent factors. However, the hypothesis that the vulnerability distribution is attributed entirely to the size (in KSLoCs) of the packages was indeed statistically disproved (size does not follow a heavy-tailed distribution; Fig. 17 of the appendix shows an intuition of this). A high-level generative mechanism of preferential attachment (the rich get richer), supporting a classic power-law, could be based on “the more we look the more we find” argument, where more bugs being found for a component cause more focus on the component, and thus in turn yet more bugs are found. Another fitting distribution is the power-law with exponential cut-off, where the rich get richer up to a point. This would explain the case where there is a limit on the rate of bug-finding for each package even if more resources are dedicated to the task. Both of the aforementioned related heavy-tailed distributions are possible fits with similar generative mechanisms and collecting more data as time goes by is required for more definitive statistical tests.
Global observations: Table 2 presents the 20 top vulnerable Debian source packages of all time.
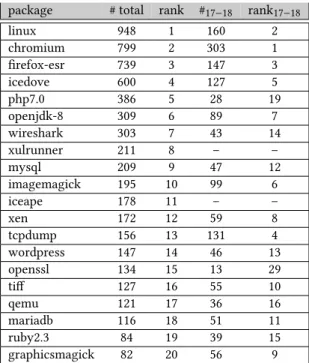
An automated procedure was established to collect the vulnerabilities reported for previous versions of a package and attribute them to its current version in the stable distribution. Manual checks and small corrections were subsequently performed (again included in the framework as ready-to-use configuration files – see Section 3). The Linux kernel turns out to be the most vulnerable component, followed by the two main browsers in use (Chromium9and Firefox ). The total number of unique vulnerabilities10reported in the 18 year period was 10 716, with the kernel accounting for around 9 % of the total. During the years 2017-2018, a total of 2 366 vulnerabilities were reported, with Chromium being by far the most affected package, accounting for 303 vulnerabilities (around 13 % of the total) compared to the next most vulnerable package (the Linux kernel) which was affected by 160 (around 7 % of the total).
Concerning the total number of vulnerabilities reported in the Debian ecosystem w.r.t. time, Fig. 3b shows a clear upward trend as the years go by. Can this mean that the quality of the software w.r.t. security is decreasing, despite the considerable effort of developers, security researchers and professionals? One could argue that the amount of software packages in Debian increased dramatically in recent years and this is the cause of the increase in the total amount of vulnera- bilities reported. Thus, even one or two bugs that slipped the security measures of the individual maintainers, would contribute to a big yearly sum. That would be a reasonable explanation, as the stable version of Debian released in 2002 (Woody) contained only 8 500 binary packages, going up to 18 000 packages with the release of Etch in 2007, significantly increasing to 36 000 in 2013 (Wheezy) and peaking at 52 000 with Stretch, which was released in June 2017, and at 58 000 with the latest stable release named Buster, which was released in June 2019. However, we found evidence supporting the opposite. Interestingly, the number of vulnerabilities per package (among the packages that had a vulnerability reported for the specified year) also follows an upward trend, a fact obvious in Fig. 3c. In the latter figure we can even see a smoother, clearer upward trend compared to Fig. 3b, although the slope of the trend is nearly identical. These observations, together with our previous assessment that the distribution of vulnerabilities among the packages can be attributed to a power-law generation mechanism, indicate that there are specific packages that continue to have large numbers of vulnerabilities for prolonged periods of time. As we can see in
9open source code-base of the proprietary Google Chrome browser.
10Note that a vulnerability may affect more than one packages. More discussion on this follows in this section.
package # total rank #17−18 rank17−18
linux 948 1 160 2
chromium 799 2 303 1
firefox-esr 739 3 147 3
icedove 600 4 127 5
php7.0 386 5 28 19
openjdk-8 309 6 89 7
wireshark 303 7 43 14
xulrunner 211 8 – –
mysql 209 9 47 12
imagemagick 195 10 99 6
iceape 178 11 – –
xen 172 12 59 8
tcpdump 156 13 131 4
wordpress 147 14 46 13
openssl 134 15 13 29
tiff 127 16 55 10
qemu 121 17 36 16
mariadb 116 18 51 11
ruby2.3 84 19 39 15
graphicsmagick 82 20 56 9
Table 2. The top twenty packages with the most vulnerabilities in time periods (i) 2001-2018 and (ii) 2017-2018.
Table 2, the trend is dominated by major projects, some of which we like to think of as leaders in the practice of secure software development. What is the explanation for this phenomenon?
Do “stable” releases mature?: A typical explanation would be that vulnerabilities were induced by software upgrades and the number of vulnerabilities affecting a specific version of a package gradually dropped to zero. An intuitive hypothesis would be that at least for certain stable versions of a package, the rate of vulnerabilities will eventually decrease. In order to test the claim that specific versions of a package reach a relatively secure state (few vulnerabilities reported per quarter) and that subsequent vulnerabilities that are attributed to the package are caused by updates, we perform a case study on two popular packages, namely PHP and OpenJDK, which recently underwent major version changes (translated to significant differences in their codebase, in contrast to other packages like the Linux kernel which follow a very smooth version transition). The hypothesis is that each major version of a package becomes more secure as time passes, as a result of the hard work of the security community and that a considerable amount of new vulnerabilities affect only the new code inserted with the major updates. To test this hypothesis we inspected the vulnerabilities reported for the newer versions of the packages and checked if they also affect older versions.
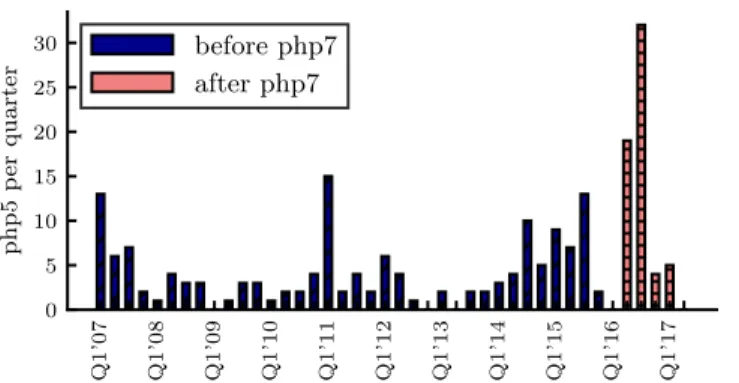
PHP: is a popular server-side scripting language that is used by 79% of all websites whose server- side programming language is known11. We will look into the transition from php5 to the next version php712(php6 never made it to the public). The vulnerability history of php5 (see Fig. 4) indicates that the component is relatively hardened at the time the next version is released. The vulnerability discovery rate is relatively low and stable for the last months before the launch of php7. To support our hypothesis, we would expect a good amount of vulnerabilities after this point
11https://w3techs.com/technologies/details/pl-php (July 2020) 12Official package name php7.0
Q1’07 Q1’08 Q1’09 Q1’10 Q1’11 Q1’12 Q1’13 Q1’14 Q1’15 Q1’16 Q1’17 0
5 10 15 20 25 30
php5perquarter
before php7 after php7
Fig. 4. Vulnerabilities of php5, during its presence in the stable release, before and after the introduction of the next version (php7) in testing. Vulnerability rate: (a) before the launch of the new version:≈4vuln./quarter;
(b) after the launch of the new version:≈10vuln./quarter.
to affect the new version (php7) of the software but not older versions (php5.x). However, while we can indeed observe a substantial spike of vulnerabilities, most of those also affected the previous version (php5.x). The launch of the new version may have instigated researchers and bug hunters to look for vulnerabilities induced by the new code, but instead what they found were already existing vulnerabilities from previous versions - so calledregressivevulnerabilities. After detailed manual inspection of all security incidents tracked by the Debian Security Bug Tracker13, we found that in the time window of January 2016 - January 2018, out of the 103 vulnerabilities that affected php7, 81 (79%) also affected version 5 of the software14. Further investigation regarding the nature of these vulnerabilities shows that a great portion of them are usual programming mistakes (e.g.
input validation errors or integer overflows). Hence, their discovery seems not to be associated with any advances in the security tools used, rather it may reasonably be attributed to the fresh eyes that reviewed the code of the newer version.
OpenJDK: We repeat the experiment with OpenJDK, an open source implementation of the Java Platform (Standard Edition), and since version 7, the official reference implementation of Java.
Version 7 was introduced into the testing distribution of Debian in September 2011 and became part of stable in May 2013 (Debian Wheezy). It remained part of the stable until the release of Stretch (June 2017). The next version, OpenJDK-8, became part of the testing distribution in May 2015 and became part of stable with Debian Stretch (June 2017), replacing version 7. In Fig. 5, we see the vulnerabilities of version 7 before and after the introduction of the next version. Again, there is no statistically significant decline in the rate of vulnerability reports, and the introduction of the next version seems to contribute to the discovery of vulnerabilities of the previous version. To put things into perspective, out of a total of 38 vulnerabilities that were reported for openjdk-8 in the time span of June-November 2017, only 2 did not affect version 7, and most of them (31/38) also affected version 6, released almost 10 years prior.
Debian Wheezy: Although the detailed investigation of vulnerabilities for PHP and OpenJDK gave us some useful insights about the current state of software quality, these results cannot be generalized to other packages. In order to get a more complete view of the effect of new vulnerabilities on older versions, we study the security history of Debian 7 (Wheezy) that was
13https://security-tracker.debian.org/tracker/
14Attribution of vulnerabilities to affected versions was made according to information about patched versions in the Debian Security Bug Tracker.
Q1’13 Q1’14 Q1’15 Q1’16 Q1’17 0
5 10 15 20 25
openjdk-7perquarter
before openjdk-8 after openjdk-8
Fig. 5. Vulnerabilities of openjdk-7, during its presence in the stable release, before and after the introduction of the next version (openjdk-8) in testing. Vulnerability rate: (a) before the launch of the new version:≈11.3 vuln./quarter; (b) after the launch of the new version:≈10.6vuln./quarter.
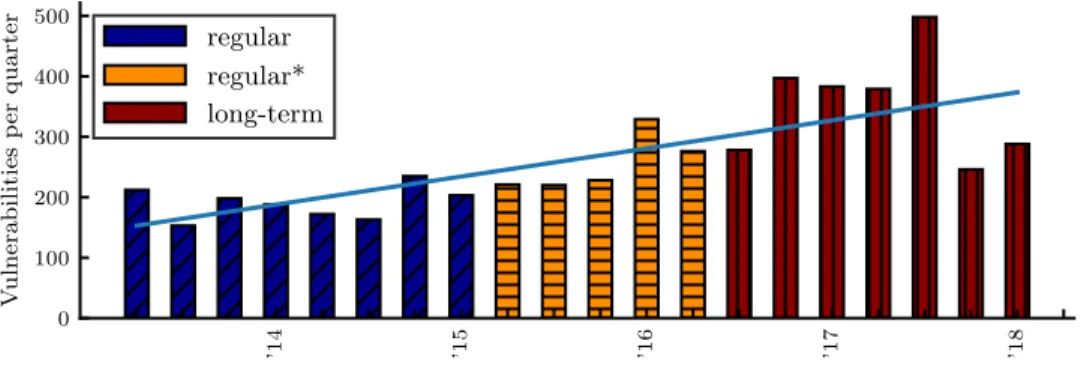
released in May 2013 and was supported until recently by the LTS15team (May 2018). In Fig. 6, we see the distribution of vulnerabilities per quarter, starting from the release of Wheezy. Even for a
Q1’14 Q1’15 Q1’16 Q1’17 Q1’18
0 100 200 300 400 500
Vulnerabilitiesperquarter
regular regular*
long-term
Fig. 6. Vulnerabilities that affected packages of the Wheezy Debian release.
*From Q2/2015 to Q2/2016, both Debian 7 (Wheezy) and 8 (Jessie) were supported by the regular security team. This was due to the fact that current Debian practice is that when a new stable version is released, the previous one (now codenamed oldstable) is still supported by the regular security team for another year and then passed to the LTS team. Therefore, the amounts of the regular* period are a higher bound, as some vulnerabilities may have affected only the newer release. We note that in the LTS phase, only one release is supported at a time.
specific stable release of Debian, we can observe a clear upward trend that continues in the LTS phase of the software (as expected the trend is statistically significant). These results support our findings for individual packages and show that the rate of vulnerabilities is not decreasing, and to the contrary is slightly increasing over time, even for a specific stable release over its whole lifetime of 5 years.
The shared code effect: Shared code between applications (packages) can lead to the same vulnerability affecting more than one of them. Since shared code has been shown to be an important attack vector [26], we move on to investigate the prevalence of shared vulnerabilities in Debian.
Of a total of 10 716 vulnerabilities affecting Debian packages, 2 462 affect more than one package.
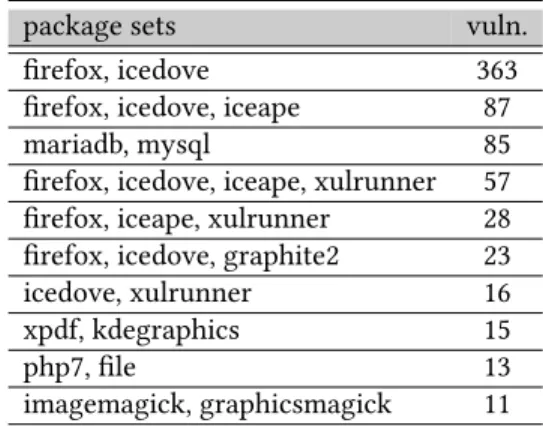
In Fig. 7, we see the number of vulnerabilities that affected at least two packages over time, and in Table 3, the most prevalent package sets jointly affected by vulnerabilities. We observe that
15Starting from 2014, Debian includes an LTS program, in order to extend support for any release to at least 5 years in total.
package sets vuln.
firefox, icedove 363
firefox, icedove, iceape 87
mariadb, mysql 85
firefox, icedove, iceape, xulrunner 57 firefox, iceape, xulrunner 28 firefox, icedove, graphite2 23
icedove, xulrunner 16
xpdf, kdegraphics 15
php7, file 13
imagemagick, graphicsmagick 11 ’01 ’03 ’05 ’07 ’09 ’11 ’13 ’15 ’17 Year
0 50 100 150 200 250
Repeated
Table 3. Most common sets of packages jointly affected by vulnerabilities.
Fig. 7. Vulnerabilities affecting at least two Debian packages.
the package sets of jointly affected packages are dominated by Mozilla products and the duo of mariadb and mysql. This is attributed to the well-known fact that Mozilla products share a large portion of their source code (referred to asCore modules16), and mariadb starting as a fork of mysql.
Although for all results presented in this paper we count each vulnerability only once even though it may affect one or more packages, we did not see any qualitative differences when counting vulnerabilities multiple times in any of the trends we investigated. Therefore, we can safely conclude that the shared code effect does not significantly affect the overall trends of vulnerability discoveries in Debian.
Discussion: In this section, we investigated the distribution of vulnerabilities in the Debian ecosystem. After detailed examination of the vulnerabilities reported for both individual widely used packages (case studies on PHP and OpenJDK), and a specific stable release of Debian, we conclude that the number of vulnerabilities does not visibly decrease over time, even for software that has been stable for many years. To the contrary, we discerned a relatively stable rate of vulnerabilities, that shows signs of statistically significant increase over time. In other words, we are still in the phase ofthe more we look - the more we find. Although automated security tools and manual security inspection are becoming more widespread and effective, we have not reached the point of curbing the vulnerability rate yet.
Our results draw interesting comparisons to studies performed over a decade ago. Rescorla claimed in [32] that there was no clear evidence that finding vulnerabilities made software more secure, and that even the opposite may be true, i.e. that finding vulnerabilities, given that their rate is not decreasing, leads to more risk than good, by allowing hackers to attack unpatched systems.
Another study from 2006 by Ozment and Schechter [28] tried to challenge Rescorla’s claims and found evidence of a decrease in the vulnerability rate of the foundational (in the code since the first version) vulnerabilities of OpenBSD in a 7.5 year interval (statistically significant decrease was observed after 5 years from the release of the sotware). This can be attributed to the very few features available in OpenBSD and maybe even to its relatively low popularity. Our results show that, more than a decade later, the security of Debian as a whole, and for PHP and OpenJDK individually, is not increasing. After the impressive growth of the security community since 2006,
16https://wiki.mozilla.org/Core
we still either have not reached the point where vulnerabilities have become substantially more difficult to find, or we introduce vulnerabilities faster than we can find them.
Our results can also be compared to the more recent ones of Edwards and Chen [15] from 2012. By investigating the vulnerabilities of Sendmail, Postfix, Apache httpd and OpenSSL, they conclude that although the quality of the software under question did not always improve with each new release, the rate of CVE entries generally begins to drop three to five years after the initial release, indicating a stage of maturity of the software. Our results do not disprove the fact that the vulnerability rate of a specific version may begin to drop three to five years after its release, however, for the software packages of our study, it increased again when the new version entered the testing phase. This hints to the fact that testing scrutiny is a dominating factor of the vulnerability discovery process, as “fresh” eyes looking at the code seem to be able to find additional vulnerabilities. Interestingly, Clark et al. [12] found that, out of all the primal vulnerabilities (i.e.
first exploitable vulnerabilities to be reported for a software release) discovered, 77% of them affected earlier versions of the software. This result, along with our observations, indicates that the difficulty of finding a specific vulnerability is subjective, and may vary considerably among different researchers/testers. Conclusions made in [25] that the unique characteristic of each individual offers unique bug-discovering potential and that each individual can expect to find a bounded number of bugs, further support this claim. In short, the process is still more of an art than a well-defined procedure, and automated tools do not seem to have a measurable impact.
Looking into the bigger picture of software engineering, we can find interesting relationships between our results and the Laws of Software Evolution, proposed by Lehman in the 1970’s [21]
and revised in the 1990’s [22], with the addition of, among other, the Law of Declining Quality.
This law states that “The quality of E-type systems17will appear to be declining unless they are rigorously maintained and adapted to operational environment changes”. Our observations could be interpreted as showing that we have not yet achieved an adequate degree of rigorousness in our development and security processes.
5 VULNERABILITY SEVERITY AND TYPES
2001 2002 2003 2004 2005 2006 2007 2008 2009 2010 2011 2012 2013 2014 2015 2016 2017 2018 0.0
0.2 0.4 0.6 0.8
1.0 N/A
high medium low
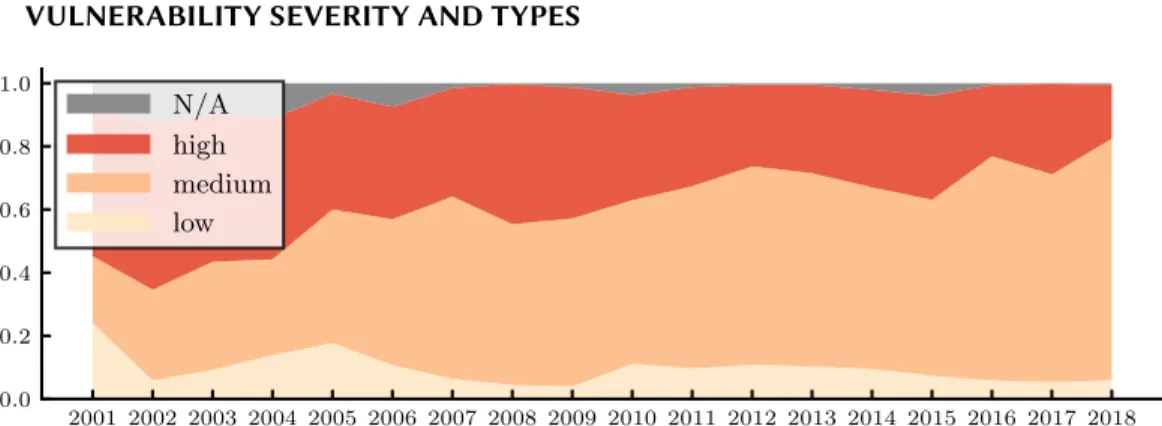
Fig. 8. Vulnerabilities severity of the stable release over time.
After establishing a general picture of the vulnerability landscape, we move on to investigate our hypotheses regarding vulnerability severity and type.
H2.1 CVE Severity: Since we established that there is no observable decrease in the overall vulnerability rate of FOSS, we proceed to investigate the theory that although more bugs are
17E-type systems are, according to Lehman, real-world systems influenced by the environment and people.
discovered, they are less critical and more difficult to exploit than before. Then, one would expect a decrease of the ratio of high-severity vulnerabilities, compared to less critical ones. In Fig. 8, we see the progression of the ratio of low, medium, and high severity vulnerabilities, as classified by their CVSS score. An obvious trend of domination of medium severity vulnerabilities is observed, with a gradual decrease of the percentage of high and low severity vulnerabilities. We can also see that low severity bugs represent a very small percentage (under 10%). This can be attributed to the fact that the Debian security team only issues advisories for bugs that warrant immediate patching, and often low severity ones are left to be fixed as part of the normal release cycle of the package. We saw that the percentage of critical vulnerabilities shows a decrease recently, but are high severity vulnerabilities becoming rarer?
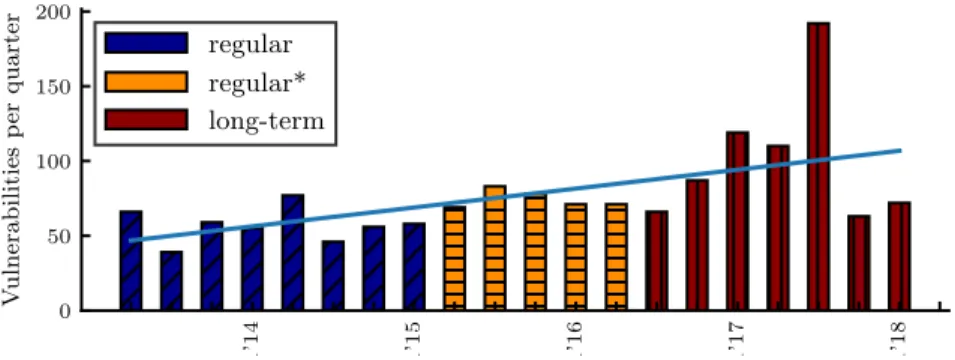
To test this hypothesis, Fig. 9 shows the high-severity vulnerabilities discovered during the whole lifetime of Debian Wheezy, including its LTS period. It is evident that no decrease is observable, and
Q1’14 Q1’15 Q1’16 Q1’17 Q1’18
0 50 100 150 200
Vulnerabilitiesperquarter
regular regular*
long-term
Fig. 9. High severity vulnerabilities of Debian Wheezy. The irregular peak of Q3’17 can be largely attributed to DLA 1097-1 which contained 86 CVEs affecting tcpdump.
to the contrary a statistically significant increase in the vulnerability discovery rate is observed until the end of the release’s lifetime. Therefore, there is no sign of maturity even when only considering critical vulnerabilities of a stable release of Debian. This gives an overall picture, however it does not mean that all components necessarily follow this trend. More fine-grained study and comparison of the behaviour of the different packages may offer interesting results, however such comparisons are consciously left as future work.
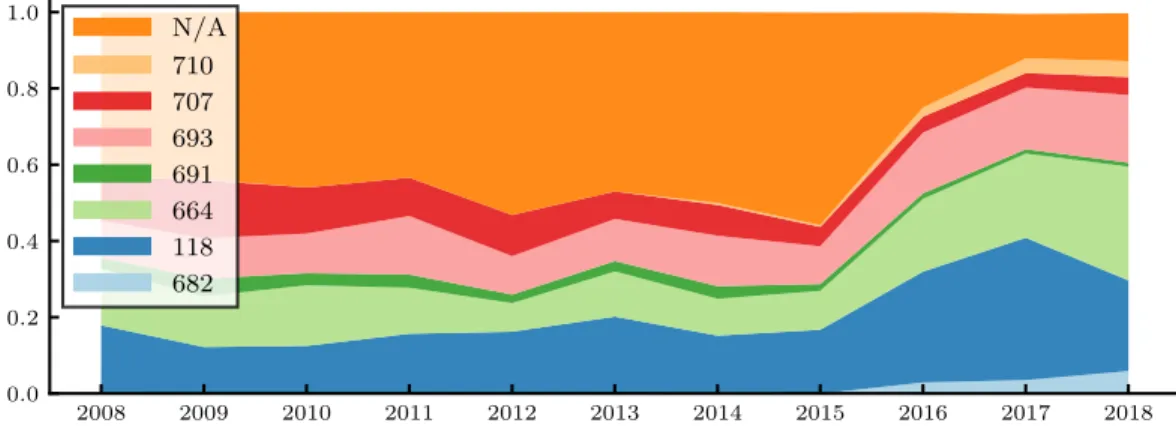
H2.2 CVE Types: If software development is just too fast and tools are still limited and not widely applied, are we at least making progress on some part of the problem? Are certain vulnerability types being eliminated as a result of better practices and tools (e.g. more secure web programming, fuzzing tools)? To test this hypothesis, we investigate the distribution of vulnerabilities over time according to their types. Vulnerability type information is derived from the “Research Concepts”
view (CWE-1000) of the Common Weakness Enumeration (CWE) list. According to the CWE documentation, this view is mainly organized according to abstractions of software behaviors and is intended to facilitate academic research into weaknesses. It follows a deep hierarchical organization where all vulnerabilities can be traced back to 11 root classes. In our study we matched each vulnerability that was attributed a CWE number with its root class(es). The 7 classes with a significant number of bugs are presented in Table 4.
The progression of bug types over time is shown in Fig. 10. The plot starts from year 2008, as this is the time where type classification of bugs started becoming standard practice of the NVD. Two observations are made. First, a big portion of bugs (N/A) did not fall directly under a CWE-1000 root class, especially before 2015. This is because many vulnerabilities (especially
root Description
682 Incorrect Calculation, e.g. Integer Overflow
118 Incorrect Access of Indexable Resource (’Range Error’), mostly Buffer problems
664 Improper Control of a Resource Through its Lifetime, e.g. Information Exposure, Improper Access Control 691 Insufficient Control Flow Management,
mostly Code Injection, Race Condition 693 Protection Mechanism Failure,
mostly Improper Input Validation (CWE-20) 707 Improper Enforcement of Message or Data structure,
mostly Improper Neutralization (SQL injection, XSS) 710 Improper Adherence to Coding Standards,
mostly NULL Pointer Dereference
Table 4. Vulnerability type classification per root CWE number with most dominant examples in our dataset.
2008 2009 2010 2011 2012 2013 2014 2015 2016 2017 2018
0.0 0.2 0.4 0.6 0.8
1.0 N/A
710 707 693 691 664 118 682
Fig. 10. Vulnerability types per year of Debian stable. Labels correspond to root CWE numbers (research view).
older ones) were classified in broad categories, such as CWE-16 “Code weakness” and CWE-17
“Configuration weakness”, which are not compatible with the classes of the Research Concepts view, and according to CWE suggestions should not be used for mapping bugs – however NVD still maps to them anyway. Positively, in recent years the portion of unmapped bugs has fallen to under 20 % of the total. The second observation is that three types capture most of the classified bugs, namely Memory Index (118), Improper Resource Control (664) and Protection Mechanism Failure (693) errors account for more than 70 % of all Debian bugs in 2017, with their ratio relatively stable since 2008. On the other hand, message structure enforcement errors (707), in most cases improper neutralization of special characters leading to SQL injection (SQLI) or Cross Site Scripting (XSS), show a decrease in their prevalence from more than 10 % in 2008-2010 to a negligible portion in 2016-2018. This may be a sign that at last some maturity has been achieved for this specific bug type, which is reasonable as these vulnerabilities are suitable for automatic detection. In fact, this result supports the claims of [6], that automated black-box tools were effective at finding XSS and SQLI since 2010.
Q1’14 Q1’15 Q1’16 Q1’17 Q1’18 0
50 100 150
CWE-118 Q1’14 Q1’15 Q1’16 Q1’17 Q1’18
0 25 50 75
CWE-664
regular regular*
long-term
Q1’14 Q1’15 Q1’16 Q1’17 Q1’18
0 20 40
CWE-693 Q1’14 Q1’15 Q1’16 Q1’17 Q1’18
0 50 100
N/A
Fig. 11. Main vulnerability types of Debian Wheezy, including LTS.
We move on to test for trends in the absolute number of vulnerabilities per type, rather than their ratio. In Fig. 11, the absolute number of bugs of the three most prevalent types plus the unclassified ones, are shown for the whole lifetime of the Wheezy release. No decreasing behavior can be observed for any of the four types, and especially memory errors seems to increase dramatically during the LTS period of Wheezy. However, no strong claims can be safely made regarding this, as the incompatibility issues of the CWE directives and the NVD classification hinders reasoning. On the positive side, the number of unclassified reports significantly drops, signifying the potential for more complete reasoning in the following years.
Discussion:In this section, we sought evidence supporting the hypotheses that (a) the rate of dis- covery for severe vulnerabilities is decreasing, and (b) the rate of discovery for specific vulnerability types is decreasing. Although the ratio of high severity bugs compared to the total is decreasing, the absolute number of severe vulnerabilities follows a similar statistically significant increasing trend as the total number of vulnerabilities, with the positive factor that the rate of increase is smaller compared to the total number of discoveries. Regarding types, we did not find evidence of a decrease of the prevalence of any of the 3 main types (CWEs 118/664/693), however we noticed that XSS and SQLI bugs due to improper neutralization are becoming rarer. Memory bugs are still very prevalent and no maturity has been achieved in this category, even though this type of bugs is most suitable for automatic detection via fuzzers, and fuzzers like the AFL have become rather popular in recent years. Our result are in agreement with Li and Paxson’s [24] vulnerability lifetime measurements in 2017, where XSS and SQLI were measured to have the shortest median life span, whereas memory issues, like buffer overflows, had a median life span around three times longer.
Fuzzing is an active topic of research but, as of now, AFL and libfuzzer18are the major / state- of-the-art approaches in practice. AFL, in particular is not new (although it keeps evolving). If these tools had a significant impact in comparison to manual search, one would expect a sharp increase in the vulnerability rate, followed by a decline. Chromium and OpenSSL, for example, have been primary targets for in-depth fuzzing; one would hope these efforts have a significant effect.
Unfortunately, based on our data and analysis so far, we cannot confirm this. It will be interesting
18https://llvm.org/docs/LibFuzzer.html
to see if such tools have a measurable impact in the near future. Future work on measuring the effectiveness of automated tools in practice would be appreciated by the community.
It is also valuable to compare our observations to the ones of Tan et al. [39] who investigated bug characteristics of a subset of our dataset, namely the Linux kernel, Mozilla and Apache, back in 2014. They found that semantic bugs (defined as non-memory and non-concurrency bugs according to their CWE classification) were the root cause of most (∼70 %) of the vulnerabilities. We extend their results by observing trends over time and generalizing them to a complete software distribution, while getting more detailed insights by using the complete root CWE vulnerability type classification. Unfortunately, in [39] there is no trend analysis of security bug types over time to compare with our findings.
6 BUG BOUNTY PROGRAMS
So far, the security quality of FOSS does not show clear signs of improvement. Another popular argument, supported by numerous media reports, is that vulnerabilities are getting more and more expensive and bug bounties are increasing. This would indicate that they are becoming harder to find and software is indeed becoming more secure. In this section, we investigate this hypothesis (H3) and what it tells us about the security quality of FOSS in particular, by looking into the publicly visible reports of the well-known Bug Bounty platform HackerOne19.
HackerOne is a popular source of data for bug bounty research and has been used in important recent works that generally study the bug bounty ecosystem (e.g. [25, 45]). The Internet Bug Bounty (IBB) program20is a community-driven initiative to award rewards for bugs affecting important FOSS21components, running on the HackerOne platform. The program started in late 2013 and is ongoing as of the time of writing, consisting of a number of projects targeting different software components. It is managed by an independent committee of security specialists and sponsored by technology companies and donations.
Table 5 presents a summary of the software covered by the IBB, as well as the total and maximum bounties paid in each of the projects. Apart from the projects that are named after the software components they target, there exist two more general projects. TheDataproject was launched in 2017 and rewards bugs in core infrastructure data processing libraries (e.g. curl), while theInternet project rewards “the most critical vulnerabilities in the Internet’s history”, and has famously given rewards for Shellshock ($20 000) and the Key Reinstallation Attacks ($25 000). Perhaps surprisingly, Adobe’s proprietary Flash Player was included in the program until August 2016 when it stopped with the argument that “Flash exploitation no longer has the same impact as when we started”. A total of 569 reports have been awarded a total of more than $600 000 until November 2018 (counting only the 436 reports with disclosed bounty amounts), with PHP accounting for almost half of all reports, but less than 30 % of the bounties paid. Although there are interesting distinctions to be made between the projects under the IBB, for the rest of the paper we will consider them as a uniform set of bug bounties, which to the best of our knowledge represents the most significant bug bounty program for FOSS in existence.
First, we investigate whether security bug reports in the IBB follow the same increasing trend as they do overall. The top left part of Fig. 12 presents the number of reports that were awarded bounties by the IBB from 2014 until November 2018. Notably, the number of bounties paid shows an increasing trend until 2017 and then a decreasing trend until the end of the period in question.
This behavior shows that the bug bounty program was successful (at least initially), yielding a large
19https://www.hackerone.com/
20https://internetbugbounty.org/
21with the notable exception of Adobe Flash until 2016.
Component Bounty # Disclosed # Total amount ($) Max amount ($) Average amount ($)
PHP 252 236 170 500 4 000 722
Python 65 58 58 000 9 000 1 000
Data 33 18 11 000 1 000 611
Flash 69 50 175 000 10 000 3 500
NginX 4 2 6 000 3 000 3 000
Perl 12 9 7 500 1 500 833
Internet 89 26 122 000 25 000 4 692
Openssl 36 29 45 500 15 000 1 569
Apache 9 8 5 600 1 500 700
Total 569 436 601 100 25 000 1 379
Table 5. IBB dataset summary snapshot on November 2018.
Q1’14 Q1’15 Q1’16 Q1’17 Q1’18
0 25 50
num-IBB Q1’14 Q1’15 Q1’16 Q1’17 Q1’18
0 5 10
new-IBB
Q1’14 Q1’15 Q1’16 Q1’17 Q1’18
0 500 1000
num-All Q1’14 Q1’15 Q1’16 Q1’17 Q1’18
0 200
new-All
Fig. 12. Number of claimed bounty reports (left) and new reporters (right) entering the program for IBB (top row) and the HackerOne platform overall (bottom row) over time.
number if reports, and is more similar to the traditional reliability-style hardening behavior we expected to see (but did not) for vulnerability discoveries in Debian. Is this a contradiction to our earlier observations? An indicator to support this hypothesis is that the monetary amount of the rewarded bounties increases over time. To test it, we look into the progression of awarded bounties over time.
Fig. 13 shows the trend in the amount of bounties rewarded, both for the IBB and for the whole of the HackerOne platform. The right side of the figure considers only high and critical severity bugs as classified by the bounty project’s security teams (not CVSS scores – but of similar nature).
Since only a few IBB bugs have been classified as either highly or critically severe, the top right box plot consists of only a few points. In general, Fig. 13 shows no increase in the level of the bounties rewarded in any of the 4 cases. On the contrary, the mean and quartiles of the rewards are stable over time in all cases. In combination with Fig. 12 and our previous observations, this points to the fact that the decrease in the number of bounties paid in the IBB may be attributed to the decrease of the attractiveness of the program in comparison to other programs that have entered the platform, since bugs outside the platform continue getting reported at a non-negligible rate.
Upon closer re-inspection of Fig. 12, we can see that the overall rate of reporting in the HackerOne platform (bottom left) is almost stable over time from the start of 2017, and this correlates with an increasing incoming flow of new reporters over time, as shown in the right part of the figure. For the
14 15 16 17 18 100
102 104
IBB-all Q1’14 Q1’15 Q1’16 Q1’17 Q1’18
100 102 104
IBB-high
Q1’14 Q1’15 Q1’16 Q1’17 Q1’18
100 102 104
All-all Q1’14 Q1’15 Q1’16 Q1’17 Q1’18
100 102 104
All-high
Fig. 13. (5-95%) box plot of USD paid over time for all (left) and only high/critical (right) severity vulnerabilities.
Trend lines for the average (blue) and median (dark red). The only significant OLS trend comes from the top left plot concerning all the bugs reported in the IBB: a statistically significant decrease of the average as well as the median bounty. Detailed statistical test results in the additional material.
IBB, the spikes in reports correlate with the introduction of new reporters in the program (rather than older reporters finding additional vulnerabilities). This is an indicator that the continued attractiveness of a program is important for its success (rather than its attractiveness at its launch).
From the above, we cannot rule out that the IBB may not have a significant market share of the hacker effort of the platform anymore, and this is the reason its effectiveness is decreasing over time, although initially being successful. We note here that an external factor that could lead to non-increasing bounties could be a lack of interest due to a declining user base for IBB software. It is difficult to estimate the user base of non web-facing software accurately, however different measurement reports point to a significant user base for software in the IBB. More specifically, measurement reports on web servers22(Apache and nginx two leading choices), back- end programming languages23(“PHP is used by 79% of all websites whose server-side programming language we know”), programming languages in general24(Python is the most popular language with nearly 30% share), and cryptographic libraries [27] (openssl is dominant) show dominant market shares for software in the IBB at the time of writing. Moreover, note that the report rate in the IBB does not show any correlation with updates and new releases of Debian. This further supports our claim that the relative monetary attractiveness of a program is the dominating factor in the process.
To further investigate our interpretation that the IBB declined in attractiveness over time, we looked into other aspects of the behavior of IBB reporters (people with at least one IBB report) in HackerOne. Specifically, on the left side of Fig. 14, we see the ratio of bounties paid to those reporters for IBB reports, over the total amount they earned in the HackerOne ecosystem over time. On the right side of the figure, we see the related quantity of the number of reports filed in the IBB, over the total amount of reports filed by those reporters over time. Both plots indicate that (except from the anomaly of zero reports in Q3’15) until 2017, IBB reports came from people that hardly reported in other programs, hence they were focused only on the IBB. After that point in time, only a small portion of the reports and associated awards were in the IBB program, rather they were in other HackerOne programs. This indicates that reporters (old ones, as well as new)
22https://news.netcraft.com/archives/2019/04/22/april-2019-web-server-survey.html 23https://w3techs.com/technologies/details/pl-php (November 2019)
24http://pypl.github.io/PYPL.html
may not have expended a large portion of their effort on the IBB after 2017, instead engaging in the program rather superficially.
Q1’14 Q1’15 Q1’16 Q1’17 Q1’18
0.00 0.25 0.50 0.75 1.00
Amountratio Q1’14 Q1’15 Q1’16 Q1’17 Q1’18
0.00 0.25 0.50 0.75 1.00
Reportsratio
rest in IBB
Fig. 14. Ratio of bounty amounts (left) and number of reports (right) of IBB reporters (at least 1 IBB report at some point in time) comparing reports in the IBB program against reports for other programs in HackerOne over time.
Discussion: It is valuable to compare our results with some recent important papers in the area.
Zhao et al. [45] (2015) use the Laplace test to show that 32/49 organizations on HackerOne show a decreasing rate of vulnerability discoveries in the program and suggest that this indicates a positive effect and could be used as an indication of the web security of an organization. Considering that a significant amount of vulnerabilities affecting the software under question continue getting disclosed outside the bug bounty program, we would attribute this decrease to (a) most importantly, the limited number of hackers taking part in these programs – according to Maillart et al. [25] each hacker can only find a bounded number of bugs and each hacker’s unique talents allow them to find unique bugs, and (b) a relative lack of incentives to find more difficult vulnerabilities – hackers focus on the low-hanging fruit of newly introduced programs – a claim suggested in both [25, 45].
Allodi’s study of an underground black marketplace [3] shows that prices in such markets are rising over time, contrary to our results for the IBB. Thus, incentives for grey-hats to claim rewards from black marketplaces may increase. In fact, Zerodium25, a zero-day exploit acquisition platform selling information to “a very limited number of eligible customers”, mainly government organizations, recently increased its rewards for an iPhone remote jailbreak up to 2 million USD. On the same platform it is advertised that a Linux PHP or OpenSSL remote code execution (RCE) can pay up to
$250 000, while a Linux NginX RCE can pay up to $200 000. Naturally, these prices are a multiple of what is offered on ethical programs and by vendors themselves, since many hackers would be reluctant to sell to undisclosed government organizations. The legitimacy and legal implications of such programs is an issue that has not been discussed enough in the community.
A bright spot comes from the fact that a considerable part of the FOSS community may be considered altruistic and/or content with “swag”/reputation rewards for discovering vulnerabilities, and therefore the attractiveness of FOSS bounty programs cannot be purely evaluated by the monetary reward. In general, we can say that bugs may indeed become more sparse inside a bug bounty program, however this can be largely attributed to the limitations of the program participants and may not be safely generalizable to claims about the overall vulnerability landscape.
Overall, the impact of bug bounty programs, like the IBB is inconclusive at best and warrants further investigation.
25https://www.zerodium.com/