Financial Incentives for Energy Efficiency Retrofits in Buildings Karsten Neuhoff, German Institute for Economic Research
Kateryna Stelmakh, Hermann Amecke, Aleksandra Novikova, Jeff Deason and Andrew Hobbs, Climate Policy Initiative
ABSTRACT
In this paper, we evaluate international experiences (in Italy, the Netherlands, and the United States) with tax incentives that support thermal retrofits, and draw a comparison to the experience of preferential loan and grant programs offered by the German development bank, Kreditanstalt für Wiederaufbau KfW). We find that tax incentives as well as loans and grants had high pick-up rates, but the added value of these schemes remains to be analyzed. We also find that progressive support of comprehensive retrofits compared to single measures appears to be important. Countries that have provided the same level of support for both comprehensive retrofits and single measures have experienced, almost exclusively, investment in single measures.
Introduction
The German government has committed to reducing the primary energy demand of buildings by 80% by 2050 and to carrying out thermal retrofits on 2% of its building stock annually. Achieving each of these goals will require deep thermal retrofits across the existing building stock. To meet this challenge, the government has been exploring in 2011 and 2012 whether tax incentives could play a role in encouraging thermal retrofits and ensuring that they deliver the necessary energy performance. At the date of this paper’s submission, the tax incentive proposal is still to be discussed in the conciliation committee of the upper and lower houses of parliament. The proposal includes an accelerated depreciation of investments in thermal energy efficiency of buildings for commercial owners and landlords, as well as tax credits. In this paper, we analyze experiences with tax incentives in support of thermal retrofits in Italy, the Netherlands, and the United States with respect to the uptake rate and the market share of whole-house (or comprehensive) retrofits induced by tax incentive schemes. We also analyze whether the experiences of loan and grant programs for building energy efficiency in Germany1 differ from the outcomes of the reviewed tax incentive programs according to the same criteria.
Italy
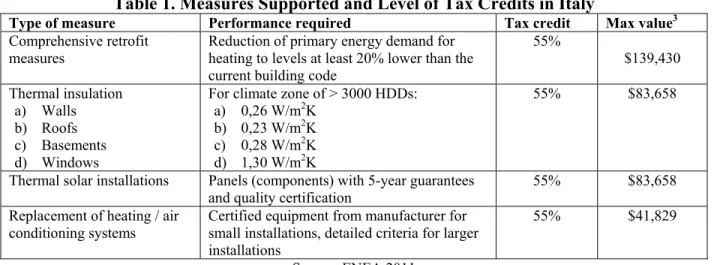
Italy has been offering tax incentives for energy efficiency improvements to existing buildings since 2007. The program provides tax credits to households and companies for single retrofit measures such as thermal insulation, installation of solar panels, and replacement of heating and air-conditioning systems, or for comprehensive retrofit work. Tax credit can cover
1 The loan and grant programs are administered by the German development bank, KfW.
55% of the energy-related cost, but cannot exceed a maximum value that is determined by the type of measure taken (see table 1). Tax credits are reimbursed over 10 years, beginning with the completion of work.
The program boosted retrofit investment in the residential sector between 2007 and 2009.
In 2009, building owners submitted 240,000 tax credit claims. Table 2 summarizes the main performance indicators of the Italian tax incentives program in 2009. There are no estimates on the free rider rates, which were likely high for replacement of windows. A survey of a similar tax credit program in France reported a high share (51%) of households who stated that availability of tax credits did not influence their retrofitting decisions (MURE 2010). In 2009, total investment in buildings retrofit provided by the program constituted more than $3.6 billion2, primarily in households (96%).
Table 1. Measures Supported and Level of Tax Credits in Italy
Type of measure Performance required Tax credit Max value3 Comprehensive retrofit
measures Reduction of primary energy demand for heating to levels at least 20% lower than the current building code
55%
$139,430 Thermal insulation
a) Walls b) Roofs c) Basements d) Windows
For climate zone of > 3000 HDDs:
a) 0,26 W/m2K b) 0,23 W/m2K c) 0,28 W/m2K d) 1,30 W/m2K
55% $83,658
Thermal solar installations Panels (components) with 5-year guarantees and quality certification
55% $83,658 Replacement of heating / air
conditioning systems Certified equipment from manufacturer for small installations, detailed criteria for larger installations
55% $41,829
Source: ENEA 2011
Table 2. Claims and Investment Supported by the Italian Tax Incentives in 2009
Type of measure Number of claims accepted
Average energy savings per measure (kWh/a)
Average cost per energy unit saved ($/kWh/a)
Average cost per measure ($)
Total
investment ($
millions)
Comprehensive retrofit 5,622 21,528 0.04 18,915 106
Thermal insulation a) Walls
b) Floors and roofs c) Windows
5,377 9,838 114,806
8,025 16,115 2,626
0.14 0.15 0.25
23,261 36,617 13,205
125 360 1,516
Thermal solar installations 35,248 6,960 0.07 9,619 339
Replacement of heating / air conditioning systems
68,056 9,164 0.15 17,212 1,171 Source: ENEA 2010a
Comprehensive retrofit projects delivered the highest average savings and were significantly more cost-effective than other measures. The average savings for comprehensive retrofits was $0.04 per kilowatt-hour, compared to window replacement, which was six times
3 Average exchange rate of EUR/USD = 1.3943 in 2011. See http://www.oanda.com/currency/historical-rates/
3 Average exchange rate of EUR/USD = 1.3943 in 2011. See http://www.oanda.com/currency/historical-rates/
less cost-effective. The distribution of investments across different measures is not uniform.
Despite higher energy saving potentials and absolute support values, the share of comprehensive retrofits was only 3% of total investment and 2% of total claims in 2009. The low demand for comprehensive retrofit can be partially explained by the greater complexity of such measures, a lack of information and certified advisors, as well as by insufficient incentives. Because relative support for comprehensive or single measures is the same, there is no additional financial incentive to pursue higher levels of efficiency. At the same time, performance criteria for comprehensive retrofit are more stringent than for single measures. As a result, it is unlikely that these tax incentives in their current form have led to a significant increase in the comprehensive thermal retrofit rate. The fact that the tax credit scheme in Italy has multiple objectives should be taken into consideration, however. In addition to improving the energy performance of buildings, it also aims to stimulate growth in the construction and solar thermal panels markets, as well as creating an incentive for households to receive installation services from legal sources, since income from such sources, e.g. window replacement, is often unreported.
USA
The U.S. government and various state governments employ a diverse set of incentive policies to encourage thermal retrofitting. At the federal level, there were separate income tax incentives for residential and commercial properties until 2012. The residential income tax incentives have now been eliminated.
Federal residential incentives took the form of tax credits and were primarily associated with equipment improvements, such as better insulation, replacement of windows and doors, sealing, and installation of efficient HVAC (heating, ventilation, and air conditioning) and water heating equipment. The improvements had to meet specific standards to qualify. In most cases, envelope modifications had to be compliant with the current U.S. residential model energy code;
in others, they had to meet ENERGYSTAR® standards. In 2011, the credit was set at 10% of the installed cost for qualifying equipment up to a $500 cap.4 This cap applied to the total credit that could be claimed, so if three separate measures were taken, for example, the claim still could not exceed $500. In some cases, individual measures carried their own caps as well. Moreover, the cap applied across years, so if a homeowner took a credit of $350 in 2010, only $150 could be taken in 2011.
For commercial buildings,5 tax incentives for performance achievements take the form of deductions earned on a per square foot basis. The full deduction of $1.8/ft2 is available to buildings that reduce their energy use to 50% below the requirements of the 2001 U.S.
commercial model energy code through a combination of (1) lighting, (2) HVAC and water heating, and (3) envelope measures. Partial credits of $0.6/ft2 can be earned by achieving reductions in each of these three categories individually. The Obama administration has proposed converting the commercial tax deduction into a tax credit to provide a greater retrofitting incentive.6
4 This was also the level of the residential credit in 2006 and 2007, though the measures that qualified changed. The credit was dropped for the 2008 tax year, but for the tax years 2009 and 2010 it was reintroduced as a stimulus and substantially increased to 30 percent of installed cost, up to a $1500 cap.
5 Note that residential buildings of more than three stories are regulated by the commercial code and qualify for the commercial tax deductions.
6 See the administration’s Blueprint for a Secure Energy Future.
State tax incentives that support thermal retrofits vary. There are seven states with some form of income tax incentive for envelope or whole-house measures, five states with some form of property tax incentive at the state or local level, and one state that does not charge sales tax on residential weatherization products. The incentives vary in size and design.
Many of the sales tax incentives are structured similarly to the federal one, with some percentage of the installed cost of eligible equipment qualifying for a credit up to a cap. Some credits are tied to the achievement of a green building certification. Whole-building incentives are more commonly available for commercial and large multi-family buildings than for single- family homes. One state provides a credit to builders, rather than owners, for going sufficiently beyond code, though this credit is likely earned more often for new homes than for retrofits.
Property tax exemptions or reductions are earned through U.S. Green Building Council’s Leadership in Energy and Environmental Design (LEED) or similar standards, with the level of reduction tied to the level of LEED certification, and are adopted at either the state or local level.
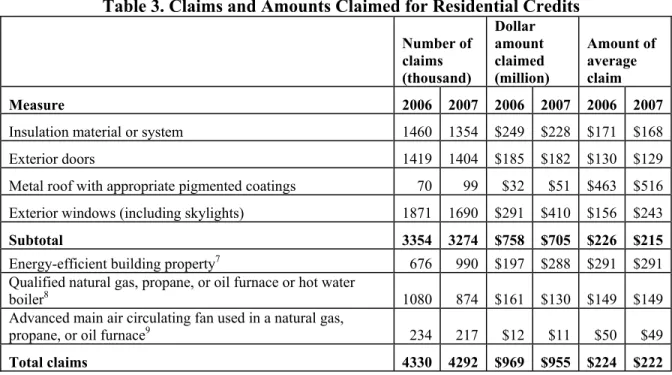
Table 3. Claims and Amounts Claimed for Residential Credits
Number of claims (thousand)
Dollar amount claimed (million)
Amount of average claim
Measure 2006 2007 2006 2007 2006 2007
Insulation material or system 1460 1354 $249 $228 $171 $168
Exterior doors 1419 1404 $185 $182 $130 $129
Metal roof with appropriate pigmented coatings 70 99 $32 $51 $463 $516 Exterior windows (including skylights) 1871 1690 $291 $410 $156 $243
Subtotal 3354 3274 $758 $705 $226 $215
Energy-efficient building property7 676 990 $197 $288 $291 $291
Qualified natural gas, propane, or oil furnace or hot water
boiler8 1080 874 $161 $130 $149 $149
Advanced main air circulating fan used in a natural gas,
propane, or oil furnace9 234 217 $12 $11 $50 $49
Total claims 4330 4292 $969 $955 $224 $222
Source: U.S. Internal Revenue Service, http://www.irs.gov/taxstats/indtaxstats/article/0,,id=154955,00.html Note: These data are generated through adding up the entries on each line of the relevant tax form and the total amount entered on each line. The forms are built to ensure that the claim does not exceed any of the relevant caps. Due to the logic of the form, the claimant is not permitted to enter an amount above those noted for the three bottom categories listed above. However, the claimant enters the total eligible amount of the top four categories, and the form enforces the $500 total cap for the credit as a whole further down.
Thus, total amounts claimed for the first four categories are not comparable to total amounts claimed for the bottom three. As can be seen, the caps are important: Average amounts claimed in the bottom three
categories are just below the caps, indicating that amounts spent almost always exceed those caps; also, the credit for comprehensive retrofits that involve several different actions would likely be limited by the overall
$500 cap. Since the average claim amount is well below the cap, many claims must be for one particular action only. See http://www.irs.gov/pub/irs-prior/f5695--2006.pdf for the 2006 tax form and instructions.
7 Qualifying electric heat pump water heaters, electric heat pumps, geothermal heat pumps, central air conditioners, and natural gas, propane, or oil water heaters. Form directs claimant to enter no more than $300.
8 Form directs claimant to enter no more than $150.
9 Form directs claimant to enter no more than $50.
Notably, non-tax rebates for energy efficiency measures are used much more widely in the U.S. than tax incentives. Nearly all states and most utilities offer rebates on the purchase of energy-efficient appliances and other equipment. These rebates are generally not performance- based, but rather offer fixed incentives for the purchase of qualifying equipment. Again, designs vary across states and utilities. A few state programs give rebates based on (modeled) performance measures. For example, California offers a rebate for whole-house measures that save at least 15% of the home’s energy use based on a home energy assessment, with larger rebates given for larger savings.
In general, federal tax incentives are considered to be successful, especially those for energy efficient appliances in both commercial and residential sectors. They likely helped to shift the equipment market towards more energy efficient technologies and encouraged building performance improvements (Gold and Nadel 2011). Total claims for residential tax credits in 2006 and 2007 and the estimates of the total impact of the tax credits on the government budget are given in Table 3 and Table 4. As with the Italian tax scheme, windows had the highest pick up rates in the residential sector in 2007.
Free ridership is a clear concern for these measures, as with any incentive measure. An effectiveness study on tax credits for energy efficiency improvements between 1978 and 1983 found that 94% of those who filed a claim for a federal tax credit in the past said that they would have made the energy-saving investment even in the absence of the tax incentive (Carpenter and Chester 1994), highlighting free ridership as an important concern. A 2006 study of an Oregon residential tax credit found a survey-based free ridership rate of 53% for heat pumps and 60% for gas furnaces (Itron 2006). This rate might vary significantly with the design of the incentive.
Another study found evidence that larger incentives motivated more investment (Hassett and Metcalf 1995). To avoid the problem of free ridership, current federal tax incentives were designed to cover only the most energy efficient equipment and measures with less than 5%
market share. Nevertheless, the free rider rates of window incentives in 2005 – 2010 remained high (Gold and Nadel 2011).
While tax incentives are often more politically expedient to institute than rebates or grants, they come with several significant relative drawbacks. First, in the U.S. they are more complicated to administer and hard to track, which points to the importance of a careful design.
Second, they are only available to those with sufficient tax liability to make use of them, or to those who can purchase tax liability from others, which raises complexity and transaction costs.
These limitations emphasize the benefit of schemes based on tax credits that also allow households to get reimbursed if tax credits exceed tax liability. Finally, they are not available until the end of the tax year and sometimes must be earned over a period of several years.
Table 4. Budget Impact of U.S. Tax Incentives ($ millions)
FY06 FY07 FY08 FY09 FY10 Total Deduction for certain energy efficient
commercial building property 80 190 170 60 60 560
Credit for energy efficiency in existing homes 230 380 150 570 3,190 4,520 Note: These data estimate the cost to the government of these measures, which will be different (and lower) than the total claims to the extent that not all claimants have sufficient tax liability to benefit from the credit. The numbers are by fiscal year, so for example FY08 includes the last quarter of calendar year 2007 and the first three quarters of 2008. This explains why there is a value for the residential credit in FY08 despite the fact that the credit was not available in the 2008 tax year.
Recent experiences with policy supporting renewable energy in the U.S. points to a further dimension. The U.S. Treasury began offering a cash grant program as an alternative to tax credits for renewables, and it appears that the grant has had considerably more impact per dollar spent than the tax credits (Bipartisan Policy Center 2011; Bolinger 2010). It is unclear, however, whether the experience translates to the building sector. While the incremental cost of thermal retrofit and the level of public support are a small fraction of the total project value, renewable projects rely on a larger share of public support, and regulatory risk might thus be evaluated differently. This points to the importance of evaluating support schemes in the context of specific groups of building owners.
The Netherlands
Although the Netherlands does not have tax credit programs for retrofits in the residential sector, since 1997 energy efficiency and renewable energy tax deductions have been available to all sectors and companies under the Energy Investment Allowance (EIA). Tax deductions cover 41.5% of the investment cost of qualified energy efficient technologies and renewable energies.
The annual investment cost eligible for this tax relief ranges from $3,000 to $162 million (NL Agency 2011). There are five main investment areas eligible for tax reductions: commercial buildings, processes, transport resources, sustainable energy, and energy advice. In the buildings sector, both single measures and comprehensive retrofit investments can be pursued.
Comprehensive measures must improve energy efficiency by at least two energy classes or labels (NL Agency 2011).
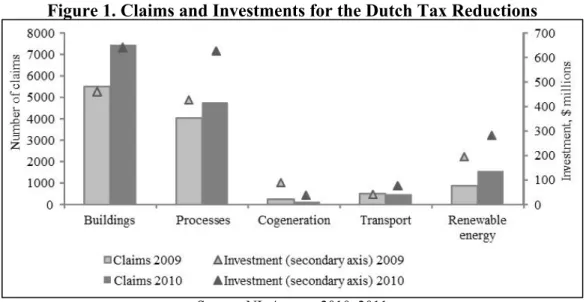
In 2010, companies submitted 14,255 claims for $1.2 billion of investment costs. The number of claims and the investment volume declined during 2007 – 2009, but increased in 2010 (see figure 1). The drop can be partially explained by the overall economic slowdown, the gradual decrease in tax deduction rates from 55% to 41.5% over time, and a narrowing of the list of eligible measures.
Figure 1. Claims and Investments for the Dutch Tax Reductions
Source: NL Agency 2010, 2011
These changes may have decreased the percentage of free riders, which in previous years was as high as 68% for selected technologies. Ex-post evaluation from 2000 to 2005 showed that
some of the measures had high free rider rates. In those years, the average free rider rate was 47%, but rates varied between technologies. For high efficiency glass (HR++ glass), the free rider rate reached 68%; for the installation of heat pumps it was 42%, and for energy efficiency improvements of existing processes, it was 43%. The installation of cogeneration technologies had lowest share of free riders (26%) among the analyzed measures. The authors of the study point out, however, that the free rider numbers might have been overestimated since they were based on the ex-post survey of beneficiaries of the tax incentives (Aalbers 2007).
The largest share of energy efficiency improvements (49% of total claims and 39% of total investment) was implemented in buildings. Companies pursued mainly single measures, such as energy efficient heating and air-exchange systems (44%), lighting (36%), and thermal insulation (14%). Similarly to the Italian scheme, comprehensive retrofits were less popular, accounting for only 3% of total claims. The rate of tax deduction in the Netherlands is also fixed for all measures and, therefore, does not provide additional incentives for comprehensive retrofit.
This cannot be considered a deficiency of the scheme, however, since the scheme is more generic in its objectives and is not focused on the building sector specifically.
Previous evaluations and company surveys indicate that the Dutch tax incentive scheme is simple and attractive to applicants despite its stringent criteria. There are no precise estimates of the overall impact of the EIA tax scheme, particularly with regard to its impact on buildings efficiency. Based on the investment cost reported for EIA tax incentives, total energy savings in 2009 reached 750 m3 of natural gas equivalent per year, which is equal to the annual consumption of 420,000 households. This number, however, does not exclude possible free riders. Additionally, the EIA scheme partially overlaps with other tax incentives, making it more complicated to distinguish the value added by the EIA scheme in particular.
Germany
The German development bank, KfW, is the main financing institution implementing policies in buildings and other energy-related sectors in Germany. Since 1996, KfW has gained substantial experiences with incentivizing thermal retrofit investments in the residential sector through preferential loans and grants. The bank has two main programs designed specifically for energy efficiency investment in the residential buildings sector: “Energy Efficient Renovation”
(Energieeffizient Sanieren) and “Energy Efficient Construction” (Energieeffizient Bauen).
The level of funding available in the form of either loans or grants for retrofit or construction projects is determined by the targeted energy standard. Loans cover total project costs for a value of up to $93,000 per residential unit. They are offered at low interest rates and in conjunction with repayment bonuses. Grants are defined as a share of total project cost, but cannot exceed $18,660 for comprehensive retrofits and 4,660 for single measures per residential unit.
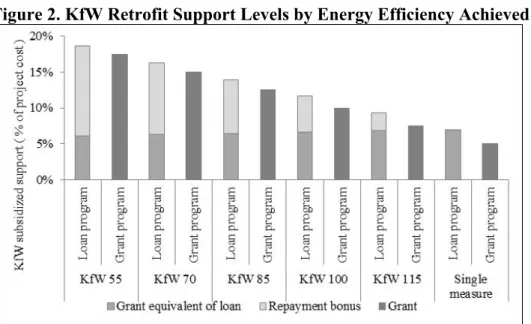
Figure 2 shows the maximum levels of repayment bonuses, grant equivalents of loans, and grants provided by KfW, depending on the level of achieved building performance. In the loan program, grant equivalent is determined by the difference between the market interest rates and concessional KfW rates, and repayment bonuses represent a partial grant attached to a loan provided by KfW. In order to qualify for the highest level of funding, retrofit measures must target the “KfW Efficiency House 55”, or KfW 55, standard, which requires reducing primary energy requirement levels to 55% of that required for a comparable new house. As there is no clear definition of deep retrofit, in this study we consider retrofit to be deep if it improves
thermal performance of a building to at least new construction standard. Hence, retrofits to KfW 55 – KfW 100 standards would be deep, while measures considered to be shallow would achieve less efficient standards.
Figure 2. KfW Retrofit Support Levels by Energy Efficiency Achieved
Source: KfW, CPI calculations
Note: KfW 55 retrofit standard requires achieving reduction of primary energy requirement to 55% of new built standard, KfW 70 to 70%, KfW 85 to 85% of new built standard, and so on.
Since energy-related incremental costs cover on average only one third of total retrofit costs and because support is differentiated according to the level of energy efficiency achieved, around 50% of the incremental thermal-related cost of retrofitting a building to KfW 55 standard can be covered by the combination of KfW repayment bonus and grant equivalent. For less deep retrofit measures (KfW 100), the combined support only covers about 31% of the retrofit cost.
This provides a strong incentive for households to pursue higher levels of efficiency (CPI 2011).
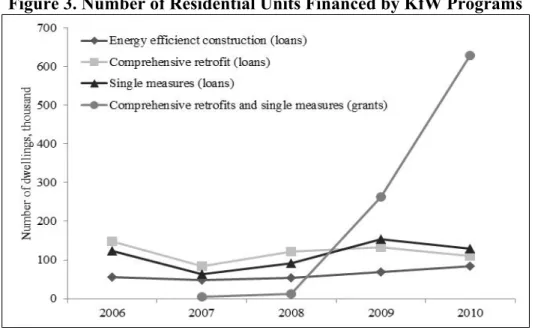
KfW financing for energy-related programs has a significant scope. The total volume of assistance (total lending and grants volume) provided under the Energy Efficient Renovation and Construction programs in 2010 was $11.6 billion, supporting 952,802 residential units (KfW- Bankengruppe, 2011). The programs have been modified several times; the last significant change was implemented in 2009, with the introduction of grant support for single measures as opposed to comprehensive packages. This led to a significant increase in the uptake rate of grants (see Figure 3).
Grants are, on average, the most preferred form of support for energy efficient retrofits, despite the fact that the levels of assistance available in the form of a grant are slightly lower than for loans. Similarly, grants are only available for one-family homes, duplexes or joint ownership associations. This implies that for single measures the majority of households prefer not to take loans if a cash grant option is available. In 2010, KfW provided retrofit grants for more than 600,000 residential units, the highest share among all the programs for energy efficiency in buildings.
Figure 3. Number of Residential Units Financed by KfW Programs
Source: KfW Förderreport 2010, 2011
Figure 4 summarizes the number of comprehensive retrofit and construction projects financed by KfW in 2010. Although deep retrofit measures receive the highest level of support, the number of actual projects remains rather low. Only 112 KfW 55 retrofit projects10 were implemented in 2010. Demand for loans and grants for less deep measures (e.g. KfW 100) was considerably higher, amounting to more than 8,000 retrofit projects in total.
Figure 4. Comprehensive Retrofits and Construction Projects Financed by KfW
Source:KfW Annual Report 2010
Note: Purchases of newly constructed or retrofitted buildings are included as well.
10 One retrofit project can account for more than one residential unit. In 2010, KfW loans were provided to 110,576 residential units for implementing comprehensive retrofits in general. Data on the grant program is not available as well as data on the specific comprehensive retrofit levels (e.g. KfW 70, KfW 55).
In 2010, KfW supported the construction of 84,245 residential units, which, according to preliminary estimates, represent more than 50% of the total residential construction volume. The number of newly constructed KfW 70 and KfW 55 houses considerably exceeds the number of retrofitted houses with the same level of efficiency. This difference is likely due to the greater complexity of carrying out deep retrofits in existing buildings as opposed to implementing energy efficient standards in new construction.
The large scale of its programs and their focus on holistic primary energy reductions make KfW programs an effective tool for promoting energy savings. Additionally, these programs address the fact that financial barriers are among the main obstacles to energy efficiency in the building sector, and capitalize on the social and technological learning effects that ambitious retrofits and new construction programs can achieve. Yet, despite the size and potential impact of KfW programs, there have been surprisingly few ex-post evaluations of their total additional impact. Also, there has been little research on which type of financing instrument (i.e., loan or grant) has the highest impact on energy savings.
Conclusions
Our analysis yields two main observations. First, tax credit programs in the reviewed countries have had high utilization rates among commercial and residential building owners.
However, it is difficult to establish how many thermal retrofits would have been pursued in the absence of the support schemes (i.e. how high the free rider rate is). Studies of tax incentive schemes that support individual retrofit measures in the Netherlands and in the U.S. suggest potentially high free rider rates.
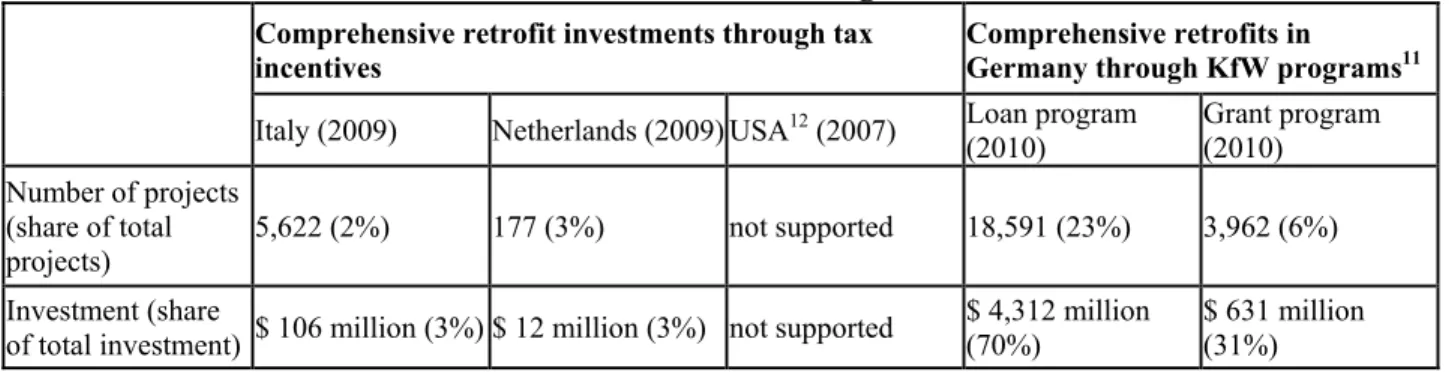
Second, where single measures and comprehensive retrofits receive similar support levels, programs do not appear to deliver a significant share of comprehensive retrofits. As Table 4 indicates, the rate of comprehensive retrofits resulting from tax credit schemes is low (2% of Italy’s tax incentives program and 3% of the Netherlands’ are used for comprehensive retrofits).
Relative shares of tax reliefs in both the Italian and Dutch schemes are not differentiated between the single and comprehensive retrofit measures. This could partially explain the low usage rate of tax credit support for comprehensive measures.
Table 4. Share of Comprehensive Retrofits of Residential and Commercial Buildings Using Tax Incentives and KfW Programmes
Comprehensive retrofit investments through tax
incentives Comprehensive retrofits in
Germany through KfW programs11 Italy (2009) Netherlands (2009) USA12 (2007) Loan program
(2010) Grant program (2010)
Number of projects (share of total
projects) 5,622 (2%) 177 (3%) not supported 18,591 (23%) 3,962 (6%) Investment (share
of total investment) $ 106 million (3%) $ 12 million (3%) not supported $ 4,312 million
(70%) $ 631 million (31%)
While it remains to be seen whether tax incentives are more or less effective than the same level of support delivered in a different form, our analysis of German development bank KfW’s experience with loans and grants suggests that the level of support offered is as important as the type of support. KfW has set the ceiling of financial assistance for comprehensive measures significantly higher than for single measures. For example, in the loan program, comprehensive retrofits that achieve reductions of primary energy use to 85% of that required for a comparable new house are eligible for concessional interest rates and a repayment bonus equivalent to a grant of up to $14,640, while single measures receive a maximum of $4,880 (CPI calculations). This more significant support for comprehensive retrofits could explain why they account for 66% of total investment support from the loan program.
An additional reason for the higher share of comprehensive retrofits in Germany could be that building owners are better informed about energy efficiency options during the retrofit planning process, as they are required to engage a certified expert13 to review the retrofit plans prior to project approval and implementation.
References
Aalbers R., et al. 2007. Ex-post evaluatie Energie Investeringsaftrek.
https://zoek.officielebekendmakingen.nl/kst-31492-8-b1.pdf.
Gold R., and Nadel S.. 2011. Energy Efficiency Tax Incentives, 2005 – 2011: How have they performed? ACEEE White Paper. Washington DC: ACEEE.
[ADEME] Agence de l'Environnement et de la Maîtrise de l'Energie. 2010. Bâtiment - Énergie – Environnement - Édition 2010. http://www2.ademe.fr/
11 Excluding heating. Heating measures included mainly optimization of heat distribution, gas- and oil-condensed boilers and heating systems. KfW support volumes for heating are: a) for loans 17,600 measures for a total investment volume of $ 368 million, b) for grants 213,789 measures for a total investment volume of $ 1.328 million.
12 Federal level incentives
13 A certified expert is an energy advisor with qualifications from the program “Vor-Ort-Beratung” or from the German consumer association (vzbv). This person is also allowed to issue energy performance certificates defined under German building standards (§21 EnEV).
Bipartisan Policy Center. 2011. Reassessing Renewable Energy Subsidies, Issue Brief.
http://bipartisanpolicy.org/sites/default/files/BPC_RE%20Issue%20Brief_3-22.pdf [BMWi] Federal Ministry of Economics and Technology. 2010. Energiekonzept. Für eine
umweltschonende, zuverlässige und bezahlbare Energieversorgung. Berlin.
Bolinger M., et al. 2010. Preliminary Evaluation of the Impact of the Section 1603 Treasury Grant Program on Renewable Energy Deployment in 2009. URL:
http://eetd.lbl.gov/ea/emp
Carpenter, E.H. and Chester, S.T. Jr. 1994. Are federal energy tax credits effective: a Western United States survey. Energy Journal (5) 2.
Clausnitzer, K. D. et al. 2010. Effekte der Förderfälle des Jahres 2009 des CO2 –
Gebäudesanierungsprogramms und des Programms Energieeffizient Sanieren. Bremer Energie Institut. Bremen
[CPI] Climate Policy Initiative. 2011. Meeting Energy Concept Targets for Residential Retrofits in Germany. Economic Viability, Financial Support, and Energy Savings.
http://climatepolicyinitiative.org/wp-content/uploads/2011/12/Costs-Benefits-and- Financial-Support-for-Thermal-Retrofit.pdf. Berlin
dena/IWU 2010, dena-Sanierungsstudie. Teil 1: Wirtschaftlichkeit energetischer Modernisierung im Mietwohnungsbestand.
http://www.dena.de/fileadmin/user_upload/Presse/studien_umfragen/Sanierungsstudie/de na-Sanierungsstudie_Teil_1_MFH.pdf. Berlin.
[ENEA] Italian National Agency for New Technologies, Energy and Sustainable Economic Development. 2010a. Annual Report. Le detrazioni fiscali del 55% per la riqualificazione energetica del patrimonio edilizio esistente nel 2009. Rome.
[ENEA] Italian National Agency for New Technologies, Energy and Sustainable Economic Development. 2010b. Analisi sull’impatto socio-economico delle detrazioni fiscali del 55% per la riqualificazione energetica del patrimonio edilizio esistente. Rome
[GAO] Government Accountability Office. 2010. Status of Residential Energy Credits IRC 25 (C). Briefing for Requestors’ Staff October 29, 2010. Washington, D.C.
Gillingham K., et al. 2006. Energy Efficiency Policies: A Retrospective Examination. Annual Review of Environment and Resources (31): 161-192.
Hassett K. A., and Metcalf G. E., 1995. “Energy tax credits and residential conservation investment: Evidence from panel data.” Journal of Public Economics (57) 201-217.
Itron, Inc., 2006. 2003-2004 Home Energy Savings Program Residential Impact Evaluation.
Prepared for the Energy Trust of Oregon
[IWU] Institut Wohnen und Umwelt. 2008. Wirtschaftlichkeit energiesparender Maßnahmen für die selbst genutzte Wohnimmobilie und den vermieteten Bestand. Darmstadt.
[IWU/BEI] Institut Wohnen und Umwelt and Bremer Energie Institut. 2010. Datenbasis Gebäudebestand. Datenerhebung zur energetischen Qualität und zu den
Modernisierungstrends im deutschen Wohngebäudebestand.
http://www.iwu.de/fileadmin/user_upload/dateien/energie/klima_altbau/Endbericht_Date nbasis.pdf. Darmstadt.
KfW-Bankengruppe 2011, Förderreport 2010 KfW-Bankengruppe.
http://www.kfw.de/kfw/de/KfW-
Konzern/Unternehmen/Erfolg/Erfolg_in_Zahlen/Foerderreport/index.jsp. Frankfurt.
NL Agency. 2011. Energy & Businesses. Energy List 2011.
http://www.agentschapnl.nl/sites/default/files/bijlagen/Energylist%20EIA%202011.pdf.
Hague
NL Agency. 2010. Annual Report 2009, Jaarverslag EIA.
http://www.agentschapnl.nl/content/jaarverslag-eia-2009. Hague NL Agency. 2011. Annual Report 2010, Jaarverslag EIA.
http://www.agentschapnl.nl/content/jaarverslag-eia-2010. Hague
Viser E., et al. 2006. Evaluation of the energy investment deduction scheme in the Netherlands.
http://www.aid-ee.org/documents/010EIA-Netherlands.PDF.