Research Collection
Report
Willingness-To-Pay and Ranking of Preferences for Heat Mitigation Measures in Singapore
Author(s):
Borzino, Natalia; Chng, Samuel; Nevat, Ido; Schubert, Renate Publication Date:
2020-09-09 Permanent Link:
https://doi.org/10.3929/ethz-b-000439152
Rights / License:
In Copyright - Non-Commercial Use Permitted
This page was generated automatically upon download from the ETH Zurich Research Collection. For more information please consult the Terms of use.
DELIVERABLE TECHNICAL REPORT
Version 09/09/2020
2.3.2 – WILLINGNESS-TO-PAY AND RANKING OF PREFERENCES FOR HEAT MITIGATION MEASURES IN
SINGAPORE
Project ID NRF2019VSG-UCD-001
Project Title Cooling Singapore 1.5:
Virtual Singapore Urban Climate Design
Deliverable ID
2.3.2 Willingness-to-Pay and Ranking of Preferences for Heat Mitigation Measures in Singapore
Authors Natalia Borzino, Samuel Chng, Ido Nevat and
Renate Schubert DOI (ETH Collection)
Date of Report 09/09/2020
Version Date Modifications Reviewed by
1 25/08/2020 Renate Schubert
2 31/08/2020 Ido Nevat
3 5/09/2020 Leslie Norford
1 Abstract
In many countries, Urban Heat Island (UHI) effects come along with urbanization in metropolitan areas.
They have relevant adverse effects on the health and wellbeing of citizens and Singapore is strongly affected by UHI. In this study, we assess Singaporeans and Permanent Residents’ Willingness To Pay (WTP) for five different heat mitigation measures as well as their ranking of implementation preference.
Specifically, we employ a double-bounded dichotomous survey design on a representative sample of 670 online respondents living in commercial and residential areas (i.e. 340 in the CDB and 330 in Punggol areas, respectively) of Singapore. The five mitigations under evaluation are related to vegetation (covered sidewalks and urban parks), shading (shaded plazas) and new technologies (electric vehicles and district cooling systems). Our results suggest that even though Punggol and CBD populations prefer the implementation of vegetation measures as the main way to improve outdoor thermal comfort and decrease UHI effect, they are willing to contribute considerable amounts of their income towards the implementation of new technologies in Singapore (i.e. electric vehicles and district cooling). This suggests the high level of people’s support and acceptance for new ways to improve thermal comfort. We find that the annual mean WTP value for the five mitigation strategies among Singapore citizens and Permanent Residents living in Punggol and CBD areas is estimated at SGD$
38.893 million and SGD$ 63.922 million, respectively. The total annual WTP for both areas is estimated at SGD$ 102.815 million, the equivalent of USD$ 75million per year. Furthermore, demographic and socio-economic characteristics are significant determinants of Singaporeans and Permanent Residents’ WTP in Punggol and CBD. The WTP for each of the five mitigations increases with education and health but decreases with age. Additionally, people with children are willing to pay more. Additional analyses show that the level of heat awareness, positive attitudes towards heat mitigation strategies as well as preferences for outdoor activities are positively correlated with the different WTP amounts. Our findings suggest that citizens are aware of the impacts of urban heat and support mitigation measures to be financed by their taxes. Policy interventions to promote urban-heat-related education and the dissemination of related information might increase the support of heat mitigation policies.
Table of Content
1 Abstract ...1
2 Introduction ...4
2.1 Objectives ...6
3 Methods ...6
3.1 Survey design ...6
3.2 WTP assessment ...8
4 Results ...14
4.1 Descriptive statistics ...14
4.2 WTP estimation results ...16
4.3 Ranking of implementation preference ...22
5 Conclusions ...24
5.1 Summary of findings ...24
5.2 Recommendations and next steps ...25
6 References ...26
7 Appendix 1: Survey questionnaire ...29
2 Introduction
The Urban Heat Island (UHI) effect means that, due to human activities, an urban or metropolitan area is significantly warmer than its surrounding non-urban areas. Higher anthropogenic heat and reduced urban vegetation are the main causes of the UHI effect, which results in serious impact on the well- being, human behaviour, infrastructures, the economy and the natural environment (Estrada et.al., 2017). Furthermore, recent studies found a negative impact of UHI effect on human health (Sailor and Dietsch, 2007, Costa et. al., 2014; Godish et. al., 2014; World Health Organization, 2014), and mortality and morbidity rates, especially for older people (Rocklov et al, 2014). The UHI effect is also related to urban haze and could decrease workers’ productivity by as much as 10% during the day (Kjellstrom et al., 2016). In addition, the UHI effect increases the energy consumption, principally due to air- conditioning use (Priyadarsini, 2009; Taslim et al., 2015; Wang et al., 2016), which further deteriorates air quality and increases greenhouse gas emissions ( Walcek and Yuan, 1995; Taha, 1997; Cohen et al. 2004).
Singapore has experienced a rapid urbanisation and expansion during the past few decades and the UHI effect is one of the best-known climate-related consequence of urbanization. The high pace of urbanization is diminishing forest density in Singapore, which already has the lowest amount of its original forest areas left intact among its Southeast Asian neighbours (Corlett, 2011). Of the original lowland tropical rainforest that almost entirely covered the island before the founding of modern Singapore in 1819, only 200 hectares (Corlett, 2011), or 0.28% of its current total land area of 714 km2 remained by 2012 (Tan and Hamid, 2014), decreasing even more to 0.23% in 2015.
Consequently, further urbanization might intensify the UHI effect in Singapore.
The peak UHI magnitude in Singapore occurs approximately six hours after sunset with a maximum of 7°C difference observed at the Central Business District (CBD) compared with the one at Natural Reservoir (baseline) at the north of the island at the same time (Chow and Roth, 2006). A range of measures has been identified to mitigate UHI and improve outdoor thermal comfort (Dos Santos et al, 2017; Chun and Guldmann, 2018) and has been summarised in a catalogue, which details eighty mitigation strategies that are already implemented or could be beneficial for Singapore (Ruefenacht and Acero, 2017). Past studies have assessed and demonstrated the effectiveness of different strategies to mitigate heat in Singapore such as green roofs, green facades and greenery (Wong et al, 2003; Li and Norford, 2016), vertical greenery (Wong et al, 2009; Wong et al, 2010), green pavement (Wong et al, 2009), trees and vegetations, green vegetated infrastructure and urban building morphology (Aflaki et al., 2017). Furthermore, recent works have also studied the effectiveness of new technologies in mitigating urban heat emission like electric vehicles (Ivanchev and Fonseca, 2020;
Kayanan et.al, 2020) and district cooling systems (Inayat and Raza, 2019).
While the Singaporean government has been implementing urban heat mitigation strategies across the entire country, the magnitude of positive impacts on the population’s well-being resulting from such investments remains unclear. Furthermore, it is unknown whether Singaporeans and Permanent Residents are willing to contribute towards investments into urban heat mitigating measures and what factors would influence their contributions. Making an informed decision about this requires citizens to be able to assess the (net) benefits of the respective measures. Thus, increasing citizens’ awareness of UHI related costs and benefits could be a critical first step (Zhang et al., 2019a). Understanding these, policy-makers can take into account the public’s assessment and acceptance of heat mitigation measures (Zhang et al., 2019a; Zhang et al., 2019b).
Willingness-To-Pay (WTP) refers to the maximum willingness to pay for a good or service. UHI mitigation could be such a good. Eliciting the citizens’ WTP for mitigation measures informs us whether the public favours the benefits of potential mitigation measures and the degree to which they are willing to contribute to obtaining such benefits. Theoretically, the WTP amount would be equal to the perceived well-being and satisfaction when urban heat and UHI is mitigated and outdoor thermal comfort is improved as a consequence. Outdoor thermal comfort is used to map individuals’ satisfaction with the thermal environment when they are outdoors (Borzino et al., 2020). In order to assess Singaporeans’
WTP for urban heat mitigation, we refer to the Contingent Valuation Method (CVM) that is widely used to valuate non-market goods (Carlsson et al., 2010). This method can be seen as a variant of the Stated Preference (SP) methodology, involving a direct questioning of people to elicit their WTP for urban heat mitigation in our case.
A recent study (Borzino et.al, 2020) estimated Singaporeans and Permanent Residents’ WTP for a bundle of UHI mitigation strategies for Singapore with a representative sample of the Singapore population of 2033 participants. The results suggested that Singapore citizens were willing to sacrifice on average 0.43% of their annual income annually for a policy intervention that guarantees the implementation of UHI mitigation measures. Official data indicates that there were 3.17 million Singaporean and Permanent Residents over 20 years old at the time of the survey and so, the population of Singapore’s WTP value for the implementation of mitigation strategies was estimated at SGD$ 783.08 million annually, the equivalent of US$ 563.80 annually (95% CI [US$ 151.048 m-US$
747.87 m]). Furthermore, their findings suggested that there was a positive and significant relationship between the size of UHI effects and the citizens’ WTP. People living in the region with the highest intensity of UHI were willing to pay 3.09 times more than those living in the region with the lowest UHI intensity. In addition, demographic and socio-economic characteristics were significant determinants of Singaporean and Permanent Residents’ WTP. The WTP increased with income and education but decreased with age. Students, men and people with children were willing to pay more.
Additional analyses showed that the level of UHI awareness, positive attitudes towards UHI mitigation strategies as well as preferences for outdoor activities were positively correlated with the WTP. Citizens
also seemed aware of the impacts of UHI and urban heat and supported mitigation measures to be financed by their taxes. These suggest that policy interventions to promote UHI-related education and disseminating UHI-related information could increase the support of UHI and urban heat mitigation policies.
However, it is not clear how much citizens are willing to pay for different heat mitigation strategies and whether there is a preference for different mitigation strategies according to their perceived effectiveness in improving outdoor thermal comfort. Understanding these is important when assessing which mitigation strategy to implement and where to implement them at the local level.
2.1 Objectives
In this study, we explore 1) Singaporeans and Permanent Residents’ preference for the implementation of different urban heat mitigation strategies in Singapore, including new technologies (i.e. covered sidewalks; urban parks, shaded plazas, district cooling systems and electric vehicles); 2) their WTP for the implementation of each mitigation strategy under evaluation; and (3) the key determinants of the elicited WTP, i.e. demographic and socio-economic factors, knowledge and information, attitudes, the relevance of being outdoors according to the prevalent lifestyles.
We address these research questions using samples from two different neighbourhoods in Singapore:
Punggol and CBD, which represent residential and commercial areas, respectively. This allows us to study how people’s ranking of preferences and the WTP amounts for the different mitigation measures differ within each studied area.
3 Methods
3.1 Survey design
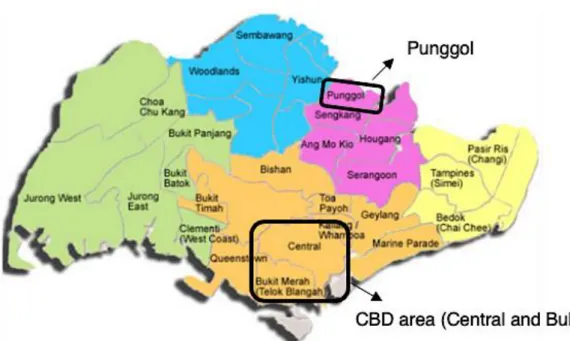
We implemented an online survey in a commercial and residential area in Singapore (i.e. Punggol and Central Business District (CBD), respectively; see Figure 1 for a map) between January and March 2020, i.e. the cooler season in Singapore. The study was not conducted in the historically warmers months of the year (i.e., April and May) to avoid an overestimation of WTP values due to recency and primacy effects when experiencing seasonally high temperatures.
A total of 670 responses was collected, with 340 Singaporeans and Permanent Residents living in the CBD area and 330 in the Punggol area. Both samples were representative for their respective neighbourhoods with respect to gender, age and income. Institutional Review Board (IRB) approval
was obtained from ETH Zurich before the conducting the study1. All participation was voluntary and based on an opt-in principle.
Figure 1: Singapore map and the survey sites.
The survey questionnaire had five different sections (see Appendix 1 for the survey questionnaire). In the first section, we collected demographic and socio-economic characteristics of our participants as well as their level of awareness of need for urban heat mitigation measures, attitudes towards implementing these mitigation measures and their preferences for outdoors activities. However, for the demographic questions or any other question, which could be considered sensitive, we provided an “I prefer not to answer” option so that respondents had a way to bypass a question without having to provide any sensitive information. This also helps to lower the number of respondents who would choose to provide an inaccurate answer just to move forward with the survey, helping our data to remain as clean and valid as possible. In the second section, we presented to the participants a framing detailing the air temperature situation in a typical day at 2pm in Singapore (see Appendix 1, survey questionnaire, Part 3.1. for the image and description). In the third section, participants were presented with five mitigation strategies under evaluation (i.e. covered sidewalks, urban parks, shaded plazas, district cooling systems and electric vehicles). Each mitigation strategy was presented using an image and a short factual description of its benefits (see Appendix 1, survey questionnaire for images and description of the mitigation measures presented to the participants). After each mitigation strategy was presented, their WTP (see Section 3.2. for details) for that particular strategy was elicited. To avoid any
1The purpose of the IRB is to assure that appropriate steps are taken to protect the rights and welfare of humans participating as subjects in a research study. Institutional Review Boards safeguard ethical conduct of research concerning both national and international norms, regulations or codes.
ordering bias, we randomised the order in which the mitigation strategies are presented to each participant. In the fourth section, participants ranked the five mitigation strategies according to their preference of them being implemented in Singapore. In the fifth section, we presented two possible implementation options for each of the five mitigation strategies and asked participants to state which option they would like to see implemented in their area (see Figure 2 for the possible options for each mitigation strategy).
Figure 2: The five mitigation strategies under evaluation (i.e. electric vehicles; district cooling systems; urban parks, covered sidewalks and shaded plazas) and their two possible options for each mitigation strategy
3.2 WTP assessment
Contingent Valuation Method
We estimate Singaporeans and Permanent Residents’ WTP for the implementation of different measures to mitigate heat in Punggol and CBD areas through the CVM. Theoretically, the amount of money respondents agree to pay for urban heat and UHI mitigation should be equal to the welfare they obtain from improvements of their outdoor thermal comfort (Quah and Mishan, 2007; Lin et al., 2011;
Huang, 2015; Zhang et al., 2019b). In turn, this should be equal to the costs imposed on them by the differential heat they are exposed to. The CVM can hence capture the costs of UHI that are not captured with market-based valuation methods and can thereby contribute to a holistic assessment of urban heat impacts as well as of the benefits of heat mitigation measures.
Covered Side-walks Shaded Plazas
Shaded Plazas under Canopy
Shaded Plazas under Building District Cooling
Systems
Electric Vehicles Urban Parks
Small-scale Urban Parks Large-scale Urban
Parks Electric Buses
Electric buses and Cars
Split Units Aircon
District Cooling Plants
Covered Side-walk through Canopy
Covered Side-walk through Vegetation
For elicitation of WTP, we selected the Doubled-Bounded Dichotomous Choice (DBDC) methodology.
Compared with the other commonly used formats like Single-Bounded Dichotomous Choice (SBDC) or open-ended surveys, the DBDC method provides the most conservative results in experimental research (Soon and Ahamad, 2015), the most accurate and consistent responses (Carson and Hanemann, 2005) and the most statistically efficient estimation of the WTP (Hanemann et al., 1991).
In our DBDC survey, we asked respondents to respond “YES” or “NO” to a hypothetical policy of a mandatory mitigation fund, whereby each Singaporean or Permanent Resident would pay a fixed fraction of their annual income to guarantee that the Government will implement a particular urban heat mitigation measure (we evaluated 5 in total). The questions were worded to be realistic and tangible, in the sense that they described a hypothetical government policy that respondents could visualise (refer to Appendix 1). The time frame in the questions was one year, associating a potential payment with their annual income for the next year, to make it easier for respondents to elicit their WTP.
In our study, we used the personal income tax as the payment vehicle as respondents may feel confused when asked directly about their WTP. In previous Contingent Valuation studies, the most commonly used payment vehicles included taxes, funds, donations, ticket fees, etc. According to (Lin eta al., 2017), a payment vehicle with a mandatory feature can effectively reduce the free-riding and over-pledging of respondents. In addition, Singaporeans and Permanent Residents are more familiar with personal income tax compared to other forms of taxation (Lin et al., 2017; Borzino et al., 2020).
The acceptance of this payment vehicle was tested and confirmed during our pilot study.
Conventional DBDC-CV model
The information that is directly elicited from an individual i, when a contingent valuation questionnaire is applied using a DBDCV model, consists of two binary answers: whether he/she (1) accepts the first bid (YES or NO) and (2) accepts the second bid (YES or NO). If the initial bid is rejected, a lower bid is presented; otherwise a higher bid will be proposed. Hence, there are four possible outcome combinations in the respective decision tree: “YES-YES”; “NO-NO”; YES-NO”; and “NO-YES”.
Following Lopez Feldman (2012), let us call the first bid amount 𝑡𝑖1 and the second one 𝑡𝑖2 for each respondent i. Then, each of the participants will be in one of the following categories:
1. If a subject answers YES to the first question and NO to the second question, we can infer that 𝑡𝑖1 ≤ WTP < 𝑡𝑖2.
2. If a subject answers YES to the first question and YES to the second, then 𝑡𝑖2 ≤ WTP < ∞.
3. If a subject answers NO to the first question and YES to the second, then 𝑡𝑖2 ≤ WTP < 𝑡𝑖1. 4. If a subject answers NO to the first and to the second question, then we have 0 < WTP < 𝑡𝑖2.
Now, let us define 𝐷𝑖1 and 𝐷𝑖2 as dichotomous variables that capture the YES-NO responses (i.e., YES is equal to 1, otherwise 0) to the first question (𝐷𝑖1) and to the second question (𝐷𝑖2) for a respondent i. The probability that an individual’s answers, for example, YES to the first question and NO to the second can then be expressed as:
Pr(𝐷𝑖1= 1, 𝐷𝑖2= 0|𝑧𝑖) = Pr(𝑌𝐸𝑆, 𝑁𝑂) (1) where 𝑧𝑖 is a vector of explanatory variables, such as demographic or socio-economic characteristics, etc. In order to simplify the notation, the right-hand side of the expression omits the fact that the probability is conditional on the values of the explanatory variables. Let us further assume that it is possible to estimate the WTP of a respondent i based on the following linear model [63,64]:
𝑊𝑇𝑃𝑖 (𝑧𝑖, 𝑢𝑖) = 𝑧𝑖′𝛽 + 𝑢𝑖 (2) where 𝛽 is a vector of parameters; 𝑧𝑖′ is a vector with the values of the explanatory variables and u as error term. The error term is assumed to follow a normal distribution: 𝑢𝑖 ~𝑁(0, 𝜎2) [64].
Given these assumptions, we have that the probability of each one of the four possible outcomes is given by:
1. 𝐷𝑖1= 1 𝑎𝑛𝑑 𝐷𝑖2= 1
𝑃𝑟(𝑌𝐸𝑆, 𝑌𝐸𝑆) = 𝑃𝑟 (𝑡1< 𝑊𝑇𝑃 ≥ 𝑡2) = 𝑃𝑟 ( 𝑧𝑖′𝛽 + 𝑢𝑖> 𝑡1 , 𝑧𝑖′𝛽 + 𝑢𝑖≥ 𝑡2) Using the conditional probability rule, which says that Pr (A , B) = Pr (A|B) * Pr (B), we have:
𝑃𝑟( 𝑌𝐸𝑆, 𝑌𝐸𝑆) = 𝑃𝑟 ( 𝑧𝑖′𝛽 + 𝑢𝑖≥ 𝑡1| 𝑧𝑖′𝛽 + 𝑢𝑖≥ 𝑡2) ∗ 𝑃𝑟 ( 𝑧𝑖′𝛽 + 𝑢𝑖≥ 𝑡2) Here by definition 𝑡2> 𝑡1 and then: 𝑃𝑟 ( 𝑧𝑖′𝛽 + 𝑢𝑖≥ 𝑡1| 𝑧𝑖′𝛽 + 𝑢𝑖≥ 𝑡2) = 1, which implies:
𝑃𝑟( 𝑌𝐸𝑆, 𝑌𝐸𝑆) = 𝑃𝑟 ( 𝑢𝑖≥ 𝑡2− 𝑧𝑖′𝛽)
As we assume that 𝑢𝑖 ~𝑁(0, 𝜎2), we have that:
𝑃𝑟( 𝑌𝐸𝑆, 𝑌𝐸𝑆) = 𝑃𝑟 ( 𝑣𝑖≥𝑡2− 𝑧𝑖′𝛽
𝜎 ) = 1 − Φ (𝑡2− 𝑧𝑖′𝛽 𝜎 ) where 𝑣𝑖 ~𝑁(0,1) and Φ(𝓍) is the standard cumulative normal distribution. Therefore, by symmetry of the normal distribution, we have:
𝑃𝑟(𝑌𝐸𝑆, 𝑌𝐸𝑆) = Φ (𝑧𝑖′𝛽 𝜎−𝑡2
𝜎)
(3)
2. 𝐷𝑖1= 1 𝑎𝑛𝑑 𝐷𝑖2= 0
𝑃𝑟(𝑌𝐸𝑆, 𝑁𝑂) = 𝑃𝑟(𝑡1≤ 𝑊𝑇𝑃 < 𝑡2) = 𝑃𝑟 (𝑡1− 𝑧𝑖′𝛽 𝜎 ≤𝑢𝑖
𝜎 <𝑡2− 𝑧𝑖′𝛽
𝜎 ) = Φ (𝑡1− 𝑧𝑖′𝛽
𝜎 ) − Φ (𝑡2− 𝑧𝑖′𝛽 𝜎 )
where the last expression follows from 𝑃𝑟(𝑎 ≤ 𝑋 < 𝑏) = 𝐹(𝑏) − 𝐹(𝑎) and where F(.) represents the cumulative distribution function. Therefore, using symmetry of the normal distribution we have that:
𝑃𝑟 (𝑌𝐸𝑆, 𝑁𝑂) = Φ (𝑧𝑖′𝛽 𝜎−𝑡1
𝜎) − Φ (𝑧𝑖′𝛽 𝜎−𝑡2
𝜎) (4)
3. 𝐷𝑖1= 0 𝑎𝑛𝑑 𝐷𝑖2= 1
𝑃𝑟(𝑁𝑂, 𝑌𝐸𝑆) = 𝑃𝑟 (𝑡2≤ 𝑊𝑇𝑃 < 𝑡1) = 𝑃𝑟 (𝑡2−𝑧𝑖′𝛽
𝜎 ≤𝑢𝑖
𝜎 <𝑡1−𝑧𝑖′𝛽
𝜎 ) = 𝛷 (𝑡2−𝑧𝑖′𝛽
𝜎 ) − 𝛷 (𝑡1−𝑧𝑖′𝛽
𝜎 )
𝑃𝑟 (𝑁𝑂, 𝑌𝐸𝑆) = 𝛷 (𝑧𝑖′ 𝛽
𝜎−𝑡2
𝜎) − 𝛷 (𝑧𝑖′ 𝛽
𝜎−𝑡1
𝜎) (5)
4. 𝐷𝑖1= 0 𝑎𝑛𝑑 𝐷𝑖2= 0
𝑃𝑟(𝑁𝑂, 𝑁𝑂) = 𝑃𝑟 (𝑡2> 𝑊𝑇𝑃 < 𝑡1) = 𝑃𝑟 ( 𝑧𝑖′𝛽 + 𝑢𝑖< 𝑡2) = Φ (𝑡2− 𝑧𝑖′𝛽 𝜎 )
𝑃𝑟(𝑁𝑂, 𝑁𝑂) = 1 − Φ (𝑧𝑖′𝛽 𝜎−𝑡2
𝜎) (6)
In order to proceed with the estimation, we construct a likelihood function with Equation (3) to (6) to obtain estimates for 𝛽 and 𝜎 using a maximum likelihood estimation. In practice, it is convenient to work with the natural logarithm of the maximum likelihood function, called log-likelihood. Therefore, the function that needs to be maximized in order to find the parameters of the model is:
𝑙𝑛𝐿 = ∑ [𝑅𝑖𝑌𝑌𝑙𝑛 (Φ (𝑧𝑖′ 𝛽 𝜎−𝑡2
𝜎) ) + 𝑅𝑖𝑌𝑁𝑙𝑛 (Φ (𝑧𝑖′ 𝛽 𝜎−𝑡1
𝜎) − Φ (𝑧𝑖′ 𝛽 𝜎−𝑡2
𝜎))
𝑁
𝑖=1
+ 𝑅𝑖𝑁𝑌𝑙𝑛 (Φ (𝑧𝑖′ 𝛽 𝜎−𝑡2
𝜎) − Φ (𝑧𝑖′ 𝛽 𝜎−𝑡1
𝜎))
+ 𝑅𝑖𝑁𝑁𝑙𝑛 (1 − Φ (𝑧𝑖′ 𝛽 𝜎−𝑡2
𝜎) )]
(7) Where N is the total number of respondents and 𝑅𝑖𝑌𝑌; 𝑅𝑖𝑁𝑁; 𝑅𝑖𝑌𝑁; 𝑅𝑖𝑁𝑌 are binary variables indicating each of the four possible outcomes described above for each individual i:
𝑅𝑖𝑌𝑌(if the responses of ith person are ‘yes-yes’=1; 0 otherwise) 𝑅𝑖𝑌𝑁 (if the responses of ith person are ‘yes-no’=1; 0 otherwise) 𝑅𝑖𝑁𝑌 (if the responses of ith person are ‘no-yes’=1; 0 otherwise) 𝑅𝑖𝑁𝑁 (if the responses of ith person are ‘no-no’=1; 0 otherwise)
The variables 𝑅𝑖𝑌𝑌; 𝑅𝑖𝑁𝑁; 𝑅𝑖𝑌𝑁; 𝑅𝑖𝑁𝑌 take the values of one or zero depending on the relevant responses for each individual. Equation (7) shows that a given individual contributes to the logarithm of the likelihood function in only one of its four parts. This approach allows us the direct estimation of 𝛽 and 𝜎 using the maximum likelihood method. The estimation of the WTP will depend also on the values that we have for the vector 𝑧𝑖′ (i.e., the values of the explanatory variables).
3.2.2.1 Spike Model
To deal with NO-NO responses, we apply the spike model suggested by Kristrom (1997) and Yoo and Kwak (2002). The respondents who gave “NO-NO” response were presented with a following-up question, in order to distinguish real zero WTP samples from the positive one. 𝑅𝑖𝑁𝑁 can be classified into 𝑅𝑖𝑁𝑁𝑌 and 𝑅𝑖𝑁𝑁𝑁.
𝑅𝑖𝑁𝑁𝑌 (if the response of ith sample is ‘no-no-yes’=1; 0 otherwise) 𝑅𝑖𝑁𝑁𝑁 (if the response of ith sample is ‘no-no-no’=1; 0 otherwise)
The log-likelihood function for the spike model is given by:
𝑙𝑛𝐿 = ∑ [𝑅𝑖𝑌𝑌𝑙𝑛 (Φ (𝑧𝑖′ 𝛽
𝜎−𝑡2
𝜎) ) + 𝑅𝑖𝑌𝑁𝑙𝑛 (Φ (𝑧𝑖′ 𝛽
𝜎−𝑡1
𝜎) − Φ (𝑧𝑖′ 𝛽
𝜎−𝑡2
𝜎)) + 𝑅𝑖𝑁𝑌𝑙𝑛 (Φ (𝑧𝑖′ 𝛽
𝜎−𝑡2
𝜎) −
𝑁𝑖=1
Φ (𝑧𝑖′ 𝛽
𝜎−𝑡1
𝜎)) + 𝑅𝑖𝑁𝑁𝑌𝑙𝑛 (1 − Φ (𝑧𝑖′ 𝛽
𝜎−𝑡2
𝜎) − ( 1
𝜎√2𝜋 𝑒−
1 2 (0−𝑧𝑖𝜎′𝛽)
2
)) + 𝑅𝑖𝑁𝑁𝑁𝑙𝑛 ( 1
𝜎√2𝜋 𝑒−
1 2 (0−𝑧𝑖𝜎′𝛽)
2
)] (8)
WTP elicitation procedure
We elicited the WTP for each mitigation strategy. Again, the order of the mitigation was randomised to avoid any ordering bias. The procedure implemented for WTP elicitation of each mitigation is described as follows:
a) First bid: We asked the respondents to state “YES” or “NO” when asked whether they would support a policy whereby all people permanently living in Singapore would pay a specific percentage (X1) of their annual incomes for the implementation of each of the five urban heat mitigations under evaluation in Singapore. The percentage value per each mitigation and participant was randomly chosen from seven possible bid-bundles previously established as plausible during a pilot survey (see Table 1). To facilitate visualization, respondents were also presented with a numerical calculation of what this percentage (X1) of their annual income would be. The bids design was calculated based on the WTP results from a pilot study with 40 respondents. These respondents were exposed to the same main survey but with an open-ended Contingent Valuation format. We trimmed 10% off both tails of bid distribution, and then seven bid combinations for the main survey were selected from the remaining distribution. The methodology for selection of final seven bid combination
followed the seminal work of Cooper (1993) in which it is suggested that the optimal bid design is the one that minimizes the square errors.
Table 1: Bid design for the DBDC-CV method
b) Second bid: If a respondent answered “YES” to the first bid, the respondent is then asked to respond to the same question again but with a higher bid value (Xhigh) (see Table 1). If a respondent answers “NO” to the first bid, the respondent is presented with a lower second bid (Xlow). The consecutive two questions presented a decision tree with four different outcomes. Figure 2 displays the flowchart and illustrates steps (4) and (5) of this protocol.
The data collected from each respondent comprise the random bid-bundle assigned to her, the three bids values associated with the particular bid-bundle number (i.e. X1, Xhigh and Xlow) and the outcome of her decisions (i.e. “YES-YES”, “YES-NO”,”NO-YES”,”NO-NO”) as described in Figure 2.
To those who answered to the bids “NO-NO”, we furtherly asked whether they were willing to pay any positive amount. The objective of this question is to discriminate those respondents who were willing to pay a positive amount than those whose WTP was zero.
These participants could answer “YES” or “NO” to the additional question.
Bid Bundles
Random Number 1 2 3 4 5 6 7
First bid (X1) 0.05% 0.15% 0.25% 0.50% 0.75% 1.00% 1.50%
Second bid (Xhigh) 0.15% 0.25% 0.50% 0.75% 1.00% 1.50% 2.00%
Second bid (Xlow) 0.025% 0.05% 0.15% 0.25% 0.50% 0.75% 1.00%
Figure 2: Decision tree of the Double-Bounded Dichotomous Choice survey used. The bid values X1, XHigh and XLow were randomly varied across the surveys following Table 1.
4 Results
4.1 Descriptive statistics
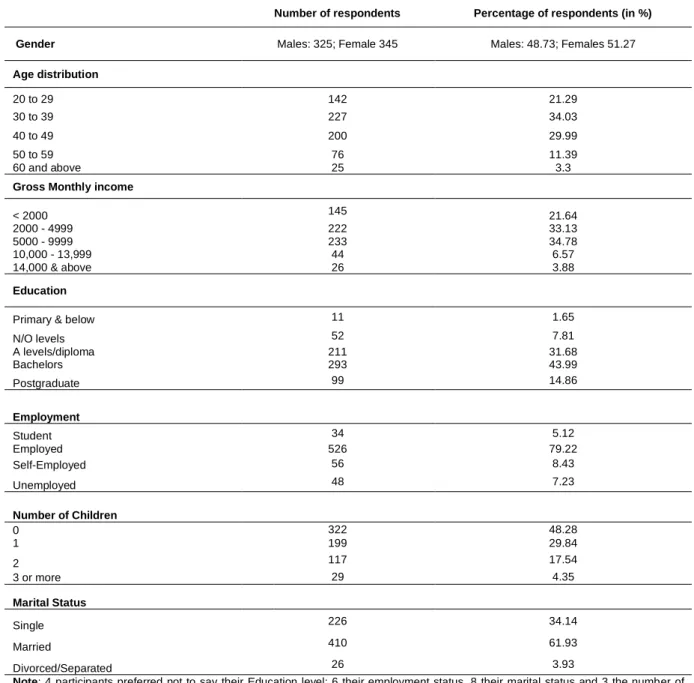
Table 2 displays the descriptive statistics of the demographic and socio-economic characteristics of our sample. Following Table 2, we observe that our sample is mostly composed by people with A Levels and Bachelor’s degree (75.67% of the sample size); employed (79.22%) and married (61.93%).
Respondents with no children account for almost half of the sample (48.28%) while the rest 51.72%
had at least one child. The mean annual income of our aggregated sample is SGD$ 61,401.
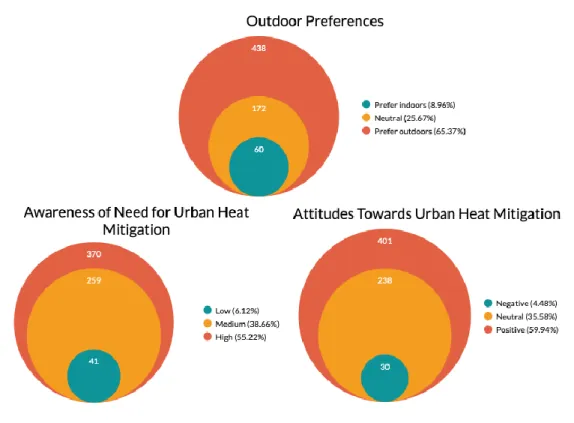
Figure 3 displays the descriptive statistics of the psychological variables included in our survey questionnaire. The three variables “Level of awareness of need for heat mitigation” and “Level of attitudes towards mitigation strategies” are divided in three ordered categories: “low” “neutral” and
“high”, while “Outdoors preferences” is divided in “prefer to be indoors”, “neutral” and “prefer to be outdoors”. We observe that, in terms of outdoor preferences, 65.37% of our sample prefers to spend time outdoors; 25.67% is neutral or had no particular preference between indoors and outdoors; while the remaining 8.96% prefers to be indoors. With respect to the level of awareness of need for mitigation strategies in Singapore, slightly more than half of our respondents (precisely 55.22%) are highly aware about the UHI impact; 38.66% presents neutral level of awareness; while the 6.12% declare to have
Table 2: Descriptive statistics of our sample. Demographics and Socio-economic variables.
Number of respondents Percentage of respondents (in %)
Gender Males: 325; Female 345 Males: 48.73; Females 51.27
Age distribution
20 to 29 142 21.29
30 to 39 227 34.03
40 to 49 200 29.99
50 to 59 76 11.39
60 and above 25 3.3
Gross Monthly income
< 2000 145 21.64
2000 - 4999 222 33.13
5000 - 9999 233 34.78
10,000 - 13,999 44 6.57
14,000 & above 26 3.88
Education
Primary & below 11 1.65
N/O levels 52 7.81
A levels/diploma 211 31.68
Bachelors 293 43.99
Postgraduate 99 14.86
Employment
Student 34 5.12
Employed 526 79.22
Self-Employed 56 8.43
Unemployed 48 7.23
Number of Children
0 322 48.28
1 199 29.84
2 117 17.54
3 or more 29 4.35
Marital Status
Single 226 34.14
Married 410 61.93
Divorced/Separated 26 3.93
Note: 4 participants preferred not to say their Education level; 6 their employment status, 8 their marital status and 3 the number of children in the household.
low level of awareness. Lastly, in terms of positive attitudes towards mitigation measures, 59.94% of our sample state that it is important to ensure that the government implement mitigation measures to make outdoor spaces thermally comfortable for outdoor activities; 35.58% declare to be neutral; while the 4.48% say to have low level of positive attitudes towards heat mitigation.
Figure 3: Descriptive statistics on the outdoor preferences, level of awareness of need for UHI mitigation and positive attitudes towards UHI mitigation of the sample.
4.2 WTP estimation results
We presented five mitigation measures to the participants (i.e. Covered sidewalks; Urban parks, shaded plazas, district cooling systems and electric vehicles) with short descriptions of each of them of their benefit in improving outdoor thermal comfort (see Appendix 1, survey questionnaire, Part 3.2. for details). After this, we elicited for the WTP for each of the five mitigation strategies. In this subsection, we want to assess the WTP estimation results for each mitigation and per site. We explore the WTP determinants for our entire sample, given that we did not find any significant differences between the WTP determinants between the sites. We used Equation (8) to do a log-likelihood estimation of the WTP with a set z of explanatory variables. Table 3 shows the estimation results.
In Table 3 Column 1 to Column 5, we display the estimation results of our models for each of the five mitigation strategies under evaluation in this study (i.e. covered sidewalks, shaded plazas, district cooling systems, urban parks and electric vehicles).
In the models, we include as ”explanatory” variables the “Bid” variable representing the value of the different bids, a set of socio-economic and demographic variables (i.e., gender, age and (declared) annual income, education, presence of children in the household, marital, and employment status) and the further addition of the “level of awareness of need for urban heat mitigation measures,” the “level of attitudes towards urban heat mitigation,” and the “outdoor preferences” as covariates. But before doing so, we tested for correlation across these characteristics to avoid any potential multicollinearity in our estimations. Our results suggested that there were no high correlations across the demographic, socio-economic and psychological variables inserted in the models of Column 1 to Column 5.
In all the models of Table 3 Column 1 to Column 5, the coefficients of the “Bid” are increasingly negative and statistically significant. This implies that the log-likelihood of saying a “YES” response decreases as the value of the bids increases, as expected. This is consistent for all the models of Table 3.
To capture the probability of positive responses with respect to age, we divided the sample into three age ranges: “20-30 years old” (our reference group), “31 to 50 years old” and “older than 55 years old”.
We observe that respondents older than 55 years tended to respond “YES” to the bid significantly less than respondents between 20 and 30 years old, and also than 31 to 55 years old. This suggests that the higher the age, the lower the likelihood of a “YES” response to the bid. This is consistent for all the mitigation strategies (i.e. Column 1 to Column 5).
The level of education of the respondents seems to play a significant role in eliciting positive responses to bids. The variable “Presence of Children” is a binary variable which takes the value “one” when the respondents have children living in their household and which is zero otherwise. We observe that the coefficient of the variable “Presence of Children” is positive and significant, which suggests that people with children were more likely to give a positive response to the bid than those without children. We also observe that “stated health” seem to be also a significant determinants of the positive response to bid. This could be because healthy people may spend more time outdoors and so, they would benefit more from the implementation of heat mitigation strategies. Interesting, the significant role of education, the presence of children in the household and stated health is consistent for all the mitigation measures (i.e. Column 1 to Column 5).
By looking at Table 3 Column 1 to Column 5, we further incorporated the “Level of awareness of the need for heat mitigation strategies,” the “Level of attitudes towards heat mitigation strategies” as well as the “Outdoor preferences” into our analysis. We tested for correlations across the variables before introducing them into the model to avoid any potential multicollinearity in our estimations. Correlation tests confirmed that there were no high correlations across the variables under evaluation.
In all the models from Table 3, we observe that the three coefficients for the “Level of awareness of the need for heat mitigation,” “Level of attitudes towards heat mitigation strategies” and “Outdoor preferences” are positive and significant in all the models (i.e. Column 1 to Column 5). This implies that the higher the level of awareness of the need for heat mitigation measures, the more positive the attitudes are towards mitigation measures and the higher the preference is for spending time outdoors, the higher the probability is of saying “YES” to the bids for all the mitigation strategies.
Interestingly, we observe that the “Income” of our respondents does not seem to be a determinant of the likelihood of a “YES” response. Furthermore, “gender” “marital status” and “employment situation”
do not seem to also affect the likelihood of a positive response in any of the mitigation strategies under evaluation (i.e. Column 1 to Column 5).
At the bottom of Table 3, we also display the results from the mean WTP estimations for each mitigation and per site. For a clearer comparison across the mean WTP estimated per mitigation strategy and per site, we display our results in Table 4. Table 4 shows in the upper part the mean estimated WTP per person, per year, per mitigation and site.
Overall, and following Table 4 (Column 3 to Column 7), it turns out that the estimated average annual WTP per Singaporean and Permanent Resident living in Punggol and per each measure, in ascending order, are: SGD$ 267.03 (95% CI [SGD$ 213.01; SGD$ 322.98]) for covered sidewalks; SGD$ 294.18 (95% CI [SGD$ 223.44; SGD$ 361.27]) for urban parks; SGD$ 333.86 (95% CI [SGD$ 278.26; SGD$
394.26]) for shaded plazas; SGD$ 334.21 (95% CI [SGD$ 268.5; SGD$ 399.26]) for district cooling systems; and SGD$ 390.75 (95% CI [SGD$ 322.73; SGD$ 462.75]) for electric vehicles. This means that people in Punggol are willing to pay more for technology (i.e. electric vehicles and district cooling) than for traditional mitigation strategies like those related with vegetation and shading (i.e. covered sidewalks, urban parks and shaded plazas).
Table 4: Annual mean WTP estimations per person. Total annual WTP values. Estimations performed per mitigation and per site.
Columns (1) (2) (3) (4) (5) (6) (7) (8)
ANNUAL MEAN WTP ESTIMATIONS PER PERSON (IN SGD$)
Number of Respondents
Mean annual income (from sample)
District Cooling
Electric
vehicles Shaded plazas Covered Sidewalks Urban parks TOTAL MEAN
Punggol 330 57,297
334.21
390.75
333.86
267.03
294.18
324.00
CBD (Central Area +
Bukit Merah) 340 65,505
388.18**
385.22
389.43*
283.32
328.98*
355.02*
AGGREGATED
MEAN 670 61,401
361.19
387.99
361.64
275.17
311.58
339.51
Columns (1) (2) (3) (4) (5) (6) (7) (8)
TOTAL ANNUAL MEAN WTP VALUE (IN MILLION SGD$)
Population over 20 years-old1
Mean annual income (from
sample)
District Cooling
Electric
vehicles Shaded plazas Covered Sidewalks Urban parks TOTAL MEAN
Punggol 120,040
57,297
40,118,000
46,905,000
40,076,000
32,053,000
35,313,000
38,893,000 CBD
(Central Area +
Bukit Merah) 180,050
65,506
69,891,000
69,358,000
70,116,000
51,011,000
59,232,000
63,922,000 AGGREGATED
TOTAL 300,090
110,009,000
116,264,000
110,192,000
83,065,000
94,545,000
102,815,000 Notes: Stars report significance level from Wilcoxon Mann–Whitney tests run on independent observations (sites) to confirm differences between CBD and the Punggol area (benchmark).
* 90% significance ** 95% significance *** 99% significance. 1 Estimations only considered Singaporeans and Permanent Residents over 20 years-old at the moment of the survey.
We also estimated average annual WTP per Singaporean and Permanent Resident living in the CBD area and per each measure, which in ascending order, are: SGD$ 283.32 for the implementation of covered sidewalks (95% CI [SGD$ 233.02; SGD$ 333.50]); SGD$ 328.98 (95% CI [SGD$ 259.01;
SGD$ 398.91]) for urban parks; SGD$ 388.18 (95% CI [SGD$ 312.66; SGD$ 463.12]) for district cooling systems; SGD$ 385.18 (95% CI [SGD$ 318.59; SGD$ 451.85]) for electric vehicles. SGD$ 389.43 (95% CI [SGD$ 322.60; SGD$ 456.09]) for shaded plazas. This means that, consistently with the Punggol population, people in CBD area are willing to pay more for new technology (i.e. electric vehicles and district cooling) than for widely implemented heat mitigation strategies like the ones related to vegetation. However, CBD respondents are willing to pay the most for shaded plazas.
Wilcoxon Mann–Whitney tests were performed to test for differences between the mean annual WTP estimations per mitigation and per site. The mean annual WTP estimated per person for the implementation of the District Cooling is significantly higher in CDB area than in the Punggol area (p=0.0465). This is also the case for shaded plazas (p=0.0523) and urban parks (p=0.0519). No differences are found between the mean annual WTP per person for the implementation of electric vehicles and covered sidewalks between the two sites.
The bottom part of Table 4 Column 3 to Column 7, shows the annual WTP value per mitigation and per site as well as the aggregated total WTP values. According to the official data, the number of Singaporeans and Permanent Residents over 20 years old amounts to 120,040 in Punggol and 180,050 in the CBD at the survey time (see Column 1, bottom part of Table 4). We observe in Table 4 Column 8 that, by expanding the mean annual WTP value to the population of Punggol, Singaporeans and Permanent Residents of the Punggol area are willing to pay in mean SGD$ 38.893 million for promoting the implementation of the five mitigation measures under evaluation. The corresponding 95% WTP interval is SGD$ 25.788 million lower limit and SGD$ 52.456 million upper limit.
In the same fashion, and by expanding the mean annual WTP value to the population of the CDB area, Singaporeans and Permanent Residents are willing to pay in mean SGD$ 63.922 million for the promotion of the five mitigation strategies evaluated in this study. The corresponding 95% WTP interval is SGD$ 45.897 million lower limit and SGD$ 84.653 million upper limit.
This means that the mean annual WTP value for both Punggol and CBD sites gives a total of SGD$
102,815 million (95%CI [SGD$89.419m;SGD$125.825m]) for the implementation of the shaded plazas, district cooling systems, covered sidewalks, urban parks and electric vehicles in Singapore.
4.3 Ranking of implementation preference
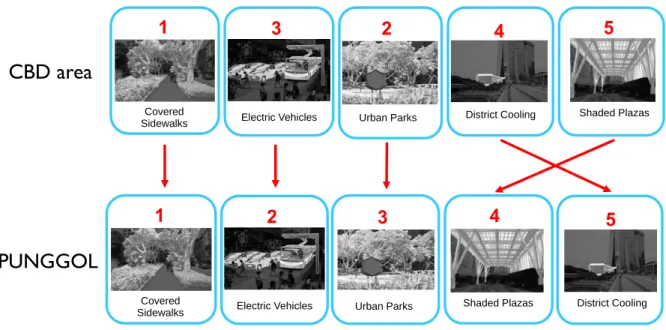
In this sub-section, we want to explore the implementation preference of the five mitigation strategies evaluated in this study from our respondents. After the elicitation of the WTP per each mitigation strategy, we asked participants to rank the measures according to their implementation preference.
We explore the ranking of preferences per site (i.e. CBD area and Punggol) to study whether there are differences in people’s implementation preferences in residential (i.e. Punggol) vs commercial (i.e.
CBD) areas of Singapore.
Figure 4. Rankings of implementation preference of the five mitigation strategies for Punggol and CBD area.
Figure 4 displays the people’s ranking of preference for the five mitigation strategies per site. We observe that overall, there are no significant differences between the two rankings. The three most preferred out of the five mitigations are the same in both sites suggesting the preference for covered sidewalks, urban parks and electric vehicles improve outdoor thermal comfort in both commercial and residential areas. This shows the strong preference of Singaporeans and Permanent Residents for vegetation as a way to improve outdoor thermal comfort as well as the level of acceptance for the implementation of new technologies like electric vehicles. District cooling is showed to be more preferred by Singaporean living in commercial areas than shaded plazas. This is contrary to citizens in Punggol who prefer the implementation of shaded plazas than the introduction of district cooling technology.
Which strategy would you like see implemented first in Singapore?Which strategy would you like see implemented the most in your area?
3
Electric Vehicles
4
District Cooling
2
Urban Parks
1
Covered Sidewalks
5
Shaded Plazas
2
Electric Vehicles
5
District Cooling
3
Urban Parks
1
Covered Sidewalks
4
Shaded Plazas
PUNGGOL
CBD area
Figure 5 depicts the overall ranking preference of the measures to mitigate urban heat in Singapore for our aggregated population sample (i.e. both Punggol and the CDB area). Among the five strategies evaluated, covered sidewalks are the most preferred mitigation strategy among the respondents. Urban parks and electric vehicles are ranked second and third, respectively. Shaded plazas are in the fourth place while the use of district cooling technology in improving the outdoor thermal comfort of pedestrians is the least preferred. Overall, we confirm that there is a strong preference for the implementation of strategies related to vegetation (covered sidewalks and urban parks) to improve outdoor thermal comfort and for the introduction of electric vehicles, as these three mitigation strategies were ranked in the top three positions by our participants.
Figure 5. Ranking of preference of the 5 mitigation strategies of our aggregated sample (first line) and stated implementation preference between two possible options of each mitigation strategy.
Following the assessment of the preference for the five mitigation strategies, respondents were provided with two contrasting mitigation options per strategy. They were required to indicate their preference between one of the two options per mitigation strategy examined (see Figure 5).
Respondents were presented with two choices on the category of covered sidewalks to be implemented in their area. Following Figure 5, 55% of the respondents are more inclined towards covered sidewalks with vegetations, while the rest 45% of the respondents voted for the covered sidewalks through canopy.
Large and small-scale urban parks were two selections posed to respondents within the category of urban parks as a mitigation strategy. The 57% indicate their preference towards the implementation of large-scale urban parks in their neighbourhoods, while 43% exhibit a preference for small-scale urban
Which strategy would you like see implemented first in Singapore?Which strategy would you like see implemented the most in your area?
3
Electric Vehicles
Electric Buses
Electric buses and Cars 30%
70%
5
District Cooling
Split Units Aircon
District Cooling Plants 35%
65%
2
Urban Parks
Small-scale Urban Parks
Large-scale Urban Parks 57%
43%
1
Covered Sidewalks
Covered Sidewalk through Canopy
Covered Sidewalk through Vegetation
45%
55%
4
Shaded Plazas
Shaded Plazas under Canopy
Shaded Plazas under Building
38%
62%
parks. In examining the use of electric vehicles, 70% of respondents have a stronger inclination towards the electrification of buses and cars, while the rest 30% prefer the electrification only of the buses.
As shaded plazas are examined, 62% of the participants prefer shaded plazas under buildings, while the rest 38% of the sample indicated their implementation preference for shaded plazas under the canopy. Lastly, split air-conditioning units were compared against district cooling plants from the technology domain. 65% of the respondents prefer for the use of district cooling plants, juxtaposed to 35% who voted for split air-conditioning units.
5 Conclusions
5.1 Summary of findings
In this study with a representative sample of 670 Singapore Citizens and Permanent Residents (330 in Punggol and 340 in the CBD area), we sought to assess and understand the preference towards five urban heat mitigation strategies (i.e. covered sidewalks; urban parks, electric vehicles; shaded plazas and district cooling) in the Punggol and CBD areas as well as their willingness to pay for those measures. We also explored the determinants of their WTP and estimated the total WTP value for Punggol and CBD area.
Singaporeans and Permanent Residents living in Punggol and CBD area have a strong preference for the implementation of mitigation measures related to vegetation (i.e. covered sidewalks and urban parks), as well as a high level of preference for the introduction of technology-related mitigation strategies like electric vehicles to improve their outdoor thermal comfort. We find a lower preference for district cooling and shaded plazas. While district cooling is more preferred by those living in commercial areas (i.e. CBD), compared to shaded plazas, the opposite is observed for those in living in Punggol.
Besides, our findings indicate that people support all five proposed mitigation strategies. While it might be expected that the mean annual WTP for each mitigation strategy would vary according to the implementation preferences, our findings show that this is not the case.
Our results suggest that people in Punggol are willing to pay the highest amount for electric vehicles, followed by shaded plazas, district cooling systems, urban parks and lastly for covered sidewalks. In the CBD area instead, people are willing to pay the highest amount for shaded plazas, district cooling and electric vehicles followed by urban parks and covered sidewalks. Interestingly, shaded plazas as well as technology-related strategies (i.e. electric vehicles and district cooling systems) presents the highest mean annual WTP per person in both sites, being electric vehicles the mitigation with the highest total mean WTP for the respondents in both locations. These results suggest that Singaporeans and Permanent Residents, even though they prefer vegetation as a main way to improve outdoor
thermal comfort, seem to strongly accept and support the implementation of new ways to mitigate urban heat. These mitigations are related to urban planning (shaded plazas) and new technologies like electric vehicles and district cooling.
Expanding the mean annual WTP value to the population of Punggol, Singaporeans and Permanent Residents living in Punggol are willing to pay in mean SGD$ 38.893 million for promoting the implementation of the five mitigation measures under evaluation. The corresponding 95% WTP interval is SGD$ 25.788 million lower limit and SGD$ 52.456 million upper limit.
In the CDB area, Singaporeans and Permanent Residents are willing to pay in mean SGD$63.922 million for the promotion of the five mitigation strategies. The corresponding 95% WTP interval is SGD$
45.897 million lower limit and SGD$ 84.653 upper limit.
This means that the annual WTP value for both Punggol and CBD sites gives a total of SGD$102.815 million (95% CI [SGD$ 89.419 million; SGD$ 125.825 million]) for the implementation of the shaded plazas, district cooling systems, covered sidewalks, urban parks and electric vehicles.
Investigations into demographic, socio-economic, and psychological predictors showed that the WTP differs across population groups, independently of the site in which they live. Citizens who are younger, healthy, better educated and live together with children report higher WTP values. These results are not surprising and are in line with the findings reported for Singapore in Borzino et al. (2020). In the same line, Carlsson et al. (2010) and Zsóka et al. (2013) also found that childless individuals are less willing to pay for environmental goods than parents. Besides, other studies performed in the US (e.g., Krupnick, 2007; Kotchen, 2013) suggest that since seniors are less likely to live in the more distant future than younger people, they are less likely to profit from the implementation of environmental programs and are therefore willing to pay less than younger people for a given future risk reduction.
Furthermore, we find that citizens who reported a higher level of awareness of the need for heat mitigation measures, hold positive attitudes towards heat mitigation and prefer outdoor settings in general report higher WTP values. This is also in line with the results reported in Borzino et al. (2020).
To better protect older people as one of the most vulnerable groups from negative effects and heat exposure, education might be useful to increase the level of awareness and as a consequence, the overall WTP for heat mitigation.
5.2 Recommendations and next steps
Based on the results provided in this study, we give some recommendations for policymakers in Singapore and in cities facing similar challenges with UHI, and we point out some necessities for further research: