Applying Voting Methods in User Research
Julia Sageder University of Regensburg
Germany
julia.sageder@stud.uni-regensburg.de
Ariane Demleitner University of Regensburg
Germany
ariane.demleitner@stud.uni-regensburg.de Oliver Irlbacher
University of Regensburg Germany
oliver.irlbacher@stud.uni-regensburg.de
Raphael Wimmer University of Regensburg
Germany raphael.wimmer@ur.de ABSTRACT
In usability practice, it is often necessary to find a ‘best’ so- lution that is most suitable for most users. A common way to do this is to present multiple alternatives to a group of users and let them express their preferences. However, in- tegrating many subjective ratings into one generally valid rating is non-trivial. For such data, voting methods from the field of computational social choice might prove useful. In or- der to investigate their suitability, we conducted an exper- iment where participants had to complete a pointing task using four different mouse acceleration values and rank the perceived performance of each option via Likert-type items and also by ranking them. For generating an overall ranking, we calculated arithmetic mean and median as well as Borda count and Schulze method for each of the response sets. All methods resulted in nearly the same overall ranking of op- tions which suggests that they might be equally useful for generating consensus on a ‘best’ option.
CCS CONCEPTS
• Human-centered computing → Human computer inter- action (HCI); Usability testing; HCI theory, concepts and models.
KEYWORDS
Likert scales, Likert-type items, ranking, Condorcet voting, Borda count, Schulze method, voting methods
Permission to make digital or hard copies of all or part of this work for personal or classroom use is granted without fee provided that copies are not made or distributed for profit or commercial advantage and that copies bear this notice and the full citation on the first page. Copyrights for com- ponents of this work owned by others than the author(s) must be honored.
Abstracting with credit is permitted. To copy otherwise, or republish, to post on servers or to redistribute to lists, requires prior specific permission and/or a fee. Request permissions from permissions@acm.org.
MuC ’19, September 8–11, 2019, Hamburg, Germany
© 2019 Copyright held by the owner/author(s). Publication rights licensed to ACM.
ACM ISBN 978-1-4503-7198-8/19/09…$15.00 https://doi.org/10.1145/3340764.3344461
ACM Reference Format:
Julia Sageder, Ariane Demleitner, Oliver Irlbacher, and Raphael Wimmer. 2019. Applying Voting Methods in User Research.
In Mensch und Computer 2019 (MuC ’19), September 8–11, 2019, Hamburg,Germany. ACM, New York, NY, USA, 5 pages.
https://doi.org/10.1145/3340764.3344461
1 INTRODUCTION
Improving the usability of systems requires trade-offs to be
made. Oftentimes, there is no single solution that works best
for all users. However, designers or developers usually have
to choose at least a default option. Sometimes only a single
option can be implemented at all, that may not or cannot
be changed due to technical constraints (e.g., the form fac-
tor of a device). Therefore, it may be necessary to find an
option that works as well as possible for as many users as
possible. In some cases, finding such an optimal solution is
just a matter of collecting objective performance measures
from many users and selecting the option which has the
best median or mean value. However, if there is no objec-
tive metric that can be used to compare the options, one
needs to aggregate many subjective preferences in order to
find a single favorite option. For example, in order to find
the optimal size of a mobile phone, one might create a few
differently sized low-fidelity prototypes, hand them out to
users, and ask them to choose which they like the most. Un-
fortunately, in many cases, there is no single option that
everyone prefers. One common approach for recording and
quantifying subjective attitudes, behaviors, and judgments
is to use Likert scales (interval-scaled) or Likert-type items
(ordinal-scaled) [7]. Such scales may also be used for measur-
ing a user’s preference for each option. Individual responses
on these scales are commonly aggregated by assigning an
order or value to the items and then calculating a median or
mean value for each option. However, many scientists criti-
cize how Likert scales and Likert-type items are analyzed in
practice [2,7,10,11], warning that “researchers typically use
the wrong statistical techniques to analyze them” [11]. An al-
ternative and potentially more robust approach to extract
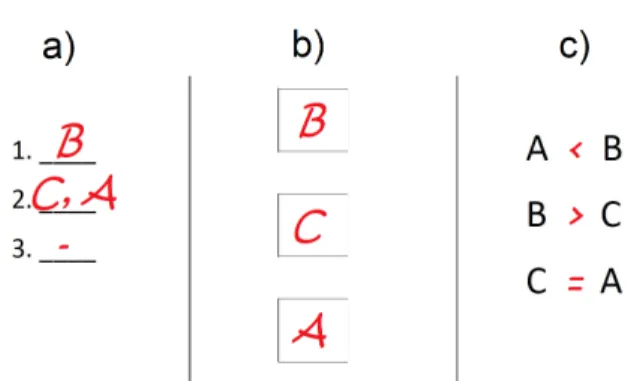
Figure 1: Likert-type items: a) only two labels for the extreme options, b) individual label for each option, c) ordinal-scaled op- tions.
a consensus
1from many individual preferences are voting methods. These are subject of research in other scientific fields, such as computational social choice [4,6,15] but rarely used in human-computer interaction research.
In this paper we investigate reliability and validity of both general methods. Our contributions are an overview of prop- erties of Likert scales, Likert-type items and voting methods in regard to user research, as well as results from a compar- ison study. These show that both approaches result in simi- lar rankings which are partially consistent with an objective performance measure.
2 METHODS FOR DETERMINING USER PREFERENCE
2.1 Likert Scales and Likert-Type Items
2.1.1 Definition and Presentation: “Likert scales” are a sta- ple of questionnaire design. However, the term is not used consistently in the literature. Likert scales combine the re- sults of multiple Likert-type items into an overall score [2].
The term Likert-type items describes a set of multiple check- boxes in a row from which a respondent has to select exactly one [2]. The most commonly used formulation is a variation of Likert’s original response set “strongly approve, approve, undecided, disapprove, and strongly disapprove” [8], where
‘approve’ has been replaced with ‘agree’ [2,10]. According to Boone and Boone [2], Clason and Dormody [3] describe Likert-type items as “single questions that use some aspect of the original Likert response alternatives”. While a ques- tionnaire may contain multiple such questions, “there is no attempt by the researcher to combine the responses from the items into a composite scale” [3]. Figure 1 shows two 5-point Likert-type items, a) and b). Figure 1c does not show a typ- ical Likert-type item as a Likert response usually describes agreement. Likert-type items with an odd number of options
1
here, consensus means a decision that is most preferred by the whole group of users.
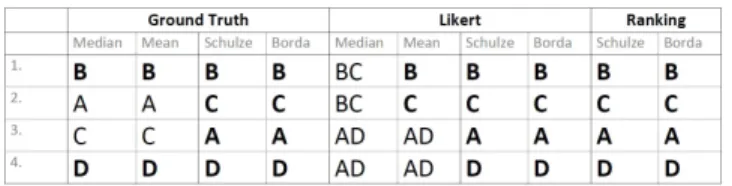
Figure 2: Typical methods for ranking different options include a) forms, b) physical or virtual cards that can be arranged in a specific order, or c) textual descriptions of preferences. Methods may allow for specifying that two options are equal (a, c).
allow for a neutral statement (Figure 1b); with an even num- ber of options the respondent has to decide whether they tend to agree or disagree. According to Menold and Bogner, multiple studies show that an acquiescence bias is encour- aged with Likert-type items and Likert scales [10]. Aquies- cence is the tendency of people to agree. This bias occurs in relation to agree/disagree scales, which includes Likert re- sponses [1,10]. In general, Likert-type items contain ordinal- scaled options and not interval-scaled ones, i.e. there is a
‘greater than’ relationship between them but the distance between the values of individual options is not necessarily the same [2].
2.1.2 Interpretation: Boone and Boone suggest analysis methods based on Stevens’ Scales of Measurement [13] - ordinal-scale for Likert-type items and interval-scale for Likert scales [2]. The scales shown in Figures 1a and 1b may only be interpreted as interval-scale data if one ensures that the values of all options are equally-spaced. Likert-type items (e.g., as in the scale shown in Figure 1c) usually only contain ordinal-scale data. As the arithmetic mean should not be calculated for ordinal scales, some researchers prefer to plot comparative visualizations of Likert-type items, such as produced by likertplot.com [9]. However, it is possible to interpret the scores from ordinal-scaled Likert-type items as rankings (an option with a score of ‘approve’ is ranked better than an option with a score of ‘neutral’) and use voting methods to find a common preference.
2.2 Ranking
2.2.1 Presentation: In order to rank different options, they
are presented to the user who applies a certain ordering
to them. The options may be either presented all at once
or pairwise. Figure 2 shows three possible presentation
types of ranking methods. One may allow to assign the
same rank to two or more options (Figure 2.2a/c). Pairwise ranking (Figure 2c) might entail limited clarity about all options. It also may exponentially increase the amount of time required the more options have to be ranked.
However, Fogel et al. found, “that […] preferences are easier to express in relative terms (e.g. a is better than b) rather than absolute ones (e.g. a should be ranked fourth, and b seventh)” [5]. Furthermore, pairwise ranking allows for comparing options that are difficult to present at the same time. For example, Wimmer et al. [14] asked study participants to rank 18 different form factors of an interactive desk with regard to their ergonomics. As it would have been very hard for participants to first try out all variants and rank them afterwards, participants only had to compare the ergonomics of the current form factor to those of the previous one. From these pairwise rankings, an overall ranking was constructed in order to find the most preferred form factor.
2.2.2 Interpretation: A simple way to generate a overall ranking out of a multiple number of rankings is the Borda count, developed by Jean-Charles de Borda in 1770 [4,6].
Here the options get assigned points depending on their ranking position in each of the voters’ rankings [4,6] - e.g., 10 points for the first-ranked option, 9 points for the second-ranked one, and so on. An alternative approach was postulated by Marquis de Condorcet in 1785: the preferred option is the option that wins over all other options in paired comparisons [4,6]. The Condorcet method is consensus-based, i.e. the winner does not necessarily have to be ranked first by a majority of voters [6]. One of the most widely used Condorcet implementations is the Schulze method [12]. As Schulze mentions, it was used
“by more than 60 organizations [ e.g. ACM, IEEE, USENIX and MTV] […]. Therefore, the proposed method is more wide- spread than all other Condorcet-consistent single-winner election methods combined” as of October 2018 [12]. The Schulze method is implemented in multiple libraries and online voting sites, such as condorcet.vote.
2.3 Summary
We presented two alternatives for collecting user’s prefer- ences - Likert-type items and ranking of options - each with unique advantages and limitations. Likert-type items are widely used in HCI practice, whereas ranking of options is mostly confined to the social sciences. While the Likert- type items allow for expressing an absolute rating for each individual option, ranking only allows for expressing rela- tive preferences between multiple options. Ranking options allows for more flexibility in study designs, however. For example, an overall ranking may also be constructed from multiple pairwise comparisons.
An overall preference may be extracted both from ranked options and responses on Likert-type items by using voting methods, such as the Schulze method. Whereas one might also apply common descriptive statistics (e.g., arithmetic mean) to responses on Likert-type items, multiple authors vehemently oppose this practice. As argued by Kaptein et al. and Robertson, Likert scales or rather Likert-type items are often analyzed incorrectly [7,11].
Given the aforementioned properties, ranking of options and voting methods may useful for HCI researchers under certain circumstances. In order to find out how much the choice of presentation method and analysis method affects which option is chosen as an overall preference, we conducted a small study comparing the results of these approaches.
3 STUDY
In order to determine how well the aforementioned ap- proaches allow for representing overall user preferences, we conducted a within-subject study comparing the results of various combinations of presentations and analysis methods to an objective ground truth.
4 STUDY SETUP
For the study, we asked 24 participants (10 female, 14 male, age 20-59, mean age 29.9) to perform a web-based Fitts’ Law pointing test using a mouse.
2As independent variable, we choose mouse tracking speed (control-display gain) with four velocities (A: 0.5, B: 0.875, C: 1.5, D: 3.0) which were changed during the experiment using the macOS console.
Control variables were technical setup, starting point, radius and distance of the target. Dependent variables were task completion times (objective ground truth) and the evaluation by Likert-type items and ranking of options (subjective preference).
During the test procedure, participants first had a training phase with one of their mouse speeds (able to hit 30 targets maximum), followed by the test with the current mouse speed which involved hitting 10 targets. This procedure had to be iterated for all four mouse speeds in the counter- balanced order of each participant. Each of the participants completed the tasks in one of the 4! = 24 possible orders.
The assignments of the mouse speeds to the shortcuts was counter-balanced, individually adjusted and unknown to the participants. For each participant and each of the four velocities, the average task completion time was measured and used as an objective ground truth, i.e., we assumed that the velocity which resulted in the lowest task completion time was also the objectively best choice for the participant.
2
https://github.com/denisrpriebe/Fitts-Law
Figure 3: Comparison of ground truth (best performance) and re- sults obtained via rating and ranking methods. All applied meth- ods result in the same top and bottom preferences. For some methods, the responses resulted in ties between two options.
After the test, participants were asked to indicate how rapidly they thought they were able to hit the target with each of the four tracking speeds. Participants had to rate each tracking speed on a 5-point Likert-type item and arrange paper strips with A-D in the preferred ranking order. On the Likert-type item, participants had indicate their level of agreement with the statement “Using tracking speed A/B/C/D I have quickly hit the target in this test.” We used a five-point scale where the choices were labeled
“agree - slightly agree - neither agree nor disagree - slightly disagree - disagree” from top to bottom. When ranking using the paper strips, participants were not allowed to assign the same rank to two tracking speeds. Presentation of both approaches was counter-balanced, i.e. one half of participants started with the Likert-type item, the other half with the ranking. During rating and ranking, partici- pants were allowed to change mouse speeds via keyboard shortcuts to compare them again if necessary.
4.1 Data Analysis
From the ground truth measurements, four rankings were derived: median, mean, Schulze ranking, and Borda ranking.
For mean and median ranking, the task completion times of all participants were first grouped per speed condition and mean/median task completion time were calculated for each of the tracking speeds. For determining Schulze and Borda ranking, the task completion times per speed condition were averaged for each user, and ranked in order from lowest to highest. From these 24 per-person rankings, an overall rank- ing was calculated using the online service condorcet.vote.
3From the responses on the Likert-type items, the same four rankings were derived: median, mean, Schulze ranking, and Borda ranking. For calculating median and mean ranking, each of the responses was assigned a value between 1 and 5. In order to determine Schulze and Borda ranking, for each participant a ranking of tracking speeds was derived from their responses. In these rankings, two tracking speeds could have the same rank when multiple tracking speeds had the same responses on the Likert-type items.
3