Tax-Transfer Systems in Europe:
Between Efficiency, Redistribution and Stabilization
Inauguraldissertation zur
Erlangung des Doktorgrades der
Wirtschafts- und Sozialwissenschaftlichen Fakult¨ at der
Universit¨ at zu K¨ oln
2013 vorgelegt
von
Dipl.-Volksw. Dirk Neumann
aus Bergisch Gladbach (Nordrhein-Westfalen)
Referent: Prof. Dr. Clemens Fuest Korreferent: Prof. Dr. Felix Bierbrauer Tag der Promotion: 30. Juli 2013
Acknowledgements
This thesis contains work that I started as a doctoral fellow at the Cologne Grad- uate School in Management, Economics and Social Sciences (CGS), University of Cologne, and that I continued as a Resident Research Affiliate at the Institute for the Study of Labor (IZA). I am grateful for the scholarship that I received from CGS, granted by the German federal state North Rhine-Westphalia. I thank all my colleagues at CGS and IZA for many interesting discussions and the support- ive and friendly working environment at both places. I am grateful to Clemens Fuest for the supervision of my thesis even though he left Cologne and became Research Director at the Oxford University Centre for Business Taxation in 2008.
I very much appreciated to work with him on the essay presented in Chapter 5 of this thesis. I also thank Felix Bierbrauer, Professor for Public Economics at the University of Cologne since 2011, who kindly agreed to co-supervise my thesis. I am very much indebted to Andreas Peichl for his constant support and motivation throughout my time as a doctoral student as well as for the inspiring and friendly collaboration on several joint projects. Special thanks go to my colleagues and coauthors Olivier Bargain, Mathias Dolls, Nico Pestel and Sebastian Siegloch with whom I worked on several projects, too, which was always a great pleasure. I am also indepted to Andr´e Decoster who invited me to the Center for Economic Studies, Katholieke Universiteit Leuven from December 2010 until May 2011 to work together on the essay presented in Chapter 3 of this thesis. I enjoyed my stay there a lot and appreciate the ongoing exchange since then. Not least, I would like to thank Fran¸cois Maniquet for his trust and support while giving me the oppor- tunity to finish my thesis at the Center for Operations Research and Econometrics (CORE) at the Universit´e catholique de Louvain (UCL), after having started a new position there. Finally, I am grateful to my family and friends for their sup- port, encouragement and understanding.
Cologne, July 2013
i
Contents
List of Figures iv
List of Tables vi
1 Introduction 1
1.1 Motivation and key questions . . . 1
1.2 Methodology: counterfactual simulations and labor supply estimation 6 1.3 Summary of results . . . 8
2 Tax-benefit revealed social preferences 11 2.1 Introduction . . . 11
2.2 Related literature . . . 13
2.3 Optimal tax model and its inversion . . . 16
2.4 Empirical implementation . . . 19
2.5 Labor supply estimation . . . 21
2.5.1 Empirical model . . . 21
2.5.2 Labor supply elasticities . . . 23
2.6 Revealed social inequality aversion . . . 26
2.6.1 Baseline results . . . 26
2.6.2 Sensitivity analyses . . . 30
2.7 Conclusion . . . 32
2.8 Appendix . . . 33
2.8.1 Descriptive statistics . . . 33
2.8.2 Standard and Saez elasticities . . . 36
CONTENTS ii 3 Welfare, labor supply and heterogeneous preferences 40
3.1 Introduction . . . 40
3.2 Related literature . . . 42
3.3 Theoretical framework . . . 45
3.4 Empirical approach . . . 51
3.5 Results . . . 58
3.5.1 Estimated preference heterogeneity . . . 58
3.5.2 Cross-country welfare rankings . . . 59
3.5.3 Assessing the differences in welfare rankings . . . 67
3.5.4 Robustness checks . . . 69
3.6 Concluding discussion . . . 71
3.7 Appendix . . . 73
4 Equality of opportunity and redistribution 79 4.1 Introduction . . . 79
4.2 Methodology . . . 82
4.2.1 Conceptual framework . . . 82
4.2.2 The GO index . . . 84
4.2.3 Parametric estimation . . . 85
4.3 Empirical strategy . . . 87
4.3.1 The EU-SILC . . . 87
4.3.2 Income concepts . . . 89
4.3.3 Individual circumstances . . . 91
4.4 Empirical analysis . . . 92
4.4.1 Inequality of opportunity in Europe . . . 92
4.4.2 EOp and redistribution . . . 95
4.5 Discussion of results . . . 101
4.6 Conclusion . . . 105
5 Economic effects of a European tax-benefit system and fiscal equal- ization mechanism 108 5.1 Introduction . . . 108
5.2 Related literature and conceptual framework . . . 113
iii CONTENTS
5.2.1 Related literature . . . 113
5.2.2 What is a ‘fiscal union’ ? Simulation scenarios . . . 115
5.2.3 Conceptual framework . . . 118
5.3 Empirical strategy . . . 122
5.3.1 EUROMOD: model and database . . . 122
5.3.2 Tax-benefit scenarios . . . 124
5.3.3 Descriptive information . . . 128
5.4 Economic effects of a European tax-transfer system . . . 130
5.4.1 Changes in disposable income and labor supply . . . 131
5.4.2 Effects on welfare and inequality . . . 134
5.4.3 Political feasibility . . . 137
5.4.4 Automatic fiscal stabilization . . . 139
5.5 Economic effects of a European fiscal equalization mechanism . . . 143
5.6 Discussion . . . 147
5.7 Conclusion . . . 149
5.8 Appendix . . . 151
5.8.1 Descriptive data . . . 151
5.8.2 Income changes without behavioral adjustments . . . 153
5.8.3 Behavioral adjustment . . . 153
6 Benefiting from a European fiscal union? Redistribution vs. sta- bilization 159 6.1 Introduction . . . 159
6.2 Related literature . . . 162
6.3 Methodology . . . 165
6.3.1 Concept of a ‘fiscal union’ . . . 165
6.3.2 The value of moving to a ‘fiscal union’ . . . 167
6.3.3 Decomposition . . . 169
6.4 Data and empirical implementation . . . 172
6.4.1 EU-SILC and EUROMOD . . . 172
6.4.2 Tax-transfer integration . . . 174
6.4.3 Descriptive information . . . 176
6.5 Results . . . 178
CONTENTS iv
6.5.1 Baseline results: EU27 . . . 178
6.5.2 Results for the euro area . . . 182
6.5.3 Sensitivity analyses . . . 183
6.6 Concluding discussion . . . 185
6.7 Tables and figures . . . 188
6.8 Appendix . . . 200
7 Concluding remarks 211
Bibliography 214
Curriculum vitae 236
v
List of Figures
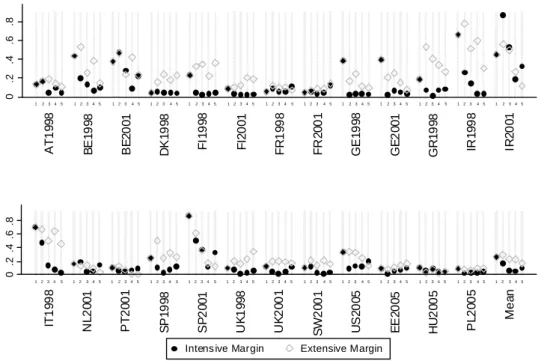
2.1 Saez’ elasticities at the extensive/intensive margins . . . 23
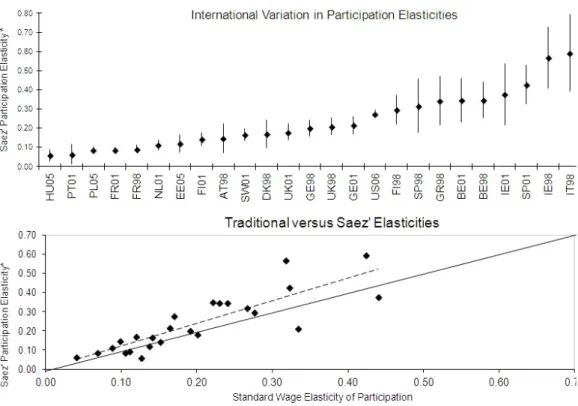
2.2 Extensive margin elasticities: comparisons . . . 25
2.3 Tax-benefit revealed social inequality aversion γ . . . 29
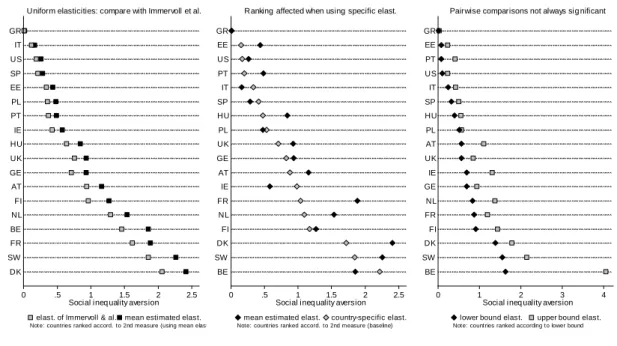
2.4 Revealed social inequality aversion: sensitivity checks . . . 31
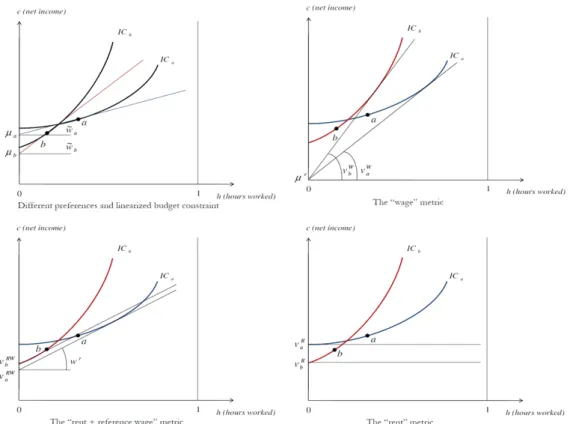
3.1 The different welfare metrics graphically . . . 47
3.2 Rank correlations of empirical welfare metrics using reference pref- erences vs. full heterogeneity in preferences . . . 61
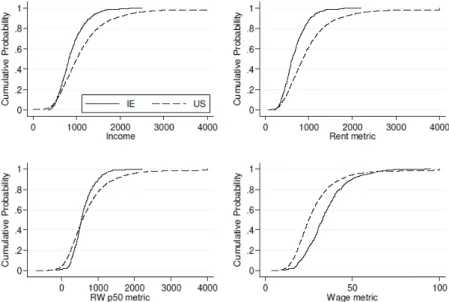
3.3 Cumulative distribution functions (CDF) by metrics for 2 selected countries . . . 62
3.4 MRS for Box-Cox vs. quadratic specification of the utility function 73 3.5 Average percentile positions by countries for different methods of metrics computation . . . 74
3.6 Average percentile positions when preference heterogeneity due to estimated preference parameters only - by different reference house- holds . . . 77
3.7 Average percentile positions when preference heterogeneity due to sociodemographics only - by different reference households . . . 78
4.1 Robustness of country rankings with respect to methods . . . 93
4.2 Reduction in IOp and IO through taxes . . . 99
4.3 Reduction in IOp and IO through social benefits . . . 100
4.4 Reduction in IOp and IO through taxes and social benefits . . . 102
4.5 Changes in EOp country rankings for different income concepts . . 103
4.6 IOp and labor productivity per worker . . . 105
LIST OF FIGURES vi 5.1 National tax-benefit schemes compared to EU average systems (based
on country means for gross income deciles; weekly thousand 2001 EUR) . . . 127 5.2 Composition of 100 Euros disposable income by country . . . 130 5.3 Share of winners in country gross income quintiles by scenario . . . 136 6.1 Equivalent variations across income deciles when moving to an EU27
average tax system . . . 193 6.2 Equivalent variations across income deciles when moving to an EU27
average tax system (ctd.) . . . 194 6.3 Equivalent variations across income deciles when moving to an EU27
average tax system: stabilization value . . . 195 6.4 Equivalent variations across income deciles when moving to an EU27
average tax system: stabilization value (ctd.) . . . 196 6.5 Equivalent variations across income deciles when moving to an EA17
average tax system . . . 197 6.6 Equivalent variations across income deciles when moving to an EA12
average tax system . . . 198 6.7 Equivalent variations across income deciles when moving to a “North”
and a “South” EA average tax system . . . 199 6.8 Plots for estimated net tax function: national vs. EU27 average . . 201 6.9 Plots for estimated net tax function: national vs. EU27 average (ctd.)202
vii
List of Tables
2.1 Marginal social welfare weights gi . . . 27
2.2 Description of the discretized population of childless singles . . . 34
2.3 Description of the discretized population of childless singles (ctd.) . 35 2.4 Labor supply elasticities . . . 38
2.5 Labor supply elasticities (ctd.) . . . 39
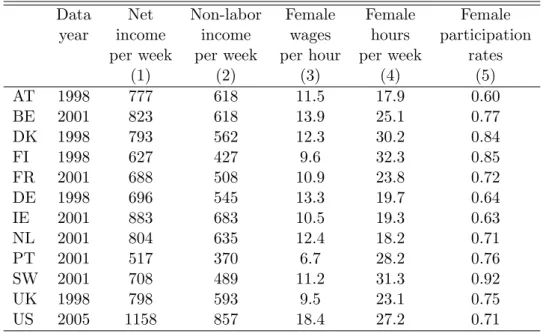
3.1 Income and employment statistics . . . 57
3.2 Marginal rates of substitution (between consumption and labor) by countries . . . 60
3.3 Average percentile position of households in the global welfare rank- ing - by country and metrics . . . 63
3.4 Average percentile position of the income poor (lowest quintile) in the global welfare ranking - by country and metrics . . . 65
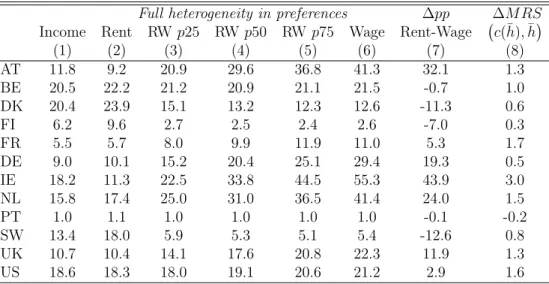
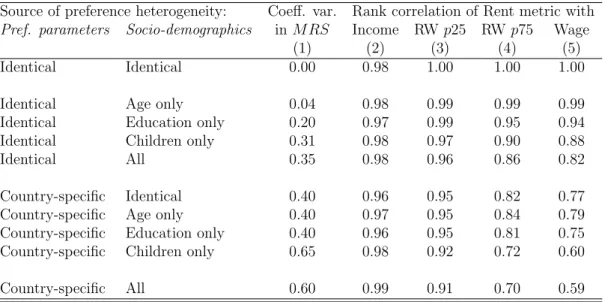
3.5 Variation in MRS and correlation between metrics by different sources of preference heterogeneity . . . 68
3.6 Average percentile positions for different sources of preference het- erogeneity . . . 75
3.7 Marginal rates of substitution (between consumption and labor) by subgroups . . . 76
3.8 Descriptive statistics for reference households in decomposition anal- ysis . . . 76
4.1 Income definitions . . . 90
4.2 IO and IOp indices for equivalized factor income . . . 95
4.3 IOp indices for different income concepts . . . 98
LIST OF TABLES viii
5.1 Average weekly household income and taxes (2001 EUR) . . . 128
5.2 Gains and losses in disposable income . . . 133
5.3 Inequality and social welfare . . . 135
5.4 Political feasibility of reform scenarios using different voting rules . 139 5.5 Income stabilization coefficients (for 5% gross income shock) . . . . 141
5.6 5% asymmetric shock to ’GIIPS’ countries with fiscal equalization mechanism . . . 144
5.7 2008-09 shock to all countries with fiscal equalization mechanism . . 147
5.8 Main taxes captured by EUROMOD as % of total taxation in 2001 151 5.9 Data sources used by EUROMOD . . . 152
5.10 Cross-country heterogeneity in main characteristics for tax func- tions . . . 152
5.11 Gains and losses in disposable income - for baseline labor supply . . 153
5.12 Estimated labor supply elasticities by subgroups . . . 156
5.13 Hours worked and (changes in) fulltime equivalents . . . 157
5.14 Labour supply effects by subgroups . . . 158
6.1 Individual average monthly income and taxes (2007 EUR) . . . 188
6.2 Equivalent variations of median voters for EU27 . . . 189
6.3 Equivalent variations of median voters for different euro areas . . . 190
6.4 Equivalent variations of median voters for varying parameter as- sumptions . . . 191
6.5 Equivalent variations of median voters for 35% income shock . . . . 192
6.6 Inequality and effective progression: national vs. EU average system 203 6.7 Income stabilization coefficients and AETRs . . . 204
6.8 Validation of estimated net tax functions . . . 205
6.9 Validation of estimated net tax functions (ctd.) . . . 206
6.10 Main estimation output for European average tax functions . . . 207
1
Chapter 1 Introduction
1.1 Motivation and key questions
According to Musgrave (1959), the three main objectives of state tax-transfer sys- tems are an efficient resource allocation, income redistribution and macroeconomic stabilization. All three functions issued a challenge particularly to European wel- fare systems in the last few decades and, with view to the latter aspect, especially during the economic crisis 2008-09. One the one hand, the tax reforms that took place in many industrialized countries including Europe during the 1980’s until 2000’s involved a movement away from highly progressive schedules, emanating from the believe that existing tax systems provide large disincentives to work, and hence decrease economic efficiency through high costs of redistribution.1 On the other hand, the rising growth in income inequality which can be observed since then is seen to be a result of those policy changes at least to some extent2 and re-initiated a debate about how to design a ‘fairer’ tax system that better meets the concern for equality.3 Lastly, European tax-transfer systems were partly con- fronted with the fact that they were unable to sufficiently cushion the consequences
1These reforms were accompanied by similarly motivated reforms of labor market institutions, among other things implying a reduction in generous unemployment benefits (see e.g. Nickell (1997); Nickell, Nunziata and Ochel (2005)).
2For a documentation of those trends in policies and inequality, see e.g. OECD (2008, 2011).
3See e.g. Atkinson (2013). This is even more true for the US than Europe, where the tremendous growth in the income share of the top 1% has led to a particular claim of taxing more the rich (cf. Piketty and Saez (2003)).
CHAPTER 1. INTRODUCTION 2 of the recent economic crisis. However, despite the common trends, European tax- transfer systems still differ significantly in achieving more equality through redistri- bution and in providing insurance against asymmetric shocks. Thus, assessing and understanding those differences is of crucial importance to properly characterize tax-transfer systems and to subsequently show possible paths for better-designed policies. This thesis contains five essays that aim at contributing to this end.
In the second chapter we start by investigating the redistributive tastes being implicit in the European tax-transfer systems. While a large part of the empir- ical literature simply focusses on the extent of redistribution for that purpose, they ignore labor supply behavior, and hence important constraints faced by gov- ernments when setting taxes. More comprehensive approaches account for the
‘equity-efficiency trade-off’ underlying tax-benefit policy design, but only make use of “plausible” and mostly uniform elasticities taken from the literature. Thus, to go one step further, it is first necessary to quantify potential cross-country dif- ferences in labor supply behavior, and then to reassess the redistributive objectives of different tax-transfer designs. This is the contribution of Chapter 2 which ad- dresses the following key question: “To what extent do redistributive preferences – revealed through the tax-transfer system – differ across countries when accounting for actual differences in labor supply responses to taxation?” We also include the US in our study which is of particular interest in comparison to Europe, given a literature pointing to the differences in terms of redistributive tastes on the one hand, and the differences in terms of work-leisure preferences between both con- tinents on the other hand.4 The redistributive preferences are derived in form of the inequality aversion parameter of a social welfare function based on an optimal tax model that allows for agents’ participation as well as hours decision in labor supply (Saez (2002)).
The third chapter is concerned with a more fundamental question, namely how individual welfare should be derived that eventually will be the ingredient to a social welfare function used to determine redistribution. Most of the optimal tax literature in the tradition of Mirrlees (1971) assumes that individuals have the same deterministic preferences over consumption and leisure and only differ with
4See e.g. Alesina and Glaeser (2004), Alesina and Angeletos (2005); Blanchard (2004), Alesina, Glaeser and Sacerdote (2005).
3 CHAPTER 1. INTRODUCTION respect to skills and (hence) wages. In contrast, more recent approaches recognize that individual outcomes not only result from skills, which to some extent can be seen as endowed circumstances, but also from individual preferences. Furthermore, while Mirrleesian approaches assume cardinality of utilities in order to compare individual welfare levels, those approaches limit the analysis to the original con- cept of ordinal utility. Rather, individual comparability to answer the question who should eventually redistribute towards whom is introduced by certain ‘fair- ness considerations’ based on a general principle, namely that individuals should be held responsible for their preferences but not for endowed circumstances (see for an overview Fleurbaey (2008); Fleurbaey and Maniquet (2010)).5 As a result, not all inequalities in outcomes might legitimate redistribution. However, the same lit- erature has also precisely shown that, even if likely to be in conflict with this main principle, it might not always be possible to remove ethical priors about individual preferences. Yet, these priors are made explicit in the analysis. This is of special interest with respect to taxation because the identification of the individuals that deserve compensation might differ depending on the specific individual welfare metric at use – and not (only) on the inequality aversion parameter of the social welfare function. This is fundamentally different from the model of Saez (2002) used in Chapter 2 which actually allows for heterogeneity in consumption-leisure preferences of the individuals but where the treatment of this heterogeneity still remains implicit and thus unclear. While new models of optimal, ‘fair’ taxation have accordingly been derived (e.g. Fleurbaey and Maniquet (2006, 2007, 2011) ), it is beyond the scope of the chapter to develop an accordant empirical frame- work that could characterize countries’ tax-benefit systems similarly to Chapter 2.
Rather, as a first step, we provide individual welfare comparisons in a European context when allowing for differences in consumption-leisure preferences.6 This is also motivated by a literature that emerged around a ‘beyond-GDP’ debate, which
5The philosophical roots of this so-called ‘fair allocation’ literature go back to a very fundamental debate in contemporary political philosophy about what should determine the desirability of different social states (for an overview, see Kymlicka (2002)). It was initiated by Rawls (1971) who criticized utilitarianism for only allowing individual utilities fulfilling this function. How- ever, if we do not want to redistribute to individuals who, e.g., have a very high preference for leisure and therefore earn less income, then we need an argument that has to be based on non-utility factors, hence implying a rejection of utilitarianism.
6As in Chapter 2, we again include the US in the analysis for comparison.
CHAPTER 1. INTRODUCTION 4 emphasizes the respect for the different dimensions of individual well-being (e.g.
health or leisure besides income) but also individual preferences over those dimen- sions (for an overview, see Blanchet and Fleurbaey (2013)). The contribution of Chapter 3 is a first empirical illustration into that direction by asking: “To what extent do cross-country comparisons of individual welfare differ when accounting for possible heterogeneity in consumption-leisure preferences?”
In Chapter 4, we analyze if redistributive policies in European countries reduce inequality in opportunities. In recent years, in research but also in the public and political debate, there has been a shift of focus from inequalities in income to inequality of opportunities by arguing that a society should guarantee its mem- bers equal access to opportunities for income acquisition rather than to equalize outcomes. This view allows to differentiate between inequalities that are due to circumstances (e.g. family background in form of parental education), and in- equalities that arise due to the application of different effort levels. It is therefore closely related to the ‘normative background’ of Chapter 3. However, the spe- cific economic approach considered here goes back to Roemer (1993, 1998) and is somewhat different as one does not need direct information about individual pref- erences. Rather, from a viewpoint of empirical application, it might appear to be more attractive as it only requires to know the distribution of income or well-being for each circumstance class (and the position of individuals within), and hence can be applied even when circumstances only are observable but not the ‘responsibility characteristics’ themselves.7 Yet, the impact of tax-benefit policies on inequality of opportunity is still rarely addressed in the existing literature and in Chapter 4 we contribute by asking: ”Are tax-transfer systems in Europe reducing inequality of opportunity and, if yes, how does its extent compare to the reduction in income inequality?”
In Chapters 5 and 6, we additionally turn to the stabilizing function of Euro- pean tax-transfer systems. In the aftermath of the economic crisis 2008-09, this has gained particular importance given the accumulation of debt in many coun- tries and the resulting inability especially of some Southern European countries
7For recent overviews on empirical approaches to the “equality of opportunity” concept, see Pignataro (2012) or Ramos and Van de gaer (2012). For the philosophical differences between Roemer’s approach and the literature cited with respect to Chapter 3, see e.g. Fleurbaey (2008, Ch. 8) and a recent discussion between Fleurbaey (2013) and Roemer (2013).
5 CHAPTER 1. INTRODUCTION to provide insurance against asymmetric income shocks (see e.g. Bertola (2013)).
This experience initiated a debate about more fiscal integration in the euro area.
Besides more effective rules for fiscal policies or the introduction of specific crisis mechanisms8, the discussion also included more fundamental and ambitious pro- posals as that of van Rompuy (2012), arguing for a ‘fiscal capacity’ for Europe.
Yet, as in the nature of things, little is known in the literature about the possible economic effects of deeper fiscal integration in Europe from an empirical view- point. In Chapter 5, we therefore set up an hypothetical scenario and analyze the economic effects of two key elements of existing fiscal federations, if they had been introduced together with the euro area in 2001. Precisely, we ask: “What would have been the economic effects in terms of income redistribution and macroeco- nomic stabilization, if i) a European tax-transfer system or ii) a European fiscal equalization mechanism would have been introduced together with the monetary union?”.9
Chapter 6 is a direct extension to the fifth chapter. In Chapter 5, redistributive effects are analyzed separately (at the micro level) from stabilizing effects (at the macro level). This might not allow for a comprehensive conclusion whether a country would really gain or lose from more fiscal integration. As a consequence, this could be an obstacle to political feasibility, assuming that unanimity of all EU member states would be required as is currently the case in the Council of the European Union for tax matters. Using recent data before the crisis, we therefore apply an explicit theoretical approach based on individual equivalent variations derived from an expected utility model. This allows to assess the interesting question whether a reform would be Pareto improving in the sense that at least one country gains while no one loses. Focussing on different compositions of fiscal federations as well as varying crisis scenarios, the additional key questions we ask in Chapter 6 are therefore: “What would be the integrated individual value in terms of redistributive and stabilizing effects when introducing a European tax-transfer system and what are the preconditions for a Pareto improving introduction?”
8For an overview on current fiscal policies in the EMU and its state of integration, see European Commission (2012).
9For detailed overviews on the structure of existing tax systems of the EU member states, see EUROSTAT (2013) or OECD (2013).
CHAPTER 1. INTRODUCTION 6
1.2 Methodology: counterfactual simulations and labor supply estimation
The central methodological approach that is subsequently applied to identify the parameters of interest is the technique of counterfactual simulations. Simulation analysis allows to conduct a controlled experiment where some parameters are changed while holding everything else constant. This ensures a clear identification of the simulated effect and, by construction, removes the issue of any endogeneity or the influence of confounding factors. This especially applies to the method of microsimulation using tax-transfer calculators. Such models usually simulate direct taxes, social insurance contributions and cash benefits for representative microdata samples of households which serve as the model input. By changing one or several of those policy parameters hypothetically, the distributional effects to the tax system can precisely be assessed (cf. Bourguignon and Spadaro (2006)).
These models are static in the sense that they only consider immediate ‘first round’ effects in terms of direct distributional consequences. However ‘second round’ effects can be incorporated by extending the static model with a behavioral component. For tax-transfer calculators, this is classically a labor supply model.
The key identification here comes from an estimation of labor supply elasticities based on a counterfactual wage change and is usually performed using a structural model, i.e. all behavioral parameters are fully specified. Standard in the literature on tax reforms is the use of discrete choice models (cf. e.g. van Soest (1995);
Hoynes (1996); Blundell, Duncan, McCrae and Meghir (2000)). In this framework, labor supply decisions are reduced to choosing among a discrete set of possibilities including non-participation as one of the options in order to directly estimate both the extensive (participation) and intensive margin (working hours) decision.
Thereby, a discrete choice model allows to account for the non-linear effect of tax- benefit systems on household budgets as net income needs to be determined at each discrete point. Furthermore, discrete choice models are estimated via a direct specification of individual utility functions which facilitates welfare evaluations.
Finally, in context of the present analyses, relying on structural models is also an important approach to obtain comparable estimates across countries as it seems indeed difficult to find natural experiments that would allow performing this task.
7 CHAPTER 1. INTRODUCTION In Chapters 2, 3, 5 and 6 we use EUROMOD, a static tax-benefit model for the EU and in Chapters 2 and 3 additionally TAXSIM, the NBER’s model for US fed- eral and state income taxes and benefits.10 In these two chapters, counterfactual wage changes are performed to estimate labor supply elasticities and individual utility functions respectively, using a harmonized specification across all countries under analysis to ensure comparability. While in Chapter 2, we additionally es- timate elasticities specific to the optimal tax model of Saez (2002) in order to derive inequality aversion parameters via an inversion procedure, estimated utility functions are directly used in Chapter 3 to compute a range of individual welfare measures. In both chapters, we apply the model developed by Bargain, Orsini and Peichl (2012), however, in Chapter 3, we estimate a different specification of the utility function.
Bargain et al. (2012)’s model is also used in Chapter 5 to assess potential labor supply reactions to a European fiscal federation. However, while using EURO- MOD’s database as an input in Chapters 5 and 6, we adopt a regression approach for the counterfactual introduction of a European tax-transfer system. Tax regres- sions can be seen as a ‘short-cut’ to tax-transfer simulation where given net taxes are predicted based on a very flexible specification estimated by use of higher order polynomials in gross income and all socio-demographic characteristics relevant for tax-benefit assignment. Therefore, the regression approach is a more flexible way to estimate a net tax function on a pooled sample, which is of key interest here.
Furthermore, in order to assess automatic stabilization in these two chapters, we manipulate the input data by simulating shocks to individual gross income. This can be seen as a controlled experiment that enables us to identify the shock ab- sorption of the tax-transfer system in form of net tax adjustment. Importantly, this approach is not at risk to be biased by discretionary fiscal policy or behavioral
10EUROMOD was originally created in the late 1990’s, by a consortium of research institutes with members from each EU15 country. The tax-benefit systems included in the model have been validated against aggregated administrative statistics as well as national tax-benefit models, and the robustness has been checked through numerous applications (see e.g. Bargain (2007)).
EUROMOD is constantly updated and the most recent version allows for a simulation of pol- icy systems up to 2010 for all current 27 EU member countries.For a current introduction to EUROMOD and information on the underlying input data, see Sutherland and Figari (2013).
There are also country reports available with detailed information on the modeling and valida- tion of each tax-benefit system, see http://www.iser.essex.ac.uk/research/euromod. For more information on TAXSIM see Feenberg and Coutts (1993) and http://www.nber.org/taxsim/.
CHAPTER 1. INTRODUCTION 8 reactions of economic agents which would be the case for ex-post analyses based on macroeconomic aggregates.
Chapter 4 is an exception in the sense that it does not make use of tax-transfer calculators. Yet, it also uses household microdata but conducts a purely descriptive analysis corresponding to the standard accounting approach to measure effective redistribution, where the identification simply follows from adding or subtracting different income components as e.g. factor income, taxes or benefits.
1.3 Summary of results
Chapter 2: Tax-benefit revealed social preferences
We analyze to which extent social inequality aversion differs across nations when controlling for actual country differences in labor supply responses. Towards this aim, we estimate labor supply elasticities at both extensive and intensive mar- gins for 17 EU countries (and the US). Using the same data, inequality aversion is measured as the degree of redistribution implicit in current tax-benefit systems, when these systems are deemed optimal. Our main results are as follows. We find relatively small differences in labor supply elasticities across countries. However, this changes the cross-country ranking in inequality aversion compared to scenar- ios following the standard approach of using uniform elasticities. Differences in redistributive views are significant between three groups of nations. Labor supply responses are systematically larger at the extensive margin and often larger for the lowest earnings groups, exacerbating the implicit Rawlsian views for countries with traditional social assistance programs. Given the possibility that labor supply responsiveness was underestimated at the time these programs were implemented, we show that such wrong perceptions would lead to less pronounced and much more similar levels of inequality aversion.11
Chapter 3: Welfare, labor supply and heterogeneous preferences In this chapter, we suggest an international comparison of individual welfare rankings that fully retain preference heterogeneity. Focusing on the consumption-
11This chapter is based on coauthored work, see Bargain, Dolls, Neumann, Peichl and Siegloch (2013c).
9 CHAPTER 1. INTRODUCTION leisure trade-off, we estimate discrete choice labor supply models using harmonized microdata for 11 European countries (and the US). We retrieve preference hetero- geneity within and across countries and analyze several welfare criteria which take into account that differences in income are partly due to differences in tastes. Our results indicate that the resulting welfare rankings clearly depend on the norma- tive treatment of preference heterogeneity with alternative metrics. We show that these differences can indeed be explained by estimated preference heterogeneity across countries – rather than demographic composition.12
Chapter 4: Equality of opportunity and redistribution
We first investigate how family background influences income acquisition in 17 European countries. Second, we particularly scrutinize how governments affect equality of opportunity (EOp) through redistributive policies. We apply two differ- ent methods in order to measure EOp and effective redistribution is measured via income concepts at different stages of the tax-transfer schemes. Our results reveal that both methods yield rather robust country rankings for various circumstance sets. We find clear country clustering in terms of EOp for Nordic, Continental European, and Anglo-Saxon countries. By examining the impact of redistributive policies in the countries under analysis, we conclude that both taxes and transfers reduce inequality of opportunity (IOp), with social benefits typically playing a key role. Furthermore, the equalizing impacts of the tax-benefit system on IOp differ substantially from the ones observed in the traditional notion of inequality of outcomes.13
Chapter 5: Economic effects of a European tax-benefit system and fiscal equalization mechanism
We study the economic effects of European fiscal integration focussing on two key elements of existing fiscal federations: the introduction of an EU-wide tax and transfer system and of a fiscal equalization mechanism. We exploit representative household micro data from 11 eurozone countries to simulate these policy reforms
12This chapter is based on coauthored work, see Bargain, Decoster, Dolls, Neumann, Peichl and Siegloch (2013a).
13This chapter is based on coauthored work, see Dunnzlaff, Neumann, Niehues and Peichl (2011).
CHAPTER 1. INTRODUCTION 10 and study their effects on the income distribution and automatic stabilizers. Our main results are as follows: First, we find that replacing one third of the national tax-benefit systems with a European system would lead to significant redistribu- tive effects both within and across countries. These effects depend on income levels and the structures of existing national systems. Second, the EU system would par- ticularly improve fiscal stabilization in credit constrained countries absorbing 10 to 15 per cent of a macroeconomic income shock. Third, introducing a fiscal equal- ization mechanism would redistribute revenues from high to low income countries.
However, the stabilization properties of this system are ambiguous.14
Chapter 6: Benefiting from a European fiscal union? Redistribution vs. stabilization
In Chapter 6 we build on the framework presented in Chapter 5 but use an explicit theoretical approach to analyze redistributive and stabilizing effects of European fiscal integration in an integrated way. Precisely, using an expected utility model, we calculate the individual equivalent variation of an integrated EU tax-transfer system relative to the baseline with national systems and provide a decomposition into a redistributive and a stabilization component. Our main results are as follows. We find that a majority of the current 27 EU member states, represented by their median voters, would gain from such a reform, which is mainly driven by the redistributive component. Effects across gross income deciles within countries differ and depend on income levels and the structures of existing national systems. Moving towards smaller fiscal unions, e.g. for the current eurozone or subgroups of even more similar countries, generally reduces redistributive and increases the stabilizing effects. However, Pareto improving reforms where at least one country gains while no one loses seem to be possible only for rather severe crisis scenarios with substantial shocks to gross income, or for high levels of individual risk aversion.15
14This chapter is based on coauthored work, see Bargain, Dolls, Fuest, Neumann, Peichl, Pestel and Siegloch (2013b).
15This chapter is based on Neumann (2013).
11
Chapter 2
Tax-benefit revealed social preferences
2.1 Introduction
The level of redistribution through taxes and transfers differs greatly between countries. In the empirical literature, standard characterizations of these differ- ences rely on the effect of tax-benefit systems on inequality and poverty. However, most studies ignore labor supply behavior when evaluating the level of redistri- bution, thus ignoring important constraints faced by governments when setting taxes. More comprehensive approaches, which account for the equity-efficiency trade-off underlying tax-benefit policy design, make use of “plausible” elastici- ties taken from the literature. For instance, Immervoll, Kleven, Kreiner and Saez (2007) compare the efficiency costs of redistribution across European countries by assuming “reasonable” uniform elasticities. The fact that some countries are willing to accept larger efficiency losses from redistribution reflects either highly redistributive views or – redistributive tastes being equal – larger labor supply re- sponsiveness to taxation. Hence, to go one step further, it is necessary to estimate labor supply elasticities on the same data used for optimal tax characterization.
In this way, country differences in social preferences can be disentangled from differences in individual consumption-leisure preferences.
This chapter addresses this issue by analyzing the extent to which social in-
CHAPTER 2. TAX-BENEFIT REVEALED SOCIAL PREFERENCES 12 equality aversion differs across nations when controlling for actual differences in labor supply responses. Using a common empirical approach, we estimate labor supply elasticities at both the extensive and intensive margin for 17 EU coun- tries and the US. Applying the same estimation method and model specification provides estimates that can be consistently compared across countries. We focus on a homogenous group, namely childless single individuals, with individual re- sponses aggregated to obtain elasticities at income group levels consistent with the discrete optimal tax model formulated by Saez (2002). As suggested by Bour- guignon and Spadaro (2012) in the case of France, we invert Saez’s optimal tax model to retrieve parameters for the degree of social inequality aversion (implic- itly) embodied in actual tax-benefit systems. Importantly, given the optimality of the observed systems and existing level of redistribution, social inequality aversion must be higher when labor supply is more responsive, i.e. efficiency losses from redistribution are higher.
Our results are as follows. We find relatively small differences in labor supply elasticities across countries. However, this changes the cross-country ranking in inequality aversion compared to scenarios following the standard approach of us- ing uniform elasticities. Differences in redistributive views are significant between three groups of nations.1 The revealed social inequality aversion parameters range from utilitarian preferences in Southern Europe and the US to Rawlsian2 views in Nordic and some Continental European countries. We find that labor supply responses are systematically larger at the extensive margin – generalizing previous results for the US to a large group of Western countries – and often larger for the lowest earnings groups. This result necessarily exacerbates the implicit Rawlsian views revealed for Continental European countries with traditional social assis- tance programs. However, revealed redistributive tastes become less pronounced and much more similar across countries if we impose zero labor supply responses (for instance, reflecting that policymakers may have ignored efficiency constraints
1That is, we obtain partial orderings. For instance, we can say that the French, Irish and UK systems are significantly “more Rawlsian” than the US system and less redistributive than the Swedish one. Yet we cannot conclude that inequality aversion is higher in France than in the UK or Ireland.
2Note that like many, we improperly use the term ”Rawlsian” throughout the chapter. Maxi- mizing utility of the worst off person in the society is not the original version of Rawls (1971) but a kind of welfarist version of Rawls, as explained in Kanbur, Pirttil¨a and Tuomala (2006).
13 CHAPTER 2. TAX-BENEFIT REVEALED SOCIAL PREFERENCES at the time these welfare programs were implemented). This finding highlights the importance of accounting for efficiency constraints when assessing social inequality aversion.
The chapter is structured as follows. Section 2.2 briefly reviews the related lit- erature. Section 2.3 presents the optimal tax model and the inversion procedure.
Section 2.4 describes the main elements of the empirical implementation (data, tax-benefit calculations and income concepts), while Section 2.5 presents the labor supply estimations. Inequality aversion results are reported and discussed in Sec- tion 2.6. Section 2.7 concludes. Descriptive statistics and labor supply elasticities are reported in the appendix.3
2.2 Related literature
The increasing availability of representative household datasets has allowed bring- ing optimal tax theory to the data (see the survey of Piketty and Saez (2013)).
However, empirical applications remain scarce and limited in policy relevance be- cause two fundamental primitives of the model are difficult to obtain, in particular using consistent data, i.e. labor supply behavior and social preferences. While most applications assume “plausible” values for both of them (as discussed be- low), we estimate these individual and social preference parameters from the same data.
First, in terms of labor supply elasticities, most optimal tax applications have drawn estimates from the literature. However, the size of elasticities varies greatly across studies, even for the same country, due to different empirical approaches, data sources, data selection and time periods (see Blundell and MaCurdy (1999);
Bargain et al. (2012)). Therefore, it is not clear which estimates to retain for cross- country comparisons. In our case, it is important to capture genuine differences in labor supply preferences across countries in order to retrieve tax-benefit implicit so- cial preferences. The present study suggests a harmonized approach that nets out the main methodological differences (estimation method, model specification, type
3Bargain et al. (2013c) includes an additional appendix (online version), gathering further ma- terial and robustness checks. Including it here would go beyond the scope of this thesis and the focus of this chapter.
CHAPTER 2. TAX-BENEFIT REVEALED SOCIAL PREFERENCES 14 of data). Another important aspect is the distinction between intensive and exten- sive responses. The crucial role of the extensive margin has been acknowledged in the optimal tax literature since Diamond (1980). Our estimates on single individ- uals show the major role of the extensive margin to be a consistent result across all countries, with the largest responses found in the low income groups. This result necessarily impacts on normative analyses (see Eissa, Kleven and Kreiner (2008)). Precisely, as explained by Immervoll et al. (2007), the prevalence of large participation responses particularly affects the debate on whether redistribution should be directed to the workless poor (through traditional demogrant policies) or working poor (via in-work support). Countries choosing traditional social as- sistance programs despite large participation responses in low income groups must therefore have very high redistributive tastes.
Second, available studies typically choose reasonable levels of inequality aver- sion to characterize optimal tax schedules. Inversely, a country’s redistributive preferences at a certain point in time can be explicitly retrieved by inverting the underlying optimal tax model. This approach was first suggested in the context of optimal commodity taxation (Christiansen and Jansen (1978), Stern (1977), Ahmad and Stern (1984), Decoster and Schokkaert (1989), Madden (1996)) and regulation of utilities (Ross (1984)). It has been extended to the Mirrlees’ income tax problem by Bourguignon and Spadaro (2012), who characterize the properties of the tax-revealed social welfare function and provide an illustration on French data, making assumptions regarding the level of labor supply elasticities. These elasticities are estimated on data for the UK and Germany in Blundell, Brewer, Haan and Shephard (2009), who retrieve the implicit social welfare functions for the two countries, focusing on single mothers. The present study adopts the opti- mal tax inversion approach to systematically compare redistributive tastes between European countries and the US. In a similar vein, Gordon and Cullen (2011) re- cover the implicit degree of redistribution between federal and state taxation in the US.
Our analysis follows the standard welfarist approach with the social planner maximizing a weighted sum of (increasing transformations of) individual utilities.
In this way, optimal tax formulas can be expressed in terms of the social marginal welfare weights attached to each individual (or income group), which measure
15 CHAPTER 2. TAX-BENEFIT REVEALED SOCIAL PREFERENCES the social value of an extra dollar of consumption to each individual (group).
This framework has recently been generalized by Saez and Stantcheva (2012) in considering endogenous social marginal welfare weights. On the one hand, in a normative approach, these weights can be ex-ante specified to fit some principle of justice. On the other hand, in a positive approach, implicit welfare weights can be derived empirically, namely by retrieving actual social preferences. Our tax-transfer revealed approach belongs to this second stream of research, which also includes attempts to directly elicit social preferences.4
Further to a mere measure of social preferences, it is also necessary to un- derstand the mechanisms shaping them (cf. Piketty (1995)) and investigate the political economy channel through which policies are designed and implemented.
Real world tax-benefit schedules result from historical and political economy forces.
Nonetheless, the fiction of a social planner can be seen as a proxy for a more com- plex political process. Probabilistic voting models suggest that particular social welfare functions are maximized in political equilibrium (cf. Coughlin (1992)).5 Saez and Stantcheva (2012) also show that the median voter optimal tax rate is a particular case of the optimal (linear) tax rate where social welfare weights are concentrated at the median. This clarifies the close connection between optimal
4Some studies elicit people’s attitude towards inequality using survey data (see e.g. Fong (2001), Corneo and Gr¨uner (2002), or Isaksson and Lindskog (2009)). Tax preferences obtained in surveys have also be compared with actual tax schedules (Singhal (2008)). In behavioral eco- nomics, experiments are often used to assess preferences of a group (see for instance Fehr and Schmidt (1999)). With the well-known ‘leaky bucket’ experiment, respondents are able to trans- fer money from a rich individual to a poor one but incur a loss of money in the process, so that the equity-efficiency trade-off is taken into account in measuring tastes for redistribution (see for instance Amiel, Creedy and Hurn (1999)); in recent experiments, participants have voted for alternative tax structures (e.g. Ackert, Martinez-Vazquez and Rider (2007)). Finally, in the public economic literature, implicit value judgments may be drawn from inequality measures, assuming a natural rate of subjective inequality (see Lambert, Millimet and Slottje (2003), Duclos (2000)).
5It would certainly be interesting to extend the present approach to some explicit political econ- omy model (see Castanheira, Nicod`eme and Profeta (2012), for a survey and empirical as- sessment), despite basic representations such as the median voter hypothesis being of limited applicability (cf. Alesina and Giuliano (2011)). Many dimensions are involved in the case of tax-benefit policy design in the real world, including other institutions (e.g. labor market policies, as noted above), various actors (workers, unions, lobbies), and the role of expert and international influences (cf. Banks, Disney, Duncan and Van Reenen (2005)), which are often not accounted for by theory. Furthermore, social choice models in presence of endogenous labor supply are rare.
CHAPTER 2. TAX-BENEFIT REVEALED SOCIAL PREFERENCES 16 tax theory and political economy. In the latter, social welfare weights that result from the political process are used rather than being derived from marginal utility of consumption as in the standard utilitarian tax theory. Nonetheless, the struc- ture of resulting tax formulas is the same. Finally, another way to approach the problem is to take political economy forces as distortions in the optimal tax design (see Acemoglu, Golosov and Tsyvinski (2010)). However, accounting for political economy considerations is beyond the scope of the present chapter. Hence, as discussed in the next section, we assume the observed system to be optimal while being agnostic about the underlying political process and using the most simplistic political economy model: the fiction of a social planner.
2.3 Optimal tax model and its inversion
We adopt the discrete version of the optimal tax model by Saez (2002), assuming the population to be partitioned intoI+ 1 income groups comprising I groups of individuals who work, ranked by increasing market income levels Yi (i = 1, ..., I), and a group i = 0 of non-workers. Disposable income is defined as Ci = Yi−Ti, whereTi is the effective tax paid by groupi(it is effective given that it includes all taxes and social contributions minus all transfers). Non-workers receive a negative tax, i.e. a positive transfer −T0, identical to C0 by definition and often referred to as a demogrant policy (minimum income, social assistance, etc.). Proportion hi measures the share of group i in the population. With this discretized setting, Saez derives the following formula for the optimal tax rates:
Ti−Ti−1
Ci−Ci−1
= 1 ζihi
I
X
j=i
hj
1−gj −ηj Tj −T0 Cj −C0
f or i= 1, ..., I, (2.1)
with ηi and ζi the elasticities at extensive and intensive margins respectively, and gi the set of marginal social welfare weights assigned by the government to groupsi= 0, ..., I.6 The elasticities are defined as:
6Note that CTi−Ti−1
i−Ci−1 corresponds to 1−TTi00 i
in the standard formulation of optimal tax rules, with Ti0 =TYi−Ti−1
i−Yi−1 the effective marginal tax rate (EMTR) faced by groupi.
17 CHAPTER 2. TAX-BENEFIT REVEALED SOCIAL PREFERENCES
ζi = Ci−Ci−1
hi
∂hi
∂(Ci−Ci−1), (2.2)
ηi = Ci−C0 hi
∂hi
∂(Ci−C0). (2.3)
Responses are restricted to only occur from one group to the neighboring group, and vice versa. Social preferences are summarized by the set of welfare weights gi. These weights can be interpreted as the(per capita) marginal social welfare of transferring one euro to an individual in group i, expressed in terms of public funds.
The only assumption made on individual preferences is that there is no income effect, a traditional restriction in this literature, supported by our empirical results as discussed below.7 When income effects are ruled out, an additional constraint emerges from Saez’s model, normalizing welfare weights as follows:
X
i
higi = 1. (2.4)
The inverse optimal tax problem is relatively straightforward. A system con- sisting of I equations (2.1) and equation (2.4) can be inverted to retrieve theI+ 1 marginal social welfare weights gi given appropriate values for (observed) income levels Yi, (simulated) net tax levelsTi and (estimated) elasticities ζi, ηi. The com- plete demonstration of the inversion procedure is documented by Bourguignon and Spadaro (2012).8 To summarize redistributive tastes in each country by a single-valued index, we use the parametrization suggested by Saez (2002) to relate
7Utility functions are not directly specified in Saez’s model. Yet, the weights gi comprise the derivative of the implicit social welfare function (integrated over all the workers within groupi) and the individuals’ marginal utility of income. Utility functions are, however, necessary for the estimation of elasticities. For this, we choose a flexible functional form (see Section 2.6). The condition of zero income effects is not imposed a priori, but rather checked a posteriori. We find small or insignificant effects, therefore this assumption is acceptable as a first approximation (see in the appendix).
8Due to the inversion procedure above we do not need to calculate elasticities for group 0 – there is no such elasticity according to definitions in equations (2.2),(2.3). In fact, the definition of the extensive/intensive elasticity for group 1η1(=ζ1) can be interpreted as the decrease inh1
due to a move to group 0 by workers whenC1−C0 decreases, or alternatively as the response by non-workers (a move to group 1) whenC1−C0 increases. This reverse response is entirely
CHAPTER 2. TAX-BENEFIT REVEALED SOCIAL PREFERENCES 18 weights and net incomes, i.e.:
gi = 1/(p·Ci)γ f or all i= 0, ..., I. (2.5) In this expression, p denotes the marginal value of public funds and γ is a scalar parameter reflecting the social aversion to inequality.9 The higher γ, the more pro-redistributive the social preferences, fromγ = 0 (utilitarian preferences) to γ = +∞ (the Rawlsian maximin case). For each country separately, we first obtain the values ofgi by the inversion of the optimal tax model, then we estimate the log of expression (2.5) to recover the structural parameterγ.10
Note that both the behavioral elasticities ηi and ςi and group sizes hi are en- dogenous to the tax-benefit system (as explained by Saez (2002) and discussed in Bargain et al. (2012)) or other institutions affecting labor supply behavior (such as child care arrangements). Hence, they depend on the social planner’s redistribu- tive views (represented here by the set of welfare weights gi and summarized by the inequality aversion parameter γ). This source of endogeneity can be a serious problem for the standard optimal tax approach, i.e. when using observed data
determined by normalization (2.4), i.e. simple algebra leads to:
C1−C0 h0
∂h0
∂(C1−C0)=−h1g1 h0g0
η1.
It does not mean that groups 0 and 1 are similar in terms of labor supply preferences, simply that only one Saez elasticity (here η1) is required to capture inter-group moves for these two groups.
9Of course, there are different views on what social inequality aversion really is - as , e.g., discussed by Lambert et al. (2003). We rely here on a parameter γ capturing the concavity of the social welfare function, as parameterized by Saez (2002, p. 1058).
10The present characterization could be based on alternative social objective functions. Kanbur and Tuomala (2011) have recently clarified the interrelationships between various types of social objectives, including some with sharp discontinuity at the poverty line (charitable conservatism and poverty radicalism) and less angular versions such as usual constant elasticity inequality aversion (as the measureγused here) and the “slow, quick, slow” empirical property of the Gini weights. Notice, however, that it follows from the discrete form of the social welfare function used in the Saez optimal tax model that we do not impose any restriction on the shape of the marginal social welfare weights (and hence allow for any discontinuities, as those present in charitable conservatism, for instance). We only impose a constant elasticity inequality aversion in equation (2.5), i.e. to derive a single-valued approximation of redistributive tastes in each country for the purpose of international comparisons. It could be interesting to replicate our analysis with non-welfarist objectives (e.g. Kanbur et al. (2006)) or welfare measures that preserve individual heterogeneity (see Fleurbaey (2008) and Chapter 3 of this thesis).
19 CHAPTER 2. TAX-BENEFIT REVEALED SOCIAL PREFERENCES on population weights and estimated elasticities to derive the optimal tax-benefit schedule. However, it is, by construction, not an issue in the inversion approach:
The key identifying assumption for this procedure to work is that the social plan- ner has optimally chosen policies such that the resulting income distribution (tak- ing into account behavioral responses) corresponds to the planner’s redistributive preferences. This optimality assumption necessarily incorporates elasticities and populations weights as well. Without the assumption, agents would respond to any ‘optimal’ policy set by the planner so that elasticities and group sizes would change. This would invalidate equation (2.1), i.e., actual tax levels would be no longer optimal (given the new values for elasticities and population weights), and the optimal tax rule should be applied again, generating further responses, etc.
Therefore, it must be assumed that at least one fixed point exists in which the left and right-hand sides of equation (2.1) are consistent. This is only the case when the observed system corresponds to the optimal one. Only under this assumption, we are able to recover the underlying inequality aversion of the planner in the given optimal tax framework.
2.4 Empirical implementation
We now present the data and tax-benefit simulations used to calculate Yi and Ci
as well as the income group definition. We use datasets for the US, 14 members of the EU prior to May 1, 2004 (the so-called EU-15, except Luxembourg) and 3 new member states (NMS), namely Estonia, Hungary and Poland. The differ- ent data sources fulfill the basic requirements for our exercise, i.e. they provide a representative sample of the population (and in particular the income distri- bution), are comparable across countries (the definition of the key variables has been harmonized), and contain the necessary information to estimate labor supply behavior.
The fundamental information required by the optimal tax model is the effective tax Ti = Yi −Ci for each income group i = 0, ..., I. Household gross income is aggregated to obtain Yi. We simulate taxes, social contributions and benefits in order to obtain household disposable income, which can be aggregated at the group
CHAPTER 2. TAX-BENEFIT REVEALED SOCIAL PREFERENCES 20 level to obtain Ci.11 Tax-benefit simulations are performed using two calculators:
EUROMOD for EU countries and TAXSIM for the US. EUROMOD is designed to simulate the redistributive systems of EU-15 countries and NMS. This unique tool provides a complete picture of the redistributive and incentive potential of European welfare regimes.12 The datasets associated to EUROMOD are presented in Tables 2.2 and 2.3 (appendix). We cover the policy years 1998 and/or 2001 for EU-15 countries and 2005 for NMS.13TAXSIM (version v9) is the NBER calculator presented in Feenberg and Coutts (1993), augmented here by simulations of social transfers. As in several contributions (e.g, Eissa et al. (2008), or Eissa and Hoynes (2011)), we use it in combination with the IPUMS version (Integrated Public Use Microdata Series) of the Current Population Survey (CPS) data. We use the 2006 data, which contains information on 2005 incomes.
Our selection focuses on potential salary workers in the age range 18−64 (thus excluding pensioners, students, farmers and the self-employed). We exclude all households where capital income represents more than 25% of the total gross in- come, as their labor supply differs from our target group. Most importantly, as with Blundell et al. (2009) we must focus on a homogenous demographic group, since aggregating across different household types within a social welfare func- tion poses fundamental difficulties in terms of household comparisons and implicit equivalence scales. Furthermore, Saez’s model is formulated for single individuals;
deriving optimal taxes for couple households with two potential earners is acknowl- edged as being much more difficult (see the survey of Piketty and Saez (2013)).
For our analysis, we thus select single men and single women without children.14
11Simulated disposable incomes are used in place of self-reported incomes for two reasons. First, they give a better rending of the redistributive intention of the social planner. Indeed, actual (and self-reported) levels of taxes or benefits are affected by non-intended behavior such as the low take-up rate of some benefits. Second, simulated incomes are also consistent with the need to simulate counterfactual disposable incomes for all options of hours worked in order to estimate the labor supply model.
12An introduction to EUROMOD, a descriptive analysis of taxes and transfers in the EU countries and robustness checks are provided by Sutherland (2001). EUROMOD has been used in several empirical studies, notably in the comparison of European welfare regimes by Immervoll et al.
(2007).
13Note that we make use of those policy years available in EUROMOD at the time of writing (1998, 2001 or 2005). For comparison, we use TAXSIM simulations for the year 2005.
14Blundell et al. (2009) focus instead on single mothers. In our case, samples of single parents in some countries are too small for meaningful results. Focusing on one homogenous group at
21 CHAPTER 2. TAX-BENEFIT REVEALED SOCIAL PREFERENCES Remarkably, we show that international comparisons on single individuals reflect much of the differences in overall redistribution across countries (see in the online appendix to Bargain et al. (2013c)).
In order to ease cross-country comparisons, we partition the population of each country into a small number of groups, I + 1 = 6. In our baseline, group 0 is composed of inactive individuals who report neither labor nor replacement income. Contributory benefits are treated as replacement income derived from a pure insurance mechanism; in particular, unemployment benefits are interpreted as delayed income. However, in the case of the UK, Ireland and Poland, unemploy- ment benefits (UB) are paid according to flat rates and have no strong link to past contributions. Hence, for these three countries UB are treated as redistribution.
Next, groups i= 1, ...,5 are simply calculated as income quintiles among workers.
Descriptive statistics of our selected sample are reported in Tables 2.2–2.3 in the appendix.15
2.5 Labor supply estimation
2.5.1 Empirical model
We estimate the behavioral elasticities from Saez’s optimal tax model, ηi and ζi, using a homogenous estimation method. We rely on a common structural discrete- choice model as used in well-known labor supply studies for Europe (e.g. Blundell et al. (2000), van Soest (1995)) or the US (e.g. Hoynes (1996)), which enables us to calculate comparable elasticity measures for all countries under study. Given that the structural labor supply model has become a standard tool in the literature, we only present our main modeling assumptions (more information can be found in the aforementioned studies as well as Blundell and MaCurdy (1999)). For each country separately (suppressing the country index in the following), we specify
a time implicitly assumes some separability in the social planner’s program, with a first stage of redistribution between demographic groups and a second stage with vertical redistribution within homogenous groups (see Bourguignon and Spadaro (2012)).
15A description of non-contributory social transfers and contributory UB as well as an extensive sensitivity analysis on the treatment of UB recipients is provided in the online appendix to Bargain et al. (2013c).