Estimation of
Convective Extreme Events over Germany based on
Large Scale Parameters
Inaugural Dissertation
zur
Erlangung des Doktorgrades
der Mathematisch-Naturwissenschaftlichen Fakultät der Universität zu Köln
vorgelegt von
Sven Ulbrich
aus Köln
Köln, 2016
Berichterstatter: PD Dr. Joaquim G. Pinto Prof. Dr. Yaping Shao
Tag der mündlichen Prüfung: 26. Oktober 2016
Abstract
Strong convective events can produce extreme precipitation, hail, lightning or gusts, po- tentially inducing severe socio-economic impacts. These events have a relatively small spatial extension and, in most cases, a short lifetime. In this study, a model is developed for estimating convective extreme events based on large scale conditions. It is shown that strong convective events can be characterized by a Weibull distribution of radar-based rainfall with a low shape and high scale parameter value. A radius of 90km around a station reporting a convective situation turned out to be suitable. A methodology is developed to estimate the Weibull parameters and thus the occurrence probability of convective events from large scale atmospheric instability and enhanced near-surface humidity, which are usually found on a larger scale than the convective event itself.
Here, the probability for the occurrence of extreme convective events is estimated from
the KO-index indicating the stability, and relative humidity at 1000hPa. Both variables
are computed from ERA-Interim reanalysis. In a first version of the methodology, these
two variables are applied to estimate the spatial rainfall distribution and to estimate the
occurrence of a convective event. The developed method shows significant skill in es-
timating the occurrence of convective events as observed at synoptic stations, lightning
measurements, and severe weather reports. In order to take frontal influences into ac-
count, a scheme for the detection of atmospheric fronts is implemented. While gen-
erally higher instability is found in the vicinity of fronts, the skill of this approach is
largely unchanged. Additional improvements were achieved by a bias-correction and
the use of ERA-Interim precipitation. The resulting estimation method is applied to the
ERA-Interim period (1979-2014) to establish a ranking of estimated convective extreme
events. Two strong estimated events that reveal a frontal influence are analysed in detail.
ii Abstract
As a second application, the method is applied to GCM-based decadal predictions in the
period 1979-2014, which were initialized every year. It is shown that decadal predictive
skill for convective event frequencies over Germany is found for the first 3−4 years after
the initialization.
Zusammenfassung
Konvektive Ereignisse können starke sozioökonomische Auswirkungen durch ausserge- wöhnlichen Niederschlag, Hagel, Blitze oder Böen verursachen und sind somit von be- sonderem Interesse. Diese Ereignisse haben typischerweise keine große horizontale Ausdehnung, haben meist eine kurze Lebensdauer und sind schwierig vorherzusagen.
In dieser Arbeit wird ein Modell zur Abschätzung von konvektiven Ereignissen basier-
end auf den großskaligen Bedingungen entwickelt. Es wird gezeigt, dass sich konvekt-
ive Ereignisse typischerweise in den Weibull-Parametern des Radar-basierten Nieder-
schlags durch einen niedrigen Shape-Parameter und einen hohen Scale-Parameter aus-
zeichnen. Ein Radius von 90km um eine Station, die ein konvektives Ereignis mel-
det, erwies sich dabei als geeignet. Eine Methode wird entwickelt um die Weibullpara-
meter und damit die Auftrittswahrscheinlichkeit von konvektiven Ereignissen basierend
auf einer instabilen atmosphärischen Schichtung und erhöhter bodennaher Luftfeuchte
abzuschätzen. Diese beiden atmosphärischen Größen weisen typischerweise größere
Muster auf als ein konvektives Ereignis. In der vorliegenden Studie wird die Wahrschein-
lichkeit des Auftretens von konvektiven Extremereignissen basierend auf dem KO-index
und der relativen Feuchte auf 1000hPa abgeschätzt. Beide Parameter werden basier-
end auf ERA-Interim Reanalysen berechnet, und genutzt um zunächst die räumliche
Niederschlagsverteilung abzuschätzen. Basierend auf dieser wird das Auftreten eines
konvektiven Ereignisses identifiziert. In der Vorhersage von konvektiven Ereignissen,
die durch Beobachtungen an Wetterstationen, Blitzmessungen oder Extremwetterbeo-
bachtungen definiert sein können, weist die Methode einen bedeutenden Skill auf. Um
einen Einfluss durch Fronten zu berücksichtigen, wurde eine automatisierte Frontanalyse
angepasst. Obwohl die Stabilität der Atmosphäre in der Nähe einer Kaltfront geringer
iv Zusammenfassung
ist, bleibt der Skill der entsprechenden Methode nahezu unverändert. Ein zusätzlicher
Performancegewinn konnte durch eine Biaskorrektur und Nutzung des ERA-Interim
Niederschlags erzielt werden. Die entwickelte Methode wird auf den ERA-Interim
Zeitraum (1979-2014) angewandt um ein Ranking der abgeschätzten konvektiven Ex-
tremereignisse zu erzeugen. Zwei starke Ereignisse werden detailliert analysiert. Beide
weisen einen frontalen Einfluss auf. Als zweites wurde das Verfahren auf GCM-basierte
dekadische Vorhersagen für den Zeitraum 1979-2014 angewandt, welche jährlich ini-
tialisiert werden. Für konvektive Ereignisse in Deutschland zeigt sich ein dekadischer
Vorhersageskill für die ersten 3-4 Jahre nach der Initialisierung.
Contents
Abstract i
Zusammenfassung iii
Abbreviations ix
1 Introduction 1
1.1 Motivation . . . . 1
1.2 Outline and overview . . . . 4
2 Scientific background 5 2.1 What is a convective event? . . . . 5
2.1.1 Requirements of an convective event . . . . 6
2.1.2 Triggering events . . . . 10
2.1.3 Modelling of convective events . . . . 11
2.2 Convective events in Germany . . . . 12
2.3 Rainfall properties of events . . . . 14
2.4 Fronts . . . . 16
2.4.1 Contribution of fronts to convective events . . . . 17
3 Data 19 3.1 Station data . . . . 19
3.2 Radiosounding data . . . . 22
3.3 Lightning data . . . . 23
3.4 ESWD database . . . . 24
vi CONTENTS
3.5 Radolan data . . . . 25
3.6 Reanalysis dataset ERA-Interim . . . . 26
3.7 Time periods of different datasets . . . . 27
4 General approach 29 5 Methods 31 5.1 Rainfall distribution functions . . . . 31
5.1.1 Poisson distribution . . . . 32
5.1.2 Negative exponential distribution . . . . 32
5.1.3 Weibull distribution . . . . 33
5.2 Non-linear regression . . . . 34
5.3 Measures of skill . . . . 34
5.4 Analysis of fronts . . . . 36
6 Results 39 6.1 Analysis of rainfall in reanalysis . . . . 39
6.2 Spatial rainfall ristribution associated with convective events . . . . 41
6.2.1 Representative radius for convective weather phenomenon . . . 41
6.2.2 Lightning in the vicinity of stations reporting a convective weather situation . . . . 44
6.2.3 Identification of convective events from the spatial rainfall char- acteristics . . . . 46
6.3 Influence of stability parameters on station rainfall distribution . . . . . 54
6.4 Improvement of estimation of rainfall parameters . . . . 63
6.4.1 Fronts . . . . 64
6.4.2 Bias-correction . . . . 72
6.4.3 Additional improvement by inclusion of model rainfall . . . . . 79
6.4.4 Summary of improvements . . . . 81
6.5 Model combination and validation . . . . 82
6.6 Ranking of estimated events . . . . 86
6.7 Case studies . . . . 89
6.7.1 Case of 21 July 2014 . . . . 89
6.7.2 Case of 21 June 2007 . . . . 92
6.8 Application to decadal predictions . . . . 95
7 Summary and discussion 99
Contents vii
7.1 Summary . . . . 99
7.2 Discussion and conclusion . . . 101
A Stability/humidity indices 107 A.1 Vertical totals . . . 107
A.2 Total totals . . . 107
A.3 KO-index . . . 108
A.4 S index . . . 109
A.5 Potential instability index . . . 109
A.6 Lifted index . . . 109
A.7 Showalter index . . . 110
A.8 Deep convection index . . . 110
A.9 CAPE . . . 111
A.10 CIN . . . 111
A.11 K-index . . . 112
A.12 SWEAT . . . 113
A.13 SWISS
12. . . 113
A.14 DSI . . . 113
A.15 Helicity . . . 114
A.16 Storm-relative environmental helicity . . . 114
A.17 Energy helicity index . . . 114
A.18 SHUM
1000→500. . . 115 B Estimating transformed rainfall intensity distribution parameters from the
KO/RH index 117
References 119
Abbreviations
DWD . . . . Deutscher Wetterdienst
ECMWF . . . . European Centre for Medium-Range Weather Forecasts ERA-40 . . . . ECMWF 45-year reanalysis project
ESSL . . . . European Severe Storms Laboratory ESWD . . . . European Severe Weather Database GCM . . . . General circulation model
MCS . . . . Mesoscale Convective System
NCAR . . . . National Center for Atmospheric Research NCEP . . . . National Centers for Environmental Prediction PDF . . . . Probability density -function
Radolan . . . . Radar-Online-Aneichung
RCM . . . . Regional climate model
1 Introduction
1.1 Motivation
Intense atmospheric convection can lead to extreme precipitation, hail, lightning, and gusts. These impacts can cause enormous losses and fatalities. For example, the Ger- man Insurance Association (‘GdV‘) announced that hailstorms in Germany generated a total loss of more than 4 billion Euro in 2013 (source: German Insurance Association (2014a)). The ’Naturgefahrenreport 2014’ of the GdV states that 28% of the losses in 2013 at insured buildings were caused in summer by extreme winds and hail. In fact, convective events are responsible for a large amount of damage during the summer in Germany (e.g. Kunz (2007)). On a longer time-scale, like e.g. for the period from 2002- 2013, 12% of damages at insured residential buildings occurred in summer due to hail and extreme winds, which is in the same order of magnitude as losses caused by ex- treme winds and hail in winter (15%) (source: German Insurance Association (2014b)).
Beside damages of residential buildings, losses produced by convective events are re- ported for example as damages of facilities or cars. Companies may experience losses related to convective events caused by business interruptions due to early warnings. Ex- treme precipitation events (e.g. flash floods) are another major hazard associated with intense atmospheric convection. Because of their rapid development and their rather re- gional scale characteristics, they are difficult to predict (Gallus Jr. (1999); Roberts &
Lean (2008)). Additionally, intense convective precipitation can contribute to large river
floods (e.g. Bronstert et al. (2002)) and are of strong importance for floods in smaller
catchments.
2 1 Introduction Events with a high loss are a risk for insurance companies for different reasons. For example, the underestimation of such risk is a problem for a company. Insurance com- panies commonly obtain an estimation of loss frequencies based on past events. Such database of past losses can only comprise reported events, but some extreme convective events do not hit any insured facilities and are therefore not included in such database.
Insurance companies desire to estimate frequencies of losses due to extreme convective events, which requires a larger dataset. An estimation of such extreme events based on meteorological observations for a climatological timespan could contribute to a better estimation of loss frequencies.
In general, a rough estimation of the frequency of extreme convective events can be obtained from synoptic observations, which provide the longest measured meteorolo- gical time-series. Extreme convective events are often accompanied by hail, extreme gusts, lightning and extreme precipitation, which are continuously reported by weather observation stations. They provide information about different weather phenomena, pre- cipitation type and in-situ measurements. The different impacts/hazards (intense short rainfall, lightning, and gusts) are often related, but sometimes show different intensit- ies. For example, it is possible that a convective event produces intense rainfall, while e.g. no lightning occurred. Dry convection is usually not strong enough to cause major impacts. Problematic in the analysis of such events is the relatively small database of observed extreme convective events. This is not only due to their rarity, but also due to their usually relatively small spatial extension and their short lifetime. Therefore, many extreme convective events were not observed and hence not reported.
Besides the possibility of in-situ measurements, rainfall and lightning have the advant- age that their position and intensity can be obtained or estimated from remote sensing data. Unfortunately, these datasets are just starting to have a sufficient length to provide statistic significant frequencies of extreme convective events (Junghänel et al. (2015)).
Lightning strike positions are identified as 3-dimensional positions and collected in a
database for Germany since 2007. Since June 2005, the meteorological radar coverage
increased and provides a detailed information of estimated precipitation rates. In con-
trast to lightning, which appears only for some intense convective events, convective
precipitation occurs also for weak convective events. It is therefore useful to identify
characteristics of extreme convective and weak/normal convective events to develop an
identification of extreme convective events. In addition to precipitation intensities, hail
occurrence can be estimated based on radar data (e.g. Waldvogel et al. (1979); Bringi
1.1 Motivation 3 et al. (1984); Aydin et al. (1986)).
To summarize, databases for strong convective events which may lead to high losses are still short or contain only local information. For socio-economic purposes, an area wide database of strong convective events for a long historical period would be benefi- cial. Some first time-series become a sufficient length for climatological investigations (e.g. Junghänel et al. (2015)). Further, methodologies for future climate scenarios and decadal predictions are desired in order to enable an estimation of changes in frequen- cies on these time scopes.
The aim of this study is to develop a methodology to estimate extreme convective events from large-scale parameters.
For this development, different data sources are combined. These are radar data, ra- diosoundings, reanalysis data, and lightning data. The central dataset is the radar data- set, which is only available for Germany. Therefore, the investigation area is Germany.
In this study, a regression model is established to estimate the rainfall characteristics based on large-scale conditions like atmospheric stability indices and humidity. The final method is then applied to large-scale parameters from reanalysis and global circu- lation models (GCMs).
In summary, the following research questions are addressed in this study:
• Is it possible to establish a model to estimate the probability and intensity of ex- treme convective events based on large-scale parameters?
• How are local spatial rainfall properties related to atmospheric humidity or stabil- ity parameters?
• Do other conditions influence the probability of convective events, which can be obtained from large scale data?
• Are these resulting estimated events characterized by strong surface gusts?
• Do decadal predictions show a predictability of convective extreme events for re-
forecasts (also called hindcasts)?
4 1 Introduction
1.2 Outline and overview
The current state of research is presented in the chapter 2. Chapter 3 describes the data- sets used. The data comprises measured/observed data as well as derived parameters and models.
Chapter 4 introduces the general approach in more detail. Different data sources (station observations, precipitation based on radar data and lightning measurements) are com- bined. It is investigated to what extent spatial rainfall properties in the surrounding of a station are related to the same-time-observed weather phenomenon at the station. One key parameter providing information of the potential of the occurrence of extreme con- vective events is vertical stability of the atmosphere, as it is quantified by a number of available stability indices. Therefore, the influence of stability and humidity parameters on the spatial rainfall distribution is addressed.
The approach requires methods, which are presented in chapter 5. The presented meth-
ods comprise rainfall intensity distributions, statistics such as regression techniques, as
well as an objective frontal analysis and its adjustments for this study. The results are
presented in chapter 6: It includes a discussion of the spatial rainfall intensity distribu-
tions for convective events based on different data sources, a discussion of the influence
of objective fronts on the observed weather phenomena and the observed rainfall para-
meter. The parameters for estimating convective events are identified and then applied
and validated in this chapter. The method is applied to a reanalysis dataset and an event
ranking is produced. Two of the most intense ranked events are discussed. Probabilities
and intensities of convective events estimated from large scale atmospheric parameters
are derived from decadal predictions. In the end, results are summarized and discussion
and a short outlook are given.
2 Scientific background
This chapter reviews scientific findings regarding convective events. Starting from the definition of an convective event and a description of the associated effects (section 2.1), the preconditions for the occurrence of intense events are presented (section 2.1.1), which includes in particular indices of atmospheric stability indicating conditions fa- vourable for convection are introduced (section 2.1.1). The initialization of a convective event is discussed (section 2.1.2), and the estimation of convective rainfall in numerical climate models is analysed (section 2.1.3). Then, aspects of convective events regard- ing the investigation area are introduced (section 2.2). Research results regarding rain- fall properties during convective events are presented (section 2.3). In particular, their spatio-temporal rainfall properties are investigated and properties of rainfall which were identified based on other accompaniments of convective events. Finally, front identifica- tions are discussed (section 2.4) and, using these schemes, frontal impact on convective events (section 2.4.1).
2.1 What is a convective event?
A convective event is a micro- to meso-scale atmospheric phenomenon characterized
by intense vertical movements. Convection is usually connected with condensation of
water vapour. More precisely, an intense convective event is usually associated with
localized rainfalls of high intensity on short duration, strong gusts, and sometimes hail
or lightning. This study focusses on convective extreme events, which can be divided in
6 2 Scientific background four different kinds:
• single thunderstorm cell
• multi-cell system
• supercell
• mesoscale convective system
All these systems require a (potentially) unstably layered atmosphere (i.e. absolute, conditional or potential instability), and high humidity close to the surface. Also, an initiation mechanism is required. Differences appear in some conditions, mainly the vertical wind shear and moisture transports. The initial lifting, for example caused by gravity waves, frontal lifting, pre-existing density flow or the exceedence of the con- vective temperature, does not determine the type of thunderstorm. Nevertheless, the types of initial lifting are not independent of preconditions of the thunderstorm types, which have been discussed in the literature (e.g. Wallace & Hobbs (2006)). The dif- ferent types of thunderstorms are related to different spatio-temporal characteristics of rainfall intensity. Several properties of thunderstorm types imply a diverse impact, such as spatial extension, lifetime, and vertical movements. A single thunderstorm cell is spa- tially the smallest convective system presented here. It has a short life-time, typically 30-60 minutes, and a diameter of up to few kilometres. The multi-cell system consists basically of multiple single thunderstorm cells. It is a moving system in which old cells are replaced by new cells. This development can progress for several hours. The spatial extension of a multi-cell system is more than 30km. Even more intense is the so called supercell, which leads to enormous precipitation, often to intense gusts and hail. The lifetime of a supercell is typically 1-8 hours, and its spatial extension is up to 50 km.
2.1.1 Requirements of an convective event
Atmospheric stability is of major importance for vertical movements in the atmosphere and particularly for the development of an convective system. Convective systems de- velop from an initial disturbance, which grows to become the convective system. This growth can only appear in an environment supporting vertical movements. A useful concept to investigate the stability of the atmosphere was introduced by Petterssen et al.
(1946). They introduced a concept for the analysis of the atmospheric stability based
on an air parcel concept. The air parcel has no interaction with its surrounding except
for adopting to surrounding pressure. Buoyancy is caused by a temperature difference
between an air parcel and its surrounding. For the development of the air parcel, the
dry adiabatic lapse rate for unsaturated air and the wet adiabatic lapse rate in case of
2.1 What is a convective event? 7 saturation are relevant parameters. Assuming a static case, the energy which an surface air parcel gains by its ascend can be calculated and is described by the parameter CAPE.
The energy, which needs to be exceeded to reach the level of free convection (i.e. the level in which the parcel is warmer than its surrounding) is called convective inhibition (CIN). These are integrated measures of the atmosphere, which best represent the stabil- ity in a static case. Additional instability maybe influenced by processes like temperature advection or vertical movements. The presented parameters are only subset of a list of different stability parameters, which are presented in the following and more detailed in appendix A.
It is worth to mention that there are efforts to predict lightning based on a statistical- dynamical approach (e.g. Sousa et al. (2013)) and stability parameter based approach (e.g. Bright & Wandishin (2005), Santos et al. (2013)). Particularly the later are of interest due to thunderstorms indicating a subset of intense convective events. Hence, the associated parameters found in these studies mark good conditions for the growth of convective events (e.g. CAPE was identified in both studies to be a relevant parameter).
Different parameters have been developed in atmospheric science to indicate the prob- ability of occurrence of different types of convective events and notably thunderstorms (e.g. Showalter (1953), Haklander & Van Delden (2003)). Previous studies (e.g. Kunz (2007); Kunz et al. (2009)) have revealed that in particular the parameters Convective Available Potential Energy (CAPE), Lifted Index (LI) and Deep Convection Index (DCI) are good proxies for the occurrence of severe thunderstorms.
Stability Indices
The atmospheric stability is complex as it depends on different variables (temperature, humidity, wind). In addition, the vertical extension of unstable layering of the atmo- spheric column can be relevant for the development of convective systems. Therefore, many stability indices have been developed. Each of them draws a simplified picture of instability or is focussing on specific situations like deep convection, which is convec- tion in which air from the lower atmosphere is lifted to above 500hPa (Giaiotti et al.
(2006)). In addition to static cases, additional parameters such as wind profiles contrib-
ute to some stability indices. These additional parameters are specific to the formation of
particular types of thunderstorms or are designed to estimate particular effects of thun-
derstorms (e.g. gusts, lightning,...). For example, van Delden (2001) stated that the
potential instability index is optimized to represent the thunderstorm frequency. Most
stability parameters can be assigned to one of three levels. The first level is based on
8 2 Scientific background
stability index Reference
vertical totals (VT) Miller (1972)
total totals (TT) Miller (1972)
convective index (KO) Anderssonet al. (1989)
S-index Reymannet al. (1998)
potential instability index (PII) Van Delden (2001)
lifted index (LI) Galway (1956)
Showalter index (SI) Showalter (1953);Steinacker (1977) Deep convection index (DCI) Barlow (1993)
convective available potential energy (CAPE) Moncrieff & Miller (1976) convective inhibition (CIN) Colby J. (1984)
K-index George (2014)
Sever Weather Threat Index (SWEAT) Bidner (1970)
SWISS12 Huntrieseret al. (1997)
dynamical state index (DSI) Névir (2004)
storm-relative environmental helicity (SREH) Davies-Joneset al. (1990) energy helicity index (EHI) Hart & Korotky (1991)
Table 2.1:List of stability indices applied in this study and the corresponding references.
the temperature profile only, the second one includes additionally humidity and the third one also includes windshear. Hence, multiple stability indices have been developed in the past and are being developed. The most important parameters are listed in table 2.1 and introduced in more detail in the appendix A. Due to data requirements, not all presented parameters were investigated in this study.
Certain types of unstable atmosphere can be identified best in different levels and by dif- ferent parameters. In addition, it is possible to distinguish some stability indices based on the underlying concept of stability. Kunz (2007) states that the potential instability is underlying concept for the potential instability index and the KO-index, whereas the latent instability is the basic idea behind the indices lifted index, deep convection index, showalter index, and CAPE. Kunz (2007) investigated the skill of different convective indices to predict isolated and severe thunderstorms. A huge number of convective in- dices was compiled for this region and compared to loss-, radar-, hail- and SYNOP-data.
Applying different statistical indices, it was found that the most appropriate indices for
the prediction of thunderstorms are lifted index (averaged values of lowest 100hPa lifted
to 500hPa), deep convection index (surface air lifted to 850hPa), potential instability in-
dex and CAPE. Kunz (2007) compared the performance of the indices with underlying
concepts of latent instability (LI, DCI, CAPE) with indices of potential instability (KO,
PII). Focussing on severe thunderstorms, those indices of latent and potential instability
perform best which include information on temperature and humidity of the lowest at-
mospheric levels. Kunz (2007) also found that indices considering additional dynamic
2.1 What is a convective event? 9 information like the SWISS index show a slightly better performance in Germany than the KO index (designed by the German weather service). For the decision between thundery and non-thundery days, there is no large advantage of any of the 3 groups of instability concepts. Additionally, Kunz (2007) investigated the skill with regard to different datasets related to convective events in Baden Württemberg (radar reflectiv- ity, weather phenomenon reports and insurance data). For these data sets, the different indices revealed different skills depending on the choice of the thresholds used for the identification of a convective situation. Skills also depend on the thunderstorm intensity and dataset. Additionally, it should be taken into account that part of the indices con- sidered by Kunz (2007) have been developed for particular regions and cannot always be applied to other regions without a loss of prediction skill, which can be understood from regional differences in the relevant dynamics of convective event generation.
For the same region, the South-West of Germany, Kunz et al. (2009) investigated recent trends of thunderstorms and hailstorm frequencies. The frequency of thunderstorm days does not have a significant trend in the mean, while number of hail days and hail damage to buildings has significantly increased in the period from 1986 to 2004). They confirm that a large part of the hail days is associated with a south-westerly flow, and that the increase in the frequency of this flow direction in the past decades explains the posit- ive trend in hail days. No significant change was observed for the pattern most often associated with hail days. Another part of the work carried out by Kunz et al. (2009) concerns different convective indices based on temperature and moisture. Indices in- corporating information from the lowest atmospheric levels show a significant positive trend in values above a certain threshold and in extreme values. In contrast, indices using only information of higher levels, do not show a trend. Kunz et al. (2009) suggest that this contrasting behaviour is explained by a strong positive trend in lower layers, while properties of the upper layering change only marginally.
Changes of stability indices on smaller temporal scales have also been investigated using regional climate models. For example, Keil et al. (2014) found the temporal change of CAPE to be a good indicator to estimate the intensity of a convective event. Weisman
& Klemp (1982) suggested that the ratio of buoyant energy and vertical wind shear is a key factor for basic features of the convective storm structures. Using model stud- ies, they found that short lived cells are generated when vertical wind shear is weak.
At weak to moderate wind shear, secondary systems like in multi-cells appear, while
at moderate to strong wind shear, split storms occur, which were the model equivalent
10 2 Scientific background of observed super-cells. Another study based on numerical model simulations was per- formed by Droegemeier et al. (1993), who investigated the influence of helicity. The storm relative energy helicity index (SREH) was found to exceed 250m
2/s
2for convect- ive extreme events, which is higher than the threshold obtained based on observations 157m
2/s
2(Davies-Jones (1986)).
As indicated by the scientific work referenced in this chapter, parameters show differ- ent probability distribution functions (PDFs) for different types of convective systems.
Hence, a regression based on multiple parameters can improve the predictability of oc- currence of convective events. Such a regression has been applied in the development of stability indices incorporating dynamical and statical properties of the atmosphere, such as SWEAT (CAeM Working Group on Advanced Techniques Applied to Aeronautical Meteorology (1992)) or SWISS (Huntrieser et al. (1997)). Also, the occurrence probab- ility and the intensity have been investigated separately in the past, e.g., by Mohr et al.
(2015a), who used a multiple logistic regression in determining the occurrence probab- ility of hail. According to their study, the lifted index combined with the surface-near temperature (minimum and at 12UTC) and the circulation weather type perform best for this application.
2.1.2 Triggering events
An unstable atmosphere alone is not sufficient on its own for the occurrence of intense convection. An initial trigger is needed, which can be of different kinds. There are 3 main triggers: cold air moves below warm air, which rises above the lifting condens- ation level; horizontal moved air is forced to rise by an obstacle; and temperature is increased locally strongly enough to exceed the convective temperature (i.e. the surface temperature is increased over a small area so that the lifting condensation level is equal to the cumulus condensation level). Such trigger always induces a vertical displacement of air parcels with respect to the surrounding atmosphere. Note that also slantwise con- vection is generally possible.
The first important process initiating convective events is that cold air moves below the
warm surrounding air and forces it to rise. In particular, this process appears at cold
fronts. In general, it has the potential to trigger thunderstorms. In addition, cold air
advection increasing with height can lead to an unstable atmospheric layering. On small
scales, a cold, dense outflow of a pre-existing rainfall area, can induce this lifting. This
2.1 What is a convective event? 11 scale is subsynoptic and may therefore reduce the relationship of convective events and large-scale parameters.
Another effect is horizontally moving air rising to flow across orography, if it cannot go around the obstacle (this can be quantified using the Froude number). The orographic enhancement of precipitation over low mountain ranges has been investigated by, e.g., Kunz & Kottmeier (2006a). They applied a diagnostic model, which is based on the lin- ear theory of hydrostatic flow and calculates condensation rates from vertical lifting. In an idealized study, in which they defined the mountain to be bell shaped, they found the orographic (total) precipitation upstream of the mountain to be very sensitive to wind speed, static stability and temperature in 1000hPa. Applying their model to different situations in the black forest and comparing the results to precipitation measurements (in Kunz & Kottmeier (2006b)), they found the orographic precipitation maximum over the crests and some spillover in the lee of the mountains. Over their investigation area, the orographic precipitation could drift up to 50 km downstream. Rainfall in these two subregions (over the crests and downstream) are anti-correlated. The precipitation down- stream of the mountains can be reduced due to the effect of evaporation. The importance of this mechanism increases with the slope of the terrain. As the local orography does not change with time on the regarded time scales, the local rainfall climatology includes this effect. Therefore, this process is implicitly included in the climatology of rainfall characteristics.
Another process initiating lifting of air parcels within one air mass is a heterogeneous surface, which can play a major role in triggering convective events due to heterogeneous surface heating. Such inhomogeneity may be due to surface material, shadow/increased heating (associated with orographic slopes). As a result, a convective cell is forming in locally unstable conditions due to this local heating and attracts warm air near the surface from the surrounding area. This process is important for the location of thunderstorm initiation within an air mass. However, it appears on a small scale and cannot be obtained from a large scale analysis. Thus, this effect largely produces the difficulties in the prediction of thunderstorm locations.
2.1.3 Modelling of convective events
The analysis of summer storms (predominantly thunderstorms) is a difficult task as most of the relevant effects happen on the sub-synoptic scale and are typically non-hydrostatic.
That is why, high resolution models being capable to resolve non-hydrostatic processes
12 2 Scientific background are required to get further insight into their dynamics. In models of low resolution (e.g.
GCMs), convective events are not resolved, but their preconditions can be found. These preconditions are atmospheric instability and humid air close to the surface. Large- scale lifting of air masses, which can also trigger convection, may also be represented in GCMs.
High resolution simulations are one approach to understand dynamics involved in the de- velopment of convection better. Different studies have simulated extreme precipitation events with regional climate models (e.g. Semmler & Jacob (2004); Lenderink (2010);
Trapp et al. (2011)). Such high resolution models are designed to explicitly compute convection without making use of the respective parametrization schemes. For example, Chan et al. (2013) found the spatial resolution of a regional climate model first to im- prove the simulated daily precipitation and an increasing bias above a certain threshold, which was 12km resolution in their study. This result indicates that the parametrization needs to be adjusted to the model’s resolution. Currently, some convection resolving models are increasingly applied to overcome the deficiencies.
The boundary conditions for high resolution models can be provided by global reanalysis data, general circulation models (GCMs) or by relatively coarse RCMs. These do not resolve convection, but convective precipitation is needed in a parametrization scheme for the evaluation of the total precipitation in these datasets. Hence, precipitation is a forecasted also in reanalysis datasets. The modelled rainfall data and sometimes the modelled stability (as previously introduced in this chapter) are used for the investiga- tion and the identification of convective events. Different reanalysis datasets have been compared with respect to the analysis of extreme precipitation over Europe by Zolina et al. (2004). They found local disagreements in the patterns among different reana- lysis datasets. Particularly during summer this led to opposite trends in summer for the same period (last 4 decades). According to their analysis, during winter, the correlation between the station data and the reanalysis data is 20-30% stronger.
2.2 Convective events in Germany
Thunderstorms in Germany often occur in summer within warm and moist air masses,
but also at cold fronts, mostly in winter. Most thunderstorms appear in the South-West of
Germany over the local mountain ranges, which is one of the regions in Europe most fre-
quently affected by thunderstorms (see van Delden (2001)). The terrain of Germany can
2.2 Convective events in Germany 13
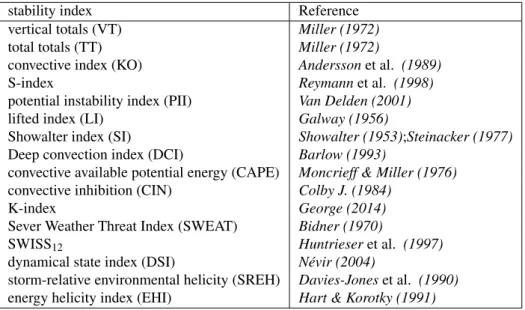
Figure 2.1:Orography of Germany and surrounding countries. The colour indicates the orography height (see legend). (map created with Ninjo)
be separated into 3 regions: lowlands in the North, uplands in the centre and Alps in the South. Often this is simplified by regarding Germany as two areas, the low orograph- ically structured North and the strong orographically structured South). Some studies focus on one of either parts of Germany. In the South-West of Germany, thunderstorms are typically associated with winds from the South-West. This latter synoptic setting can be explained by advection of warm, moist air from the Mediterranean region to Ger- many and consequently the transport of latent heat. Accordingly, Mohr et al. (2015a) found the circulation weather types with winds from South-West to be dominant for hail occurrences in the South-West of Germany. This is similar for other possible accom- paniments of convective events like gusts, lightning, and extreme rainfall. For the North of Germany, Katarzyna (2013) investigated for example the influence of atmospheric circulation on hail, which is associated with intense convective events. A low pressure system over northern Germany and Scandinavia was identified, implied by a largely negative anomaly of the sea level pressure and the 500hPa geopotential. The Azores high caused a north-western influx of cold, humid air. A negative temperature anomaly of 2
◦C was present for the hail cases, and increasing with height. In total, Katarzyna (2013) subdivided hail days into those occurring within air masses from northern to north-western and southern sources. The northern influxes caused negative anomalies of the temperature in the mid-troposphere. The author suggests that the southern circulation is connected to warm and dry air masses originating from the interior of the continent.
Amongst other effects, convective events in this Germany or elsewhere can even produce
tornadoes in rare cases (e.g. Dotzek et al. (2003), Rauhala & Schultz (2009)). These
appear very seldom in comparison to within the United States.
14 2 Scientific background
2.3 Rainfall properties of events
Extreme rainfall events including extreme convective rainfall events can be identified using statistical methods. Such has been performed in a huge number of studies (e.g.
Anagnostopoulou & Tolika (2012); Früh et al. (2010); Zolina et al. (2005)). Based on different techniques, convective precipitation in such extreme events has been identified, investigated, and sometimes quantified. The identification techniques of convective pre- cipitation can involve other phenomena of convective events such as lightning (e.g. Gaál et al. (2014), Rulfová & Kyselý (2013)) or are based on the precipitation measurements itself (Llasat (2001)).
A phenomenon typical for all extreme convective events is intense local precipitation typically on short time periods. There have been efforts to identify convective precipita- tion into a convective and large scale precipitation component. For example the study of Llasat (2001) accumulated precipitation over different time scales. Llasat (2001) com- pared short term aggregated rainfall intensities (episodes of 5min aggregated precipita- tion exceeding a certain intensity threshold) and long term totals to identify convective events. The ratio between the time window is called convectivity index with a threshold of this index used to define a convective rainfall event. Similarly, Casas et al. (2004) used four different aggregation times to characterize the events. It was found that rain- fall in the western Mediterranean area with a return period of more than 5 years can be assigned to four clusters: intense on short durations only, intense on mesoscale dura- tions only, intense on 12-24hs durations and intense on all durations within the event.
Pinto et al. (2013) performed a spatial aggregation of events defined from rainfall an- nual maxima at individual rain gauges. They used a cluster analysis based on different aggregation time periods. They found that the most intense events were characterized by extreme precipitation on all time scales up to 24 h, while the event clusters of moderate (daily) intensity could be distinguished with respect to the role of short- and long-lasting rainfall.
An alternative approach to the identification of convective events based on rainfall para-
meter properties only was presented by Rulfová & Kyselý (2013). They disaggregated
precipitation based on synoptic code for present weather available from reports at sta-
tions based on the WMO standard. They categorized the rainfall events into three major
groups: large-scale rainfall, convective rainfall and other. On this basis, they were able
to identify a positive trend in the amount of convective precipitation and in the number
2.3 Rainfall properties of events 15 of days with convective precipitation for the Czech Republic from spring to autumn over the period from 1982 to 2010. Their algorithm was able to disaggregate 95% of precip- itation amounts, while performing better for moderate to heavy precipitation amounts.
Additionally, they could obtain an improvement based on reports of cloud types, which is also part of the weather reports. They found convective precipitation to be domin- ant only in summer in the Czech Republic, while large-scale precipitation was found to be dominant at all stations from autumn to spring. Rulfová & Kyselý (2013) suggest that the increase of precipitation with altitude is mainly due to an increase of convect- ive precipitation. Another result of their study is that the proportion of convective and large-scale precipitation depends on the mean daily surface air temperature in summer, while this dependence is much weaker during the other seasons. A similar approach by Eggert et al. (2015) disaggregated rainfall based on cloud observations only. Using a high resolution rainfall radar based dataset with a 1km resolution for Germany, they investigated the temporal and spatial scales of extreme precipitation. By aggregating rainfall on different temporal and spatial scales, they found that large-scale precipita- tion can be well characterized even when only data with coarse temporal resolution are available. For convective rainfall events, a characterization requires highly resolved data.
Spatially high resolved precipitation estimates from radar information can be used to identify convective extreme events. Such was performed by Llasat et al. (2007) us- ing weather observations for the adjustment of the identification, in particular lightning.
Another application of such high resolved data has been introduced by Rigo & Llasat (2004), who developed a detection method of single/multiple cells within a convective system.
One phenomenon which can occur in the course of an intense convective event is light- ning. The study of Lang & Rutledge (2002) found the lightning frequency to increase with the kinematic intensity of convection and the updraft volume, which was estim- ated based on sounding data. The electric impulse caused by a lightning strike can be measured, its position triangulated at a resolution of few hundred meters and its intensity obtained from the signal strength (e.g. Inan et al. (1996), Betz et al. (2007), Betz et al.
(2009)). Investigating convective extreme rainfall events in Czech republic, Gaál et al.
(2014) found a threshold of the 10-minute precipitation intensity, which is required to
predict lightning occurrences. According to their results, the identified thresholds agree
irrespective of the event frequency. They suggest that the event set of intense summer
storms is characterized by high correlation coefficients between parameters describing
16 2 Scientific background the main storm properties. Additionally, they found that a high percentage of the events can be considered as strongly convective with regards to the convectivity index of Llasat (2001)). Thus, it can be concluded that observations of rainfall intensity on short time scales can be used to estimate convective extreme events associated with lightning. A similar approach to estimate convective extreme convent occurrences is conducted in this study, but is based on the spatial distribution for one time point rather than the temporal evolution at a single observation site.
2.4 Fronts
As outlined in chapter 2.1.2, fronts can induce vertical movement of air, and thus con- stitute a physical process able to induce convective events, which in turn can enhance the weather events associated with the front. Convergence lines, which appear relatively frequently ahead of a cold front, are also associated with vertical movement leading to convective events. Over Germany, frontal systems appear more often during winter (e.g. Kunz (2007)). If convective cells develop under these conditions, they are usually aligned along the fronts or convergence lines. Previous studies have compared rainfall statistics of precipitation particularly considering the influence of fronts (e.g. Papritz et al. (2014); Catto et al. (2012)), revealing that a large number of intense precipitation events are associated with atmospheric fronts.
Fronts can be identified at the surface from changes in temperature, humidity, wind dir- ection or wind speed. Margules (1906) assumed the front to be a surface without volume.
In reality, the variables affected by the front do not change suddenly. The front has a ho- rizontal extension in which variables such as temperature or dew point, wind-speed or direction change. In addition, the air density does not only change due to different tem- peratures of the two air masses but also due to their humidity. Thus, it is possible that some changes usually associated with fronts do not appear under certain conditions. An example is the so called masked cold front.
Most weather services analyse fronts subjectively. In this process, there are weather ser-
vice specific rules. The German weather service is more frequently analysing frontal
features with small horizontal extension as the British Met Office which prefers long
interconnected fronts. The Met Office relatively often identifies sequences of closely
neighbouring fronts. The choice of the German weather service to emphasize the 850hPa
level (DWD (2015)) rather than considering the surface parameters follows the sugges-
2.4 Fronts 17 tion by Kurz (1990) originally meant as a recommendation to use the wind direction in 850hPa as an indicator for the position of the surface front in cases as the masked cold front. This level is located above the planetary boundary layer (PBL) and typically reveals strong horizontal gradients in equivalentpotential temperature and wet potential temperature at the fronts. Multiple procedures for an objective identification of fronts have been developed using various different parameters. Hewson (1998) used different predominantly temperature- and humidity-based parameters to obtain fronts, Simmonds et al. (2011) uses the change in wind direction. In addition, the mathematical procedure applied for front identification has huge impact on the shape and length of the identified structures (see Hewson (1998)). Berry et al. (2011) used a nearest neighbour algorithm and applied a front length filter. The resulting highest front frequencies are found over the ocean in the mid-latitudes storm tracks and are co-allocated with maxima of cyc- lonic vorticity centres. The same authors found cold fronts in the mid-latitudes to appear more often further north than warm fronts. With respect to precipitation, they found that frontal systems/front segments without precipitation appear with different frequencies in different regions of the world. While over oceanic regions less than 40% of grid points close to a front have no rainfall, in South Africa and Australia more than 70% are dry.
2.4.1 Contribution of fronts to convective events
At cold fronts, an increased number and intensity of accompaniments of convective events could be identified, i.e. precipitation (e.g. Papritz et al. (2014)), hail (e.g.
Browning & Harrold (1970)), gusts (e.g.Chromow (1942)), and lightning (e.g. Zhou et al. (2002)). A particular effect is that atmospheric fronts are often associated with in- tense precipitation, and impact the local distribution of rainfall in space and time (Catto et al. (2012)). In this study, in particular the major role of fronts in heavy precipit- ation events is of importance. For instance, Catto & Pfahl (2013) found on average 51% of global precipitation extremes to be associated with fronts, with 75% in the mid- latitudes and 31% in the sub-tropics. By combining an objective front analysis and satellite based global precipitation data, Catto et al. (2012) confirmed the importance of fronts to the precipitation climatology in the mid-latitudes, while the importance dif- fers amongst oceanic and continental regions. While in the major oceanic storm tracks over 90% of the annual rain comes from fronts, over parts of the Northern hemisphere continents 30% of the precipitation comes from warm fronts during most of the year.
They also state that in a warming climate, the proportion of precipitation associated to
fronts could change due to a shift of the storm tracks. Heavy convective precipitation is
often associated to cold fronts. Browning et al. (1975) separated the regions relative to
18 2 Scientific background
a cold front into 3 regions: pre-frontal, at the surface cold front, and post-frontal. They
found the orographic effects behind the front to be well defined, but rather slight. At
the surface front heavy precipitation appeared regardless of topography, while ahead of
the front, orographic effects vary from small to very large, depending on the presence of
the ’seeder-feeder’ effect. Wilby et al. (1995) highlighted the added value of subdivid-
ing daily rainfall data sets by frontal influence, while frontal activity may be just one
amongst several relevant processes affecting rainfall probabilities. Summarizing fronts
have an important role in the precipitation climatology by impact on the atmospheric
dynamics. Consequently, rainfall properties differ from frontal influenced situations to
non-frontal situations. On an event basis, for Germany, a cold frontal case and another
convective situation were compared by Weijenborg et al. (2015). Their study analysed
small scale PV structures of convective systems. They found the PV structure to be or-
ganized and vertically tilted. The PV structure of the cold front was found to interact
with the PV structures of the cells and also to favour the generation of new convection
cells.
3 Data
Several data sources have been applied for different purposes in the context of the iden- tification and quantification of extreme convective events (table 3.1). The different data- sets are introduced in detail in the following.
Data period purpose
Radiosoundings 2001-2015 Validation of stability indices from reanalysis
Reanalysis 1979-2015 Identification of fronts; computation of stability indices;
training and validation of regression model Radolan dataset 2005-2014 Training and validation of regression model
Station data 2000-2010 convective event-dataset Lightning dataset 2007-2014 convective event-dataset ESWD 1979-2014 convective event dataset
Table 3.1:List of datasets applied in this study, the available time period, and their purpose.
3.1 Station data
The synoptic station data, which satisfies the standard of the world meteorological or-
ganisation (WMO) and has been archived by the Spanish weather service, is used in this
study for the identification of convective events. The data is provided on the OGIMET-
website (www.ogimet.com). The dataset consists of synoptic data like temperature, dew
point, cloud cover, wind strength, wind direction, precipitation amount, and reported
weather phenomenon during the past six, three, and one hour. Only the weather phe-
nomenon has been used in this study. The weather phenomenon can be one of 100
different types, such as light drizzle, lightning, heavy shower, providing a detailed pic-
ture of the observed weather. A detailed list can be found in the manual of codes of
20 3 Data WMO (1974).
3 4 5 6 7 8 9 10 11 12 13 14 15 16 45
46 47 48 49 50 51 52 53 54 55 56 57
1000 2000 3000 4000 5000 6000 7000 8000 9000 10000 11000 12000 13000 14000 15000 16000 17000
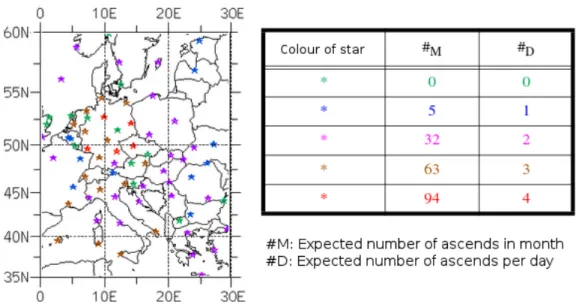
Figure 3.1:German weather stations in the OGIMET database. The colour indicates the number of weather reports within the period of 2000 to 2010.
Within this study, 292 German weather stations were considered. Figure 3.1 shows the location of German weather stations, which measured in the period of 2000 to 2010, and their data coverage for this period. The measurements are performed at most stations at 0,6,12, and 18 UTC. The number of reports in the period differs between the stations.
Stations with availability of about 90% of the period 2000-2010 (marked by red colours
in Figure 3.1) are relatively homogeneous scattered all over Germany. Stations, which
cover less than 50% for this period, are shown in blue colours in Figure 3.1 and also
distributed over entire Germany.
3.1 Station data 21
code reported weather
25 rain showers in past hour, currently no prec.
26 snow showers in past hour, currently no prec.
27 graupel or hail showers in past hour, currently no prec.
29 thunderstorm in past hour, currently no prec.
80 light rain showers
81 moderate or intense showers 82 very intense rain showers 83 light sleet showers
84 moderate or intense sleet showers 85 light snow showers
86 moderate or intense snow showers 87 light graupel showers
88 moderate or intense graupel showers 89 light hail showers
90 moderate or intense hail showers
91 thunderstorm in last hour, currently light rain
92 thunderstorm in last hour, currently moderate or intense rain
93 thunderstorm in last hour, currently light snow/snow and rain/graupel/hail
94 thunderstorm in last hour, currently moderate/intense snow/snow and rain/graupel/hail 95 light or moderate thunderstorm including rain or snow
96 light or moderate thunderstorm including graupel oder hail 97 intense thunderstorm with rain or snow
98 intense thunderstorm with sand storm 99 intense thunderstorm with graupel or hail
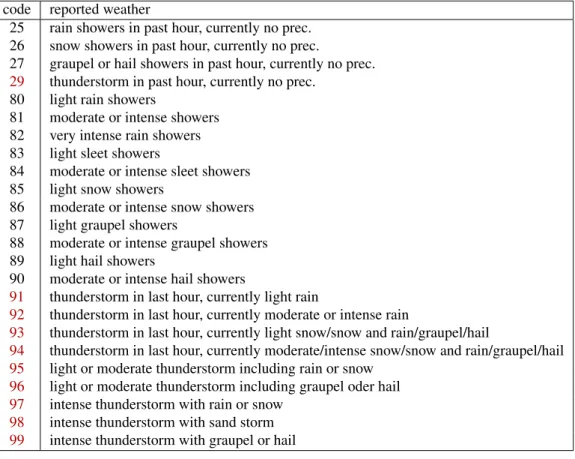
Table 3.2:List of reported weather codes which have been assigned to the group of convective events.
Thunderstorm events are marked in red.
For this study, the dataset was post-processed manually to correct the most obvious digitalization errors (e.g. wrong format) and in some cases, where the decoding was not possible, the corresponding records have been removed from the database. The reported weather phenomenon of the past hour is used within this study to characterize rainfall types. Primarily, convective rainfall situations are of interest, but also large-scale rainfall is important for comparison purposes. Hence, the reported weather phenomena are clustered in different groups:
• convective rainfall
• large-scale rainfall
• other
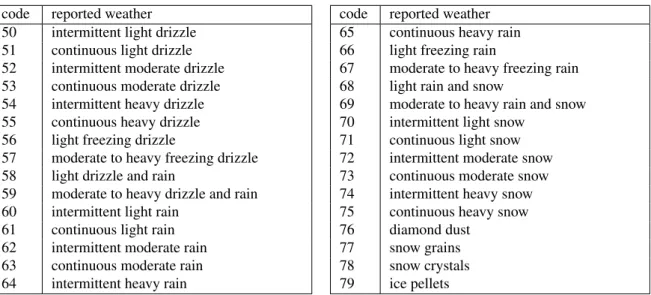
The members of the two first groups are listed in table 3.2 and 3.3. For parts of this
study, lightning events, which is a subgroup of convective events, are regarded separ-
ately. The weather phenomena reports can be used to analyse the seasonal cycle of
convective events purely based on observations. However, these observations are sub-
jective and have their limitations.The fraction of reported thunderstorms as coded in the
22 3 Data
code reported weather 50 intermittent light drizzle 51 continuous light drizzle 52 intermittent moderate drizzle 53 continuous moderate drizzle 54 intermittent heavy drizzle 55 continuous heavy drizzle 56 light freezing drizzle
57 moderate to heavy freezing drizzle 58 light drizzle and rain
59 moderate to heavy drizzle and rain 60 intermittent light rain
61 continuous light rain 62 intermittent moderate rain 63 continuous moderate rain 64 intermittent heavy rain
code reported weather 65 continuous heavy rain 66 light freezing rain
67 moderate to heavy freezing rain 68 light rain and snow
69 moderate to heavy rain and snow 70 intermittent light snow
71 continuous light snow 72 intermittent moderate snow 73 continuous moderate snow 74 intermittent heavy snow 75 continuous heavy snow 76 diamond dust
77 snow grains 78 snow crystals 79 ice pellets
Table 3.3:List of reported weather codes which have been assigned to the group of large-scale events.
Figure 3.2:ratio of lightning reports for winter (left) and summer (right) for each OGIMET station indic- ated by its colour (see legend).
synoptic reports (ww=29 or ww=9X) is depicted for the whole of Europe in Figure 3.2 for both, summer and winter half years. The number of thunderstorm events is higher in summer in comparison to winter. Within this study, the reported weather phenomena have been used to identify convective situations based on observations.
3.2 Radiosounding data
Radiosoundings of German stations are used in this study for validation purposes. The
stations are maintained by the German weather service (DWD). Radiosondes provide a
vertical picture of the atmospheric layering by ascending probes with weather balloons
(radiosondes). The radiosondes measure, among other atmospheric variables, temperat-
ure and dew points at different heights.
3.3 Lightning data 23 In this study, data for the period from 2001 to 2015 is used. Radiosondes are ascended at some German stations regularly, for every 6, 12 or 24 hours. A map of the stations in Germany and nearby countries performing these weather balloon ascents is depicted in Figure 3.3.
Figure 3.3:Radiosounding stations in Europe. The colour code identifies the frequency of measurements.
This map has been compiled by Volker Ermert.
The atmospheric stability is calculated based on the radiosounding data in this study as a reference. The stability and the measured humidity obtained from the radiosoundings are used to validate those retrieved from the later introduced reanalysis dataset.
3.3 Lightning data
Lightning is a phenomenon, which appears only in strong convective cells and under particular conditions, like a particular temperature at a certain height. A dataset of light- ning information over Germany from Nowcast GmbH is used in this study. It contains highly resolved lightning positions, intensity [kA] and time. The data covers the period 2007 to 2014.
Lightning positions are obtained by triangulation (see http://www.nowcast.de). A station network measures the electromagnetic wave, which is produced by a lightning strike.
Since the propagation speed of an electromagnetic wave is the speed of light, the po-
sition is triangulated based on the time differences of the signal arriving at different
24 3 Data stations. These stations (part of the so-called LINET network) have a spacing of 150 to 250km. Based on the amplitude of the signal, the lightning intensity can be obtained.
The network of the nowcast GmbH is able to distinguish amongst intra-cloud strikes and cloud-to-ground strikes (see www.nowcast.de). The basic concept is that the signal of a cloud-to-ground strike origins closer to the surface. Hence, it reaches a station faster in comparison to the signal of a intra-cloud strike. These differences in runtime allow the LINET network to distinguish both types of lightning strikes.
The lightning dataset is used in this study to define a subset of intense convective situ- ations. In particular, a situation at a location is regarded convective, if the closest light- ning position undercuts a certain distance.
3.4 ESWD database
Several reports of different observed extreme weather phenomena are provided in the
’European severe weather database’ (www.eswd.eu). This project is carried out by the European severe storms laboratory (ESSL, Dotzek et al. (2009)). Reported phenomena are tornadoes, severe winds, large hail, heavy rain, funnel clouds, dust devils, ice accu- mulation, damaging lightnings, and avalanches. The event report includes location and time. The available dataset covers the period from 1979 to present. Within this study, we focus on reports in Germany.
The reports are collected from hydrometeorological services, voluntary observer net- works (Skywarn and Ketaunos), and public. Hence, event reports need to undergo a quality check to be validated. The database has different subsequent levels for the qual- ity control reaching from ’as received’ to ’event fully confirmed’. This ensures that even though a report is not necessarily reliable, it appears within the database and may reach a higher level of event confirmation due to later reports to the database. Within this study, only information for extreme convective events have been taken into account. These are hail, extreme precipitation, and tornadoes. Although these phenomena are not always related, it is not distinguished between these within this study. Summarizing, this data- set can provide a good basis for damaging, intense convective events.
In this study, this dataset defines an alternative subset of convective extreme events. Like
for the lightning dataset, a situation was regarded convective, if the closest lightning
position undercuts a certain distance.
3.5 Radolan data 25
3.5 Radolan data
The ’Radar-Online-Aneichung’ (Radolan) data is provided by the German Weather ser- vice (DWD). This dataset contains gridded precipitation data, which is based on radar reflectivity fitted to measurements. The dataset has a spatial resolution of 1km x 1km and covers the area of Germany (area within circles around radar stations in Figure 3.4 a). It is provided in different temporal resolutions ranging from 1h to 24 hours. The product version (RW) with 1h-ly resolution is used here for the period from 2005 to 2014. The database is continuously being updated.
Figure 3.4:(a) Radar stations and (b) Regional distribution of the rain gauges (source:Weiglet al. (2004))