The source and fate of mitochondrial DNA mutations using high-sensitivity next-
generation sequencing technologies
INAUGURAL-DISSERTATION zur
Erlangung des Doktorgrades
der Mathematisch-Naturwissenschaftlichen Fakultät der Universität zur Köln
vorlegt von MARITA ISOKALLIO
aus Huittinen
Berichterstatter: Dr. Dario Valenzano Prof. Dr. Andreas Beyer
Tag der mündlichen Prüfung: 14.12.2017
”It's a dangerous business [...] going out your door.
You step onto the road, and if you don't keep your feet, there's no knowing where you might be swept off to.”
J.R.R. Tolkien
”Science [...] is made up of mistakes, but they are mistakes which it is useful to make,
because they lead little by little to the truth.”
Jules Verne
TABLE OF CONTENTS
I ABBREVIATIONS IV
II ZUSAMMENFASSUNG VI
III ABSTRACT VIII
1 REVIEW OF THE LITERATURE...1
1.1 Mitochondrial genetics and disorders...1
1.1.1 Mitochondria...1
1.1.2 Mitochondrial disorders...6
1.1.3 Models for mitochondrial DNA mutation research...8
1.1.4 Mitochondrial DNA variant detection by traditional methods...9
1.2 Deep sequencing technology overview...12
1.2.1 Sequencing library and cluster generation...13
1.2.2 Long-read sequencing technologies...15
1.2.3 Short-read sequencing technologies...16
1.2.4 Key sequencing data analysis steps and their potential artefacts...18
1.2.5 Other artefacts...22
1.3 Recent high-sensitivity variant detection methods...23
1.3.1 PELE-Seq...23
1.3.2 Circle sequencing...24
1.3.3 Unique molecular identifiers...25
1.3.4 Summary...27
1.4 Mitochondrial DNA variant detection by deep sequencing...28
1.4.1 Nuclear sequences of mitochondrial origin – NuMTs...28
1.4.2 Indirect and capture-enriched mitochondrial DNA sequencing methods...29
1.4.3 Amplification-based mitochondrial DNA enrichment and sequencing...30
1.4.4 Traditional mitochondrial DNA enrichment and sequencing...33
1.4.5 Other mitochondrial DNA enrichment strategies for sequencing...34
1.5 Data analysis approaches for mitochondrial DNA variant detection...35
I
2 PROJECT AIMS...38
3 MATERIALS AND METHODS...39
3.1 Experimental animals...39
3.1.1 Animals for optimization of the methods...39
3.1.2 Animals for creating the variant profile of the entire mitochondrial genome...40
3.1.3 Animals for studying purifying selection and mitochondrial RNA processing...40
3.2 Mitochondria isolation and DNA extraction protocols...41
3.2.1 Gradient centrifugation methods...41
3.2.2 Mitochondria isolation kit...43
3.2.3 mtDNA-seq...44
3.3 Genomic DNA extraction...45
3.4 Total RNA extraction...45
3.5 Mitochondrial DNA cloned into a plasmid backbone, pAM1....46
3.6 Amplicon PCR...46
3.6.1 Amplicon PCR without tagged primers...46
3.6.2 Amplicon PCR with tagged primers...48
3.7 Rolling circle amplification...49
3.8 Illumina HiSeq library preparations and sequencing...49
3.8.1 Illumina HiSeq DNA-seq...49
3.8.2 Illumina HiSeq RNA-seq...50
3.9 Sequencing data analysis...51
3.9.1 Analysis of mtDNA-seq data...51
3.9.2 Analysis of pAM1 data...52
3.9.3 Analysis of amplicon sequencing data...52
3.9.4 Analysis of RNA-seq data...53
3.10 Post-processing of the variant calling results...53
3.10.1 Variant loads...53
3.10.2 Spike-in sample comparisons...54
3.10.3 DNA and RNA variant comparisons...55
3.11 Rodent sequence alignment...55
3.12 Statistics, plots and code availability...56
4 RESULTS AND DISCUSSION...57
4.1 Optimization of the mitochondrial DNA extraction method...57
4.2 Selection of the sequencing method for low-frequency mitochondrial DNA variant detection...66
II
4.2.1 Optimization of the data analysis steps suitable for circular
mitochondrial DNA genome...67
4.2.2 Selection of the mitochondrial DNA enrichment and sequencing method...77
4.2.3 Validation of the method for low-frequency mtDNA variant detection...95
4.2.4 Discussion...100
4.3 Mitochondrial biology research questions addressed by mtDNA- seq...103
4.3.1 Creation of variant profile of the entire mitochondrial genome and identification of regions essential for replication and replication-associated transcription...103
4.3.2 Clarification of developmental stage and mechanism of purifying selection of mitochondrial DNA...122
4.3.3 Effects of mitochondrial DNA variants on mitochondrial RNA processing...132
5 CONCLUSIONS AND FUTURE PROSPECTS...137
5.1 Optimization of the mitochondrial DNA extraction and sequencing method for extremely low-frequency mitochondrial DNA variant detection...137
5.2 Mitochondrial biology research questions addressed by mtDNA- seq...144
5.2.1 Creation of variant profile of the entire mitochondrial genome and identification of regions essential for replication and replication-associated transcription...144
5.2.2 Clarification of developmental stage and mechanism of purifying selection of mitochondrial DNA...147
5.2.3 Effects of mitochondrial DNA variants on mitochondrial RNA processing...148
5.2 Summary...150
6 REFERENCES...151
APPENDIX...163
ACKNOWLEDGEMENTS...173
ERKLÄRUNG...174
LEBENSLAUF...175
III
I ABBREVIATIONS
AF Allele frequency
CP Codon position
CRT Cyclic reversible termination
CSB I–III Conserved sequence blocks 1, 2 and 3
CsCl Cesium chloride
D-loop Triple-stranded structure at mtDNA control region
dsDNA Double-stranded DNA
E7.5, E14 Embryonic day 7.5 or 14
EDTA Ethylenediaminetetraacetic acid
ETAS I–II Extended termination associated sequences 1 and 2
EtBr Ethidium bromide
ExoV DNA exonuclease V
F1 Founder mouse of a female mouse lineage,
MKO genotype
F1 score Harmonic mean of precision and sensitivity
FP False positive variant
gDNA Genomic DNA (including both nuclear and
mitochondrial DNA)
HSP Heavy-strand transcription promoter
H-strand Heavy-strand of mtDNA (based on GC- content)
LSP Light-strand transcription promoter
L-strand Light-strand of mtDNA (based on GC- content)
MKO Hemizygote mtDNA mutator mouse,
genotype PolgA
D275A/KOmtDNA Mitochondrial DNA
mtDNA-seq The optimized mtDNA enrichment and sequencing approach
MTERF1 Mitochondrial transcription termination factor 1
IV
mtRNA Mitochondrial RNA
NCR Non-coding region, mtDNA control region
N1, N2, N3 F1 female offspring lines, carry mtDNA variants, WT genotype
nDNA Nuclear DNA
NuMTs Nuclear sequences of mitochondrial origin
NZB Wild-type mouse carrying mtDNA from NZB
mouse
OriL, OriH Origin of replication of light- (L) and heavy- (H) strand of mtDNA
pAM1 The entire mtDNA cloned into pACYC177-
vector backbone
PCS Post-PCR cloning and sequencing
PGC Primordial germ cell
POLG Mitochondrial DNA polymerase γ
PolgA Mitochondrial DNA polymerase γ catalytic subunit A
POLRMT Mitochondrial RNA polymerase
pp Percentage points
PPV Positive predictive value, precision
R1, R2 Read 1 and read 2 obtained by paired-end sequencing
RCA Rolling circle amplification (multiple displacement amplification)
RMC Random mutation capture
SD Standard deviation
smPCR Single-molecule PCR
SNA Single nucleotide addition
ssDNA Single-stranded DNA
TFAM Mitochondrial transcription factor A TFB2 Mitochondrial transcription factor B2
TP True positive variant
TPR True positive rate, recall, sensitivity TWINKLE Replicative mitochondrial helicase
UMI Unique molecular identifier
WT Wild-type mouse, genotype PolgA
WT/WTII ZUSAMMENFASSUNG
Pathogene Mutationen in der mitochondrialen DNA (mtDNA) sind dafür bekannt, mehrere Erbkrankheiten zu verursachen. Aufgrund fehlender Methoden zur transgenen Manipulation der mtDNA ist es kaum möglich, die mtDNA Sequenzen und Funktionen zu untersuchen.
Die mtDNA-Mutator-Maus wird als Sättigungsmutagenese-Modell verwendet, um eine hohe Variantenbelastung innerhalb der mtDNA zu erzeugen. Bisher wurde bei diesem Modell gezeigt, dass der OriL essentiell für die mtDNA-Replikation ist und dass eine starke negative Selektion potentiell schädlicher mtDNA-Mutationen in der Keimbahn stattfindet. Traditionell wurden mtDNA-Mutationen anhand von Sanger- Sequenzierung oder Post-PCR-Klonierung und Sequenzierung nachgewiesen. Diese Methoden können allerdings nicht das gesamte mtDNA-Genom darstellen. Zudem sind sie aufwendig, teuer und nicht sensibel genug. Seit einigen Jahren werden Hochdurchsatz- Sequenzierungsverfahren als billigere Ansätze verwendet, um mtDNA- Varianten über das gesamte Genom zu detektieren. Allerdings werden diese, wegen ihrer hohen Fehlerrate, als ungeignet zum Detektieren von Varianten angesehen. Im Gegensatz dazu sind empfindlichere Hochdurchsatz-Sequenzierungsmethoden wie Duplex-Sequenzierung mit einem hohen Arbeitsaufwand verbunden, da sie eine umfangreiche Optimierung und eine hohe Sequenzierungstiefe erfordern. Dadurch erhöhen sich die Kosten auf ein unerschwingliches Niveau.
In dieser Arbeit werden verschiedene Mitochondrienanreicherungs- und Amplifikations-methoden untersucht, um mtDNA frei von nuklearer DNA-Kontamination anzureichern. Es wird eine Standard Illumina HiSeq Sequenzierung genutzt. Die Datenanalyse wird sorgfältig für das mtDNA-Genom optimiert, da dessen Eigenschaften sich von denen des Kerngenoms unterscheiden. Schließlich wird das optimierte mtDNA- Anreicherungs- und Sequenzierungs-protokoll, mtDNA-seq, unter Verwendung einer Titration von Spike-In Proben, welche bekannte mtDNA-Varianten besitzen, validiert. Mit mtDNA-seq ist es möglich,
VI
mtDNA-Varianten zuverlässig zu detektieren. MtDNA detektiert sogar Mutationen unterhalb einer Allelfrequenz von 0,05%. Dies ist etwa zehnmal niedrigerer als die allgemein angewandte Varianten- Nachweisgrenze.
Die optimierte mtDNA-seq wird angewendet, um noch offene mitochondriale Probleme zu adressieren. Es wird das Variantenprofil des gesamten mtDNA-Genoms erzeugt, wodurch mehrere komplette Mutations-Coldspots innerhalb von Kontrollbereichen der mtDNA entdeckt werden. Diese bisher unbeschriebenen Coldspots könnten potenzielle Regulationsorte für die mtDNA-Replikation und die replikations-assoziierte Transkription sein. Die molekulare Mechanismen hierfür sind bisher ebenfalls unbekannt. Zur Untersuchung der Entwicklungs-stufen und des Mechanismus der negativen Selektion wird die hemizygote mtDNA-Mutator-Maus verwendet, um mtDNA-Varianten in weibliche Linien zu isolieren. Da mtDNA-seq die Detektion extrem seltener mtDNA-Varianten ermöglicht, können neue Ergebnisse gewonnen werden, welche den bisherigen Wissensstand zur starken negativen Selektion in der N2- Generation von Mäusen erweitern. Die Ergebnisse deuten darauf hin, dass jede mtDNA-Variante zufällig auf die Nachkommen übertragen werden kann. Jedoch scheinen sich die schädlichsten Mutationen nicht klonal auszubreiten, nicht einmal in N1-Generation. Um die mtRNA- Verarbeitung zu verstehen, wird in einer Pilotstudie der amplicon- Sequenzierungsansatz verwendet. Ziel dieser Studie ist es, Allel- Mismatches zwischen mtDNA und mtRNA-Varianten zu detektieren und dadurch auf mögliche mtRNA-Verarbeitungsdefekte hinzuweisen.
VII
III ABSTRACT
Pathogenic mutations in mitochondrial DNA (mtDNA) are known to cause numerous inherited diseases. However, the lack of methods to transgenically manipulate the mtDNA limits the possibilities to learn about mtDNA sequence and function. The mtDNA mutator mouse is used as a saturation mutagenesis model to generate high variant load into mtDNA. With this model, it has been previously shown that, for instance OriL is essential for mtDNA replication or that strong purifying selection of potentially deleterious mtDNA mutations takes place in the germ line. Traditionally, mtDNA mutations have been detected by Sanger sequencing or post-PCR cloning and sequencing, which are unable to represent the entire mtDNA genome, and are laborious, expensive, or of low sensitivity. More recently, high-throughput sequencing methods have been utilized as cheaper approaches to detect mtDNA variants over the entire genome. However, the high error-rate of these technologies is considered as a limiting factor regarding variant detection sensitivity. On the other hand, high-sensitivity high-throughput sequencing methods, such as Duplex Sequencing, are often laborious requiring extensive optimization and high sequencing depth, ultimately raising the costs to a prohibitive level.
In this thesis, various mitochondria enrichment and amplification methods are explored in order to enrich mtDNA free from nuclear DNA contamination. Standard Illumina HiSeq sequencing is utilized and data analysis steps are carefully optimized to be suitable for mtDNA genome, which has characteristics very different from the nuclear genome.
Finally, the optimized mtDNA enrichment and sequencing protocol, mtDNA-seq, is validated utilizing a titration of spike-in samples harboring known mtDNA variants. With mtDNA-seq it is possible to detect mtDNA variants reliably even below allele frequency of 0.05 %, which is approximately ten times lower variant detection threshold than what has been generally applied in other studies.
The optimized mtDNA-seq is applied to address open mitochondrial
biology research questions. The variant profile of the entire mtDNA
genome is generated, and several complete mutational coldspots are
discovered at the control region of the mtDNA. These novel coldspots
are hypothesized to be potential regulation sites for mtDNA replication
and replication-associated transcription by as-yet-unknown molecular
mechanisms. To clarify the developmental stage and mechanism of
purifying selection, hemizygote mtDNA mutator mouse is utilized to
isolate mtDNA variants into female lineages. As it is possible to detect
extremely rare mtDNA variants by mtDNA-seq, these new results
expand the previous study showing strong purifying selection by N2
generation of mice. The results suggest that by chance any mtDNA
variant may be transmitted to the offspring, however, the most
deleterious mutations do not seem to clonally expand even in N1
generation mice. To understand the mtRNA processing, amplicon
sequencing approach is utilized in a preliminary study. The aim in this
study is to detect allelic mismatches between mtDNA and mtRNA
variants, which potentially indicate mtRNA processing defects.
1 REVIEW OF THE LITERATURE
1.1 Mitochondrial genetics and disorders
1.1.1 Mitochondria
According to the widely accepted endosymbiotic theory of the origin of mitochondria, mitochondria evolved from an α-proteobacterium engulfed by an archaeon (reviewed by Martin et al. 2015). The symbiotic relationship was thought to be based on the ability of the proteobacterium to efficiently produce ATP in exchange of carbohydrates produced by the host. Over the course of evolution, such symbiosis lead to formation of mitochondria – cell organelles, which are known as the powerhouses of the cell, but mitochondria also contribute to many other cell functions (reviewed by Nunnari & Suomalainen 2012). Mitochondria are dynamic in nature, forming a fusion-fission network, the steady state of which varies between different cell types: in cardiomyocytes, the network consists of connected tubular structures, which are distributed throughout the cell, whereas in oocytes mitochondria network is more localized as fragmented aggregates. Such a system requires delicate control of fusion, fission, positioning and motility, and it is enabling the cells to respond variable energy demands (reviewed by Labbé et al. 2014).
The energy production (i.e. oxidative phosphorylation system) is located
inside a double-membrane structure, in the inner membrane and
mitochondrial matrix. The respiratory chain is formed by four
respiratory complexes, coenzyme Q and cytochrome c, which receive
electrons from the citric acid cycle. The electrons go through a series of
reduction and oxidation reactions resulting in proton transfers across the
mitochondrial inner membrane. This proton gradient drives the ATP
production and is an essential part of mitochondrial function. The key
proteins required for oxidative phosphorylation are encoded in
mitochondrial genome (mitochondrial DNA, mtDNA, reviewed by
Larsson 2010). During their evolution, most of the original bacterial
genetic material has been transferred to the nucleus, and novel genes
required for mitochondrial function have evolved. Mitochondria still do harbor their own tightly packed circular mtDNA molecules (Fig. 2.1) – size of which varies from ~6 kb in Plasmodium falciparium to ~16 kb in mammals or even >200 kb in some plants (reviewed by Gray 2012).
The DNA strands of the mammalian mitochondrial genome can be categorized into heavy- and light-strands (H- and L-strand) according to their density separation, as H-strand is more G-rich than L-strand. H- strand is the sense strand for 12 proteins, the core components of the mitochondrial respiratory complexes, and the two rRNAs as well as 14 tRNAs required for mitochondrial translation machinery, whereas L- strand is the sense strand for only one protein and 8 tRNAs. The rest of the >1000 proteins required for oxidative phosphorylation, mtDNA replication and expression, mitochondrial protein synthesis, iron-sulfur cluster synthesis or other metabolic functions are encoded in the nuclear genome, translated in the cytosol and transported to mitochondria (Fig.
2.1, reviewed by Larsson 2010). This bi-genomic system requires well- coordinated expression of nuclear and mitochondrial genes.
The mitochondria network harbors thousands of mtDNA molecule copies. At a given time, a proportion of mtDNA molecules are naked, but most of them are packed into nucleoid structures (Farge et al. 2014).
The exact nucleoid composition is still a debated topic. Studies with
mouse embryonic fibroblasts (MEFs) suggest the nucleoid typically
consists of mitochondrial transcription factor A (TFAM) protein and a
single copy of mtDNA (Kukat et al. 2011). Approximately 1000 TFAM
proteins coat a single mtDNA molecule (i.e. one TFAM every ~16 bp
[(Kukat et al. 2011]), and TFAM can bind mtDNA in a single, co-
operative and cross-strand fashion in vitro (Kukat et al. 2015). Binding
of human TFAM to mtDNA is sequence specific at the promoter regions
but non-specific elsewhere (Fisher & Clayton 1988; Fisher et al. 1992),
and furthermore, human TFAM is shown to bend the mtDNA 180° (Ngo
et al. 2011; Rubio-Cosials et al. 2011). All these qualities explain the
capability of TFAM to efficiently compact the mtDNA molecule into a
nucleoid structure of ~100 nm in size (Kukat et al. 2011).
Figure 2.1. Mitochondrial function and genome. Mitochondria are cell organelles, which consist of outer and inner membranes
(OM and IM) enclosing inter-membrane space (IMS) and forming the inner matrix of mitochondria. Mitochondria produce ATP by
oxidative phosphorylation, which is dependent on proteins encoded in nuclear genome (nDNA) as well as in mitochondrial genome
(mtDNA). Approximately >1000 proteins are synthesized in the cell cytoplasm (pink and light green) and imported to mitochondria
not only for oxidative phosphorylation but also for other mitochondrial functions e.g. iron-sulfur cluster synthesis, cell signalling and,
of course, for mtDNA maintenance, such as compacting mtDNA into nucleoids (orange proteins) or mtDNA replication and
transcription (light green proteins). Only 13 proteins are encoded in mtDNA, and they are essential parts of the respiratory complexes
(components of each complexes are denoted with different colors: complex I, ND1–6, purple; complex III, CYTB, orange; complex IV,
CO1–3, green; complex V, ATP6 and 8, yellow). Furthermore, mtDNA encodes the two rRNAs and 22 tRNAs required for
mitochondrial translation. The base composition of mtDNA is biased, and the different strands are called as heavy- and light-strands
(H- and L-strands) according to their densities. Both strands harbor their own origin of replication (OriH and OriL) as well as
transcription promoters (LSP and HSP). The densly packed mtDNA contain only one major non-coding region (NCR) also known as
control region. The illustration is based on Gustafsson et al. (2016).
Others have additionally suggested the nucleoid to contain also mtDNA replication proteins (e.g. mitochondrial DNA polymerase γ (POLG), mitochondrial single-stranded DNA binding protein (mtSSB), mitochondrial helicase TWINKLE as well as mitochondrial inner membrane proteins) (reviewed by Gilkerson 2009). This is suggested to hold the nucleoid tethered to the inner membrane rather than freely floating nucleoids, providing a possible model how mtDNA and nucleoids are segregated between the dynamic network of mitochondria and to the daughter organelles (Gilkerson 2009). In line with this, mitochondria and endoplasmic reticulum interact at certain contact sites which direct mitochondrial division and nucleoid segregation (reviewed by Labbé et al. 2014). Moreover, the level of mtDNA compaction into nucleoids may function as a regulator for mtDNA replication and transcription (Farge et al. 2014).
Different from nucleus of the same cell, mtDNA are replicated through a
relaxed replication process independent from the cell cycle. Despite a
relatively low error rate of POLG, 5.6x10
-7mut/bp/doubling (Zheng et
al. 2006), each mtDNA molecule will go through many more rounds of
replication, which increases the probability of variant-harboring mtDNA
copies and higher per gene substitution rate in comparison to nuclear
DNA (nDNA). Different mtDNA molecules, harboring distinct variants,
can simultaneously exist within a cell – a condition called as
heteroplasmy. Through vegetative segregation, variable proportions of
mitochondria harboring different mtDNA molecules may end up to the
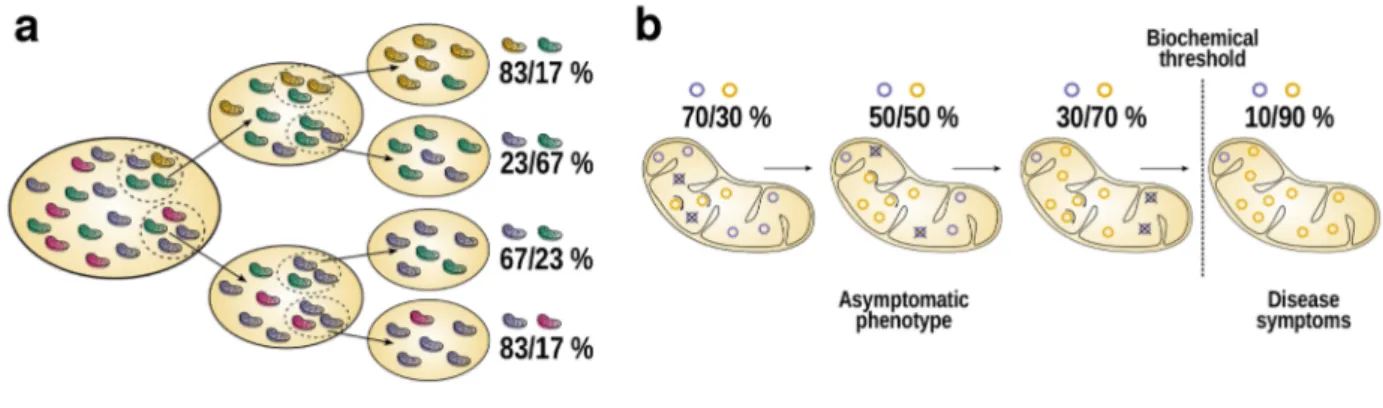
daughter cells (Fig. 2.2a). It has been also shown in silico that random
drift may drastically shift the levels of different mtDNA molecules
during the life time of a human being when some mtDNA molecules are
clonally expanded and others are not (Chinnery & Samuels 1999,
Fig. 2.2b). According to their model, it is an effective factor in avoiding
a pathogenic allele from fixing (i.e. becoming homoplasmic), however,
rare variants may also expand to relatively high levels. If the relative
level of a pathogenic mtDNA mutation frequency reaches a critical
biochemical threshold, defects in mitochondrial function can be detected
(Fig. 2.2, Durham et al. 2007). Moreover, if the functional defect is
compensated by more mtDNA replication, relative levels of wild-type mtDNA molecules may drop, by chance, even more (Chinnery &
Samuels 1999).
1.1.2 Mitochondrial disorders
It can be easily understood that disruptions at any level of such complex systems as mitochondria, can have severe consequences. Indeed, mitochondrial dysfunction is associated with variety of heterogenous, inherited human disorders as well as common diseases such as neurodegenerative disorders or metabolic syndromes (Nunnari &
Suomalainen 2012). In United Kingdom, it has been estimated that one in 4300 adults are affected by mitochondrial disorders, making them one of the most common group of inherited neurological disorders (Gorman et al. 2015). Furthermore, even one in 200 healthy individuals are estimated to be carrier of certain pathogenic mtDNA mutations (Elliott et al. 2008).
Pathogenic mutations or deletions in nuclear genes encoding
mitochondrial proteins are known to cause of several mitochondrial
disorders, such as mutations or deletions in Polg causing progressive
external ophthalmoplegias (PEO, van Goethem et al. 2001). These
nuclear-gene derived disorders follow Mendelian rules and are relatively
well known, however a typical characteristic for a mitochondrial
disorder is that the exact same mutation may cause variable symptoms
or onset ages between individuals. Disorders caused by mtDNA
mutations or deletions are even more complex than the ones of
chromosomal origin. The transmission of mtDNA in mammals is solely
maternal and the multicopy nature and variable levels of mutation
present in the mtDNA molecules further complicate the interpretation of
the relationship between the mutation and the disorder symptoms of an
individual. For example, myoclonic epilepsy and ragged-red fiber
disease (MERRF) is caused by a mutation in mt-tRNA Lys (K) and
although the relative mutation frequency mostly correlates with the
phenotype, the disease onset age varies and as little as 15 % presence of
Figure 2.2. Vegetative segregation and relaxed replication. As a mitochondrion harbors thousands of mtDNA molecules, it is likely that some of them harbor variants. Thus, a cell may carry normal and mutated mtDNA molecules, a condition called as heteroplasmy.
During cell division, mitochondria are divided to daughter cells through vegetative segregation (a). Each daughter cell may then contain very variable proportions of different mtDNA molecules. Furthermore, mtDNA molecules go through constant turnover, i.e.
relaxed replication (b), and no mechanism exist to ensure each molecule is replicated. Thus, proportion of different mtDNA molecules
may rapidly shift over time. If a pathogenic mtDNA mutation reaches high levels (past a biochemical threshold), disease symptoms
occur due to defects in respiratory chain system. The illustration is based on Stewart & Chinnery (2015).
wild-type mtDNA molecules was enough for one individual to escape disease symptoms (Shoffner et al. 1990). On the other hand, a single mutation on mt-tRNA Leu (L1) can appear as different disorders:
mitochondrial encephalopathy lactic acidosis and stroke-like episodes (MELAS), maternally inherited deafness and diabetes (MIDD), and progressive external ophthalmoplegia (PEO, Nesbitt et al. 2013). This variability makes clinical genotype-phenotype assessments very difficult for novel pathogenic mtDNA mutations. Moreover, it challenges the understanding of the mechanistic details of the disease progression.
Severity and the onset of a mitochondrial disorder may directly be affected by the segregation of heteroplasmic mtDNA molecules to daughter cells, or via germ line to the offspring. Although, random drift is the most dominant factor, selection of certain mtDNA molecules, even if harboring a phenotypically neutral variant, has been shown to take place in a tissue- or mutation-specific manner in somatic cells (e.g.
Jenuth et al. 1997; Pyle et al. 2007). How exactly replication of certain mtDNA molecules, mtDNA compaction into nucleoids, nucleoid clustering or dynamic fusion-fission network affect the segregation or turnover of different mtDNA molecules is still not fully understood (reviewed by Jokinen & Battersby 2013).
1.1.3 Models for mitochondrial DNA mutation research
There are no curative treatments available for mtDNA disorders. The
current approaches only aim to maintain the health of the patient, and
recently also to avoid inheritance of pathogenic mtDNA mutations by
mitochondrial replacement therapies or preimplantation diagnostics
(Poulton & Bredenoord 2010, Chinnery et al. 2014). In contrast to
nuclear genome, studies on mtDNA variants are extremely difficult
since there is no method for mitochondrial reverse genetics in vivo to
study and confirm genotype-to-phenotype causation (reviewed by
Patananan et al. 2016). To study different mtDNA disorders, the solution
has been to utilize variety of mouse models, which are generated by
direct introduction of existing mtDNA mutations by cytoplasmic fusion
strategy or indirectly by modifying the nuclear genes which can affect
the mtDNA composition, such as Polg or Twinkle (reviewed by Tyynismaa & Suomalainen 2009).
The most relevant mouse model to this thesis is the mtDNA mutator mouse (Trifunovic et al. 2004; Kujoth et al. 2005). Trifunovic et al.
(2004) created a homozygote knock-in mouse expressing proof-reading deficient POLG, in which the critical aspartate residue of exonuclease domain in PolgA was replaced with alanine (PolgA
D257A). These mice showed normal replication efficiency, but the exonuclease activity was significantly reduced (Trifunovic et al. 2004) showing a mtDNA- specific mutation load of 6.6x10
-4mut/bp (~40x the background mutation rate, Ross et al. 2013) as well as notable amount of truncated, linear mtDNA molecules (Trifunovic et al. 2004, Macao et al. 2015).
After ~25 weeks of age, these mice begin to show ageing symptoms like kyphosis, alopecia, decreased body fat, osteoporosis, anemia, and reduced fertility. Moreover, their median lifespan is only ~48 weeks (Trifunovic et al. 2004).
As a saturation mutagenesis model, the mtDNA mutator mouse has proven to be valuable tool in addressing research question related to mtDNA biology. Recently, the heterozygote mtDNA mutator mouse was utilized to establish a new mouse model which harbored a mt-tRNA Ala (A) variant and presented with mitochondrial disorder phenotype (Kauppila et al. 2016). Other studies have utilized the mtDNA mutator mouse model e.g. to address the effect of mtDNA mutations on ageing (Vermulst et al. 2007; Edgar & Trifunovic 2009; Williams et al. 2010;
Ameur et al. 2011; Ross et al. 2013; Baines et al. 2014), to study mtDNA transmission (Stewart et al. 2008a; Ross et al. 2013; Ross et al.
2014), or to understand various processes involved in mtDNA maintenance (Hance et al. 2005; Wanrooij S. et al. 2012; Baines et al.
2014; Macao et al. 2015).
1.1.4 Mitochondrial DNA variant detection by traditional methods
Many mtDNA mutation studies simply focus on diagnostic detection of
near-homoplasmic or high-frequency, clonally expanded mtDNA
mutations or rearrangements. This is because the diseases symptoms often occur only after the levels of pathogenic mtDNA reach a relatively high threshold, often ~70–90 % (Durham et al. 2007). Detection of such high-level mutations is relatively straightforward with PCR- or blotting- based methods (reviewed by Moraes et al. 2003) or by Sanger sequencing, which has a detection threshold of ~15–30 % (Hancock et al. 2005; Rohlin et al. 2009). However, especially with ageing studies, there is interest in detecting the total variant load of a tissue, including de novo mutational events, which are not yet highly clonally expanded, and are difficult to detect with the mentioned methods. Traditionally three methods have been used to sensitively measure the total mtDNA variant load of a tissue: post-PCR cloning and sequencing (PCS), single- molecule PCR (smPCR) and random mutation capture assay (RMC, compared by Greaves et al. 2009).
In PCS, the target DNA is first amplified by high-fidelity PCR, then cloned into a vector and single clones are expanded and sequenced by Sanger sequencing. As reviewed by Kraytsberg and Khrapko (2005), the advantages of PCS are fast amplification of the target mtDNA without mitochondria isolation and utilization of easy-to-use commercial kits for cloning and even robotics for plasmid purification (Kraytsberg &
Khrapko 2005). Furthermore, as mtDNA is very small genome, ~16 kb, it is even possible to analyze the entire mtDNA genome by lambda- phage based PCS (Ross et al. 2013, Hagström et al. 2014). One potential drawback, however, is propagation of PCR-errors which are indistinguishable from genuine variants; often used high-fidelity DNA polymerase Pfu introduces 1.6x10
-6errors per nucleotide per cycle (Lundberg et al. 1991) or even less, down to error rate of 4.4x10
-7with the engineered enzymes like Phusion
®(New England Biolabs, Inc.).
Furthermore, DNA polymerases have a tendency to jump between templates, which is an issue in highly mutated samples, where template switching would create new combinations of mutated molecules (Hagström et al. 2014). PCR-step may also introduce bias by preferential amplification of one but not another allele (Kraytsberg &
Khrapko 2005).
To overcome the issues of PCS, smPCR was suggested as more accurate method to study mtDNA variant loads (Kraytsberg et al. 2008). In smPCR, the source DNA is serially diluted until only a fraction of PCR reactions amplify an mtDNA product. The key assumption is that this way only a single molecule is analyzed, and thus, PCR-errors are easily distinguished as a heteroplasmic peak in the sequencing. Despite overcoming the disadvantages of PCS, smPCR introduces some new issues. First of all, the method requires optimization of the PCR to succeed from such low amount of template DNA. This also causes another major drawback – highly increased risk of sample contamination (Kraytsberg & Khrapko 2005). Also, large numbers of samples are required for the serial template dilutions (Greaves et al.
2009).
Another method to sensitively measure mtDNA variant loads without
the risk of PCR-induced errors, is RMC. The method is based on
restriction digestion of wild-type DNA prior to quantitative PCR, thus,
only molecules harboring a mutated restriction site will be amplified. An
important step in this method is the quantification of the starting
material in order to be able to determine the final variant load (Greaves
et al. 2009). RMC revealed lower mtDNA variant loads than the other
methods (Vermulst et al. 2007; Greaves et al. 2009), which was
suggested to indicate that RMC is more sensitive and effectively
diminishing the PCR-errors as artefacts. Furthermore, RMC is
insensitive to DNA damage, such as oxidized deoxyguanosine (8-oxo-
dG), which would be mistakenly paired with adenosine by DNA
polymerases (Shibutani et al. 1991), and thus, artificially detected as a
fixed GC>TA variant. Again, sensitivity to DNA damage is a potential
factor increasing the variant loads observed by PCR-based methods in
comparison to RMC (Vermulst et al. 2007). A major acknowledged
drawback of RMC is that the result may not be an accurate reflection of
the total variant load of the entire mtDNA genome because the target
restriction site represents only very short part of the genome (Vermulst
et al. 2007; Greaves et al. 2009), thus RMC might not detect clonally
expanded variants which are rare across the mtDNA genome (Greaves et
al. 2014).
In comparison to the published literature, Vermulst et al. (2007) detected very low mtDNA variant load in young wild-type mice, on average 6.0x10
-7± 0.9x10
-7mut/bp, whereas older mice showed 1.1x10
-5