PHYLOGENOMIC ANALYSIS OF THE METABOTROPIC P2Y RECEPTOR FAMILY AND ITS EXPRESSION IN ZEBRAFISH,
Danio rerio
Inaugural-Dissertation zur
Erlangung des Doktorgrades
der Mathematisch-Naturwissenschaftlichen Fakultät der Universität zu Köln
vorgelegt von Yen Yen Kwan
aus Kuala Lumpur, Malaysia
Köln 2008
2 Berichterstatter: Prof. Dr. S. I. Korsching
Prof. Dr. Jens Brüning
Tag der mundlichen Prufung: 25 November 2008
3 ERKLÄRUNG
Ich versichere, dass ich die von mir vorgelegte Dissertation selbstständig angefertigt, die benutzten Quellen und Hilfsmittel vollständig angegeben und die Stellen in der Arbeit - einschließlich Tabellen, Karten und Abbildungen -, die anderen Werken im Wortlaut oder dem Sinn nach entnommen sind, in jedem Einzelfall als Entlehnung kenntlich gemacht habe; dass diese Dissertation noch keiner anderen Fakultät oder Universität zur Prüfungvorgelegen hat;
dass sie - abgesehen von den unten angegebenen Teilpublikationen – noch nicht veröffentlicht worden ist, sowie dass ich eine solche Veröffentlichung vor Abschluss des Promotionsverfahrens nicht vornehmen werde. Die Bestimmungen dieser Promotionsordnung sind mir bekannt. Die von mir vorgelegte Dissertation ist von Prof. Dr. S. I. Korsching betreut worden.
Köln, den 8. Oktober, 2008
4
1. A
CKNOWLEDGEMENTSFirstly, I would like to thank Prof Sigrun Korshing for her guidance, patience, advice and support throughout these four years. Besides that, I would also like to express my appreciation to Prof Dr Jens Brüning, and Prof Dr Peter Kloppenburg for being in my thesis committee.
Next, I would like to acknowledge the International Graduate School in Genetics and Functional Genomics for providing the fellowship of my study. Special thanks to Dr Brigitte Wilcken- Bergmann for her help and support in all these years. Thank you very much.
Coming to Germany was a wonderful chapter in my life. I had my own fair share of good times here. To Joanna, Daniela, Luis and Leo, thank you for your comradeship, motivation, and support for the good and bad moments in all these years. Many thanks to Hayati, Hua, Ying, Jinu, Channa and many others who are not listed here for their friendship and hospitability Many thanks to my labmates for their support, help and encouragement. Special thanks extended to Dr Yuichiro Oka and Luis Saraiva for their fruitful discussions, criticisms and suggestions. I would like to thank Heven Midani for her pleasant coffee-time company and Mehmet Saltürk for taking care of the lab.
To my buddies from Malaysia, Suky, Mitty, Mei Fung, Ai Bee and Yen Ling, my sincere thanks for your constant support for all the ups and downs, joy and sadness, laughters and tears. Many years have passed and our friendship is still blooming, and I hope our friendship will remain the same in the coming years.
To my parents, no words can describe my gratitude towards you. Both of you have been the pillar of strength in my life. In you, I learned about empathy, conscience, filiality and forgiveness.
Thank you for your unlimited love, care and support even at all times To my siblings, it’s fortunate to be with you. My dearest sisters for their love and encouragement. My dear brothers for their kindness and source of motivation. Last but not least, my aunt Thong Loy, for her motherly comforts.
5
II. T
ABLEO
FC
ONTENTSI. Acknowledgements ……………………...4
II. Contents …………………...5
III. List of figures ……….………8
IV. List of tables …………………….….………..……….9
V. Abstract ...…………..…………………10
VI. Zusammenfassung ………...…………….……..11
1. Introduction ……………………………...….12
1.1 Nucleotides ……………………...…12
1.2 Purine and pyrimidine ……………………………...…..12
1.3 Purine receptor …………………...….………..….13
1.4 P2Y receptor ……………………...………….……….……….…….14
1.4.1 Structure ………...….……….…….14
1.4.2 Signal transduction ………......………...……...15
1.4.3 Biological function ………………….…….….16
1.5 Purinergic signaling ………….………..……….16
1.5.1 Cell proliferation, migration and differentiation ……….….……17
1.5.2 Neuroprotection ……….….……20
1.6 Purine and aquatic animal………...………….………..…….20
1.7 Purinergic receptor and olfaction ……….….…………..21
1.8 Zebrafish as model organism ……….......………..………….22
1.9 Aims ……….……...…22
2. Results ………….…………………..…………23
2.1 P2Y-like genes in teleost …………………..…………23
2.2 P2Y genes are paraphyletic ………….……….….………..24
2.3 Correlation between phylogenetic location and ligand ………..………….28
2.4 P2Y genes have an early origin in jawless fish ………..……….28
2.5 Global negative selection in teleost P2Y genes with a few positive selected sites ……….…….…..29
2.6 High conservation in transmembrane domains …………….……….….…….30
2.7 Genomic distribution of zebrafish P2Y genes ………….……..………34
2.8 Synthenic relationship of teleost P2Y genes …………………..……..36
2.9 Genomic structure of P2Y genes ………..…….…….38
6
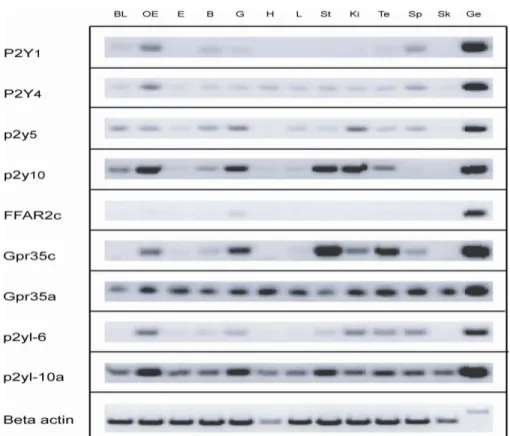
2.10 P2Y genes are broadly expressed in adult tissue ………..….….41
2.11 Expression of P2Y genes in larvae ………..…..….42
2.12 Broad expression of P2Y genes in adult olfactory epithelium ……….…….……..52
3. Discussion ………54
3.1 P2Y receptor originate early in vertebrate lineage ………...……54
3.2 Low resolution of basal taxa in phylogenetic analysis ……….54
3.3 Evolutionary dynamics of the P2Y gene family in fish ……….55
3.4 Intron-gains in P2Y gene gamily ……….57
3.5 Potential roles of P2Y receptors in zebrafish ………59
4. Conclusion and outlook ………….………..61
5. Material and methods ……….………62
5.1 Materials ……….……….62
5.1.1 Fish strains ……….………...62
5.1.2 Bacterial strain ……….…….62
5.1.3 Plasticware ………62
5.1.4 Technical equipments ……….62
5.1.5 Chemicals ………..62
5.1.5.1 Chemicals and solutions ……….63
5.1.6 Molecular biology reagents ………64
5.1.6.1 Molecular biology kits ……….……….64
5.1.6.2 Cloning vector ………..64
5.1.6.3 Oligonucleotide primers ………..64
5.1.6.4 Antibodies ……….65
5.1.6.5 Dyes, substrates, embedding media and counterstains ………65
5.2 Methods ………..66
5.2.1 Embryo maintenance ………..66
5.2.2 Data mining/Identification of P2Ys gene ………..66
5.2.3 Phylogenetic analysis ……….….67
5.2.3.1 Sequence alignment ……….67
5.2.3.2 Neighbour-Joining method ………..67
5.2.3.3 Maximum parsimony method ………..67
5.2.3.4 Maximum likelihood method ………...68
5.2.4 Evolutionary analysis ………..68
5.2.4.1 Identity and similarity matrix ………...68
7
5.2.4.2 Sequence logo ………..68
5.2.4.3 dN/dS analysis ………..68
5.2.5 Molecular biology techniques ………....69
5.2.5.1 Cloning of P2Y genes ………..69
5.2.5.1.1 Amplification of P2Y genes ……….69
5.2.5.1.2 Gel electrophoresis ……….69
5.2.5.1.3 Purification of DNA fragments from agarose gel ………69
5.2.5.1.4 Ligation into pDRIVE cloning vector ……….70
5.2.5.1.5 Chemical transformation ………70
5.2.5.1.6 Plasmid DNA minipreparation ………...70
5.2.5.1.7 Restriction enzyme digestion of plasmid DNA ………71
5.2.5.1.8 Preparation of glycerol stock ……….71
5.2.5.1.9 DNA sequencing ………..71
5.2.5.2 Expression analysis of P2Y genes ………72
5.2.5.2.1 Isolation of total RNA ………..72
5.2.5.2.2 Synthesis of first-strand DNA ………72
5.2.5.2.3 Polymerase chain reaction (PCR) ……….72
5.2.5.3 In situ hybridization ……….72
5.2.5.3.1 Cryosectioning ……….73
5.2.5.3.2 Probe preparation ………73
5.2.5.3.3 Preparation of embryos ………..74
5.2.5.3.4 Whole-mount in situ hybridization of embryos ………74
5.2.5.3.5 In situ hybrization on sections of olfactory epithelia ………...75
6. References ………..76
7. Appendix ………..80
7.1 List of abbreviations ………..80
7.2 Supplemental figures ………81
A. Phylogenetic tree of 8 fish species, frog and human ………...81
B. P2Y genes accession number and/or IDs, and location ………..87
C. Pairwise comparison of zebrafish P2Y genes ……….100
D. Expression of FFAR2c in brain and pharyngeal arches ……….101
E. Schematic drawings of pharyngeal arches of zebrafish ……….102
8. Curriculum vitae ………103
8
III
.L
ISTO
FF
IGURESFigure 1 | Schematic representation of purinergic signaling at central synapses………..19
Figure 2 | Phylogeny of teleost with other vertebrate P2Y families……….….25
Figure 3 | Phylogeny of zebrafish P2Y gene and ligand correlation……….………...27
Figure 4 | Evolutionary distances and selective pressure on P2 genes………..….……...32
Figure 5 | Positively selected amino acid site in teleost p2yl-7……….…...…33
Figure 6 | Conserved sequence motifs of P2Y family………33
Figure 7 | Chormosomal distribution of zebrafish P2Y genes………..35
Figure 8 | Conserved synteny in fish species and human ...………37
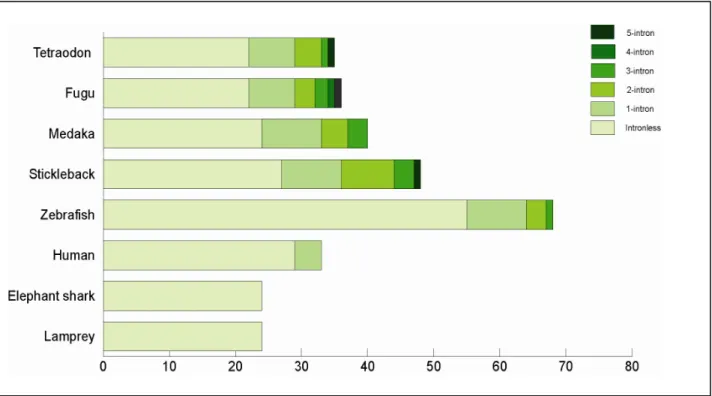
Figure 9 | Gene structure distribution in 7 fish species and human………39
Figure 10 | Estimated minimal evolutionary age and intron dynamics of P2Y subfamilies ….…40 Figure 11 | Broad expression of P2Y transcripts in different types of adult tissues…….……….41
Figure 12 | Expression of P2Y1 in central nervous system, otic vesicle and pharyngeal branches………...43
Figure 13 | Expression of p2y5 in central and peripheral nervous system, auditory and mechanosensory system………...46
Figure 14 | Expression of p2y10 in brain and ciliary marginal zone of the eye………….………47
Figure 15 | Expression of p2yl-6 in brain, pharyngeal branches, otic vesicle and vagal ganglion………48
Figure 16 | Expression of Gpr35a in brain, vagal ganglion, pharyngeal arches, kidney and ciliary marginal zone in the eye………50
Figure 17 | Expression of Gpr35c in brain, vagal ganglion, pharyngeal arches and kidney…...51
Figure 18 | Expression of P2Y genes in zebrafish olfactory epithelium……….…53
9
IV. L
ISTO
FT
ABLESTable 1 | Characteristics of human P2Y receptors……….18 Table 2 | P2Y-like genes in 10 vertebrate species……….24 Table 3 | Gene structure distribution in 8 vertebrate species………39
10
V. A
BSTRACTG-protein-coupled receptors (GPCRs) constitute the largest and most divergent class of cell surface proteins. GPCRs can be activated by extracellular signals as diverse as light, peptides, proteins, lipids, odorants, tastants, nucleotides and nucleosides. Currently, all the known chemosensory receptor genes, such as odorant, taste and pheromone receptors belong to the GPCR family, with many of them being class A or class-A related genes. Metabotropic P2Y receptors belong to class A GPCRs and are activated by extracellular nucleotides. Nucleotides are released to the environment when the organism is injured and therefore serve as one of the food stimuli. As such, it would be interesting to see if P2Y receptors play any role in olfaction in zebrafish.
To date, eight functional human P2Y receptors and 25 related orphan receptors have been found. I performed extensive data mining in drosophila, ascidian, jawless, cartilaginous and bony fish, frog and human genomes to delineate the P2Y family and investigate its evolutionary origin. The P2Y family originates early in the vertebrate lineage, reflected by the presence of lamprey and the absence of ascidian orthologues. Consistent with these findings, no P2Y receptor is found in invertebrates. In total, 38 subfamilies can be distinguished within the P2Y family, at least two third of which are already present in the shark genome. Two subfamilies, p2yl-3 and p2yl-4, are lost in the human lineage and only GPR 87 subfamily is lost in all teleost species.
Zebrafish has 68 P2Y receptor genes, the most of any fish species, and almost double as many than mammals. The teleost P2Y genes are widely distributed in the genome as small cluster and singletons. The vast majority of P2Y genes are intronless while the remaining genes contain up to five introns. In the teleost lineage, the genomic arrangement of P2Y genes is preserved to a large extent, and some synteny is found even with the elephant shark and human genome, possibly reflecting the functional importance of these genes. Selective pressure on teleost P2Y genes generally is high, as evidenced by a preponderance of negative selection.
However, a few genes exhibit positive selection at individual sites.
In early development, P2Y genes are expressed in many tissues and organs, notably the central and peripheral nervous system, pharyngeal arches, otic vesicle and kidney, suggesting an important role in the development of many tissues. However, no expression is detected in larval olfactory epithelium. In contrast, olfactory epithelium of adult fish does express several P2Y genes as shown by RT-PCR. A possible explanation would be a late onset of expression in the olfactory epithelium. In situ hybridisation of adult olfactory epithelium established an ubiquitous distribution, both in the sensory and non-sensory region, which seems to argue against a role of P2Y genes in nucleotide odor detection. However, further studies will be necessary to give a definitive answer to that question.
11
VI. Z
USAMMENFASSUNGBei den G-protein-gekoppelten Rezeptoren (GPCRs) handelt es sich um die größte und vielfältigste Gruppe von Membranproteinen. GPCRs werden durch sehr diverse extrazelluläre Signale aktiviert, von Licht über Peptide, Proteine zu Geruchs- und Geschmacksstoffen, bis hin zu Lipiden, Nukleotiden und Nukleosiden. Alle gegenwärtig bekannten chemosensorischen Rezeptoren, wie die Geruchs-, Geschmacks- und Pheromonrezeptoren gehören der GPCR Familie an, und viele davon sind aus der Klasse A der GPCR. Das gilt auch für die metabotropen P2Y Rezeptoren, die durch extrazelluläre Nukleotide aktiviert werden. Nukleotide werden freigesetzt, wenn ein Organismus verletzt wird, und können so als Signale zur Nahrungsdetektion dienen. Es erschien daher interessant, zu untersuchen, ob die von Fischen bekannte Geruchsdetektion von Nukleotiden durch P2Y Rezeptoren vermittelt sein könnte.
Die P2Y Familie im Menschen besteht aus acht funktionalen P2Y Rezeptoren und 25 verwandten Rezeptoren mit bisher unbekannten Liganden. Ich habe ausführliche Datenbanksuchen in Genomen der Taufliege, von Aszidien, Kieferlosen, Knorpelfische und Knochenfische, sowie in Frosch und dem menschlichen Genom durchgeführt, um die P2Y Familie zu identifizieren und von benachbarten Familien abzugrenzen. Meine Ergebnisse zeigen, dass die P2Y Familie in frühen Wirbeltieren entstanden ist, da Vertreter dieser Familie im Neunauge, aber nicht in Aszidien vorkommen. Konsistent zu diesen Befunden konnten auch keine P2Y Rezeptoren in Wirbellosen gefunden werden. Insgesamt können 38 Unterfamilien innerhalb der P2Y Familie unterschieden werden, von denen mindestens 2/3 bereits im Haifischgenom vorhanden sind. Zwei Unterfamilien, p2yl-3 und p2yl-4, sind in der menschlichen Entwicklungslinie verloren gegangen, eine weitere Unterfamilie, GPR87, ist am Beginn der Knochenfischentwicklung verloren gegangen.
Der Zebrabärbling weist 68 P2Y Gene auf, am meisten von allen Fischarten, und fast doppelt so viele wie die Säuger. Die P2Y Gene kommen breit verteilt als kleine Cluster oder Einzelgene im Fischgenom vor. Die überwiegende Zahl der P2Y Rezeptorgene hat keine Introns, manche jedoch weisen bis zu fünf Introns auf. In der Entwicklungslinie der Knochenfische ist die relative genomische Anordnung der P2Y Gene zum großen Teil erhalten, und eine gewisse Syntenie läßt sich sogar zu den Genomen von Haifisch und Mensch beobachten. Eine solch hohe Konservierung spricht für die funktionale Bedeutung dieser Gene. Der Selektionsdruck auf die P2Y Gene der Knochenfische ist hoch, wie aus dem Überwiegen negativer Selektion ersichtlich wird. Manche Gene zeigen allerdings positive Selektion an vereinzelten Positionen.
In der frühen Entwicklung werden P2Y Gene in vielen Geweben und Organen exprimiert, insbesondere dem peripheren und zentralen Nervensystem, den Kiemenbögen, dem Ohrvesikel und der Niere, konsistent mit einer vielfältigen Rolle dieser Gene in der Entwicklung vieler Gewebe. Allerdings liess sich keine Expression im larvalen Riechepithel feststellen. Im Gegensatz dazu werden viele P2Y Gene im adulten Riechepithel exprimiert, wie ich sowohl mit RT-PCR als auch In situ-Hybridisierung zeigen konnte. Eine mögliche Erklärung dieser Diskrepanz wäre ein später Beginn der Expression im Riechepithel. In der In situ-Hybridisierung zeigt sich eine breite Expression der P2Y Gene sowohl im sensorischen als auch dem nichtsensorischen Bereich des Riechepithels, unerwartet für eine mögliche Funktion der P2Y Gene in der Geruchsdetektion von Nukleotiden. Weitere Studien werden erforderlich sein, um diese Frage abschliessend zu klären.
12
1. I
ntroductionA family of nucleotide receptor in teleost fishes, P2Y, is described in this thesis. As detailed below, there is a reason to suggest a possible function as sensory receptors for members of this family. This work presented here serve as a basis to investigate this possibility.
1.1 Nucleotides
Nucleotides are molecules composed of a nitrogen-containing ring compound linked to a five- carbon sugar and a phosphate group. The sugar involved in the synthesis and structure of a nucleotide can be either ribose or deoxyribose, Ribonucleotides are nucleotides containing ribose whereas deoxynucleotides are nucleotides containing deoxyribose. The phosphate group may consist of up to three phosphates forming monophosphates, diphosphates, or triphosphates, respectively. Nucleotide is named after the utilized base, either purine or pyrimidine. Purine bases are adenine and guanine whereas pyrimidines are cytosine, thymine and uracil.
Nucleotides are essential in the cell. They are the building blocks of the hereditary information.
Besides that, nucleotides have many other functions in the cell: i) carrier of chemical energy in the cell, ii) coenzyme when combine with vitamin or its derivative and iii) signalling molecule in the cell. Ribonucleotide adenosine triphosphate, ATP, is used to transfer energy in hundreds of different cellular reactions. ATP is synthesized via the addition of a phosphate group to ADP.
When energy is required, ATP releases its energy through its hydrolysis to ADP and inorganic phosphate. The regenerated ADP is reused for subsequent phosphorylation reactions that form ATP. Nucleotides bind to vitamin and its derivatives to form coenzyme. Coenzyme involved in both group-transfer and redox reactions in metabolism. Cyclic AMP (cAMP) is one of the signaling molecules in the cell. cAMP is derived from ATP by plasma membrane bound enzyme adenylnyl cyclase and is involved in intracellular signal transduction in organism.
1.2 Purine and pyrimidine
Purine consist of a pyrimidine ring (six-membered ring) fused to imidazole ring (five-membered ring). Members of purine include adenine, guanine, hypoxanthine, xanthine, theobromine, caffeine, uric acid and isoguanine. Purines are involved in many aspects of cellular processes:
intermediary metabolism, nucleic acid synthesis and the supply of energy phosphates to various active transport systems. In cells, ATP is abundantly found as ATP is the main energy-providing
13
and energy-storing molecule for all biological processes. On the other hand, GTP is rarely used as an energy donor but rather to transmit signals throughout the cell notably in G-protein signaling cascade. In additions, purines appear to be ligand of specific receptor reside within plasma membrane which mediate changes in cell function in response to extracellular purines (Stone, 1982).
Unlike purine, pyrimidine comprise of six-membered ring. Pyrimidine members include cytosine, thymine and uracil. In the cell, pyrimidine serves as energy source for specific metabolic reactions. UTP is the source for activating glucose and galactose whereas CTP is an energy source in lipid metabolism.
1.3 Purine receptor
Purine receptors are cell surface receptors that transduce extracellular signals to an intracellular signal to induce a cellular response. There are two main families of purine receptors, P1 and P2 receptors. The P is an abbreviation for purinergic. P1 receptor is activated by adenosine whereas P2 receptor is activated by nucleotides (Abbracchio et al., 2006).
P1 or adenosine receptor family comprises of A1, A2A, A2B, and A3 adenosine receptors. The adenosine receptor family belongs to G- protein coupled receptor (GPCR). All the receptors couple to G proteins to activate the signaling cascades. A1 receptor couples to both Gi/o and Gq/11 to activate phospholipase C pathway whereas A1 receptor only couples to Gi/o. On the other hand, both A2A and A2B receptors couple to Gs to increase cAMP concentration in the cell (Ralevic and Burnstock, 1998). Adenosine receptors are involved in modulation of cardiovascular, immune and central nervous systems (Burnstock, 2007).
P2 receptors are divided into two major families, P2X and P2Y. P2X family is of ligand-gated ion channel whereas P2Y family belongs to G-protein-coupled receptor (GPCR). P2X family is activated by extracellular adenosine 5’-triphosphate (ATP) and seven subunits have been identified to date, P2X1-7. All the members possess two transmembrane-spanning regions in which N and C termini that have consensus-binding motifs for protein kinases reside intracellularly. The first TM is involved in channel gating and the second lining the ion pore (Fields and Burnstock, 2006). P2X receptors are homomeric or heteromeric assemblies of three subunits (Koles et al., 2008) P2X receptors mediate rapid (onset within 10ms) non-selective passage of cations (Na+, K+, Ca2+) across the cell membrane resulting in an increase of Ca2+
14
and depolarization (Bean, 1992; Dubyak and el-Moatassim, 1993). The direct influx of extracellular Ca2+ through the channel constitutes a significant source of the increase in intracellular Ca2+. However, membrane depolarization leads to the secondary activation of voltage-dependent Ca2+ channels, which probably make the primary contribution to Ca2+ influx and to the increase in intracellular Ca2+. Since this transduction mechanism does not depend on the production and diffusion of second-messengers within the cytosol or cell membrane, the response time is very rapid, and appropriately playsan important role in fast neuronal signaling and regulation of muscle contractility (Ralevic and Burnstock, 1998). P2X receptors are important in neuronal signaling, pain transmission and inflammation.
1.4 P2Y receptor
P2Y receptors are cell-surface receptors that belong to G-protein coupled receptor (GPCR) superfamily. As such, P2Y receptors share the common molecular architecture of GPCR, consisting of seven transmembrane domains connected by three intracellular and three extracellular loops. GPCR superfamily composed of five families, namely rhodopsin, secretin, adhesion, glutamate and frizzled/taste2. P2Y receptors belong to rhodopsin/Class A family, which is the largest family of GPCRs. Rhodopsin family of GPCRs have short N termini and the receptors are primarily activated by interactions of ligand with transmembrane regions and extracellular loops. This metabotropic receptor form the δ-group together with MAS-related, glycoprotein and olfactory receptors in rhodopsin family. P2Y receptors are activated not only by ATP, but also naturally occurring nucleotides or nucleotide sugars such as ADP, UTP, UDP and UDP glucose (Fredriksson et al., 2003; Abbracchio et al., 2006; Langerstrom and Schioth, 2008).
1.4.1 Structure
P2Y family is composed of 8 subtypes that were cloned and functionally defined in human:
P2Y1, P2Y2, P2Y4, P2Y6, P2Y11, P2Y12, P2Y13 and P2Y14. These receptors are phylogenetically divided into 2 subgroups, one encompassing receptors that mainly couple to Gq protein and the other to the Gi protein. The subgroup that couple to Gq protein comprised of P2Y1, P2Y2, P2Y4, P2Y6 and P2Y11 receptors whereas the second subgroup that couple to Gi comprised P2Y12, P2Y13 and P2Y14. Additionally, several other structurally related GPCR such as lipid mediators, platelet-activating factor, cysteine leukoriene and orphan receptors are clustered with both groups (Constanzi et al., 2004; Schoneberg et al., 2007). Most of the gene sequences of P2Y receptors appear to be intronless with the exception of P2Y11. P2Y11 receptor gene has an
15
intron interrupting the coding sequence after the first six amino acids (Kugelgen and Wetter, 2000).
P2Y receptors have different selectivity for adenine or uracil nucleotides, 5’-diphosphates and 5’-triphosphate. P2Y1, P2Y12 and P2Y13 are selective for adenine nucleotides, whereas P2Y4, P2Y6 and P2Y14 are selective for uracil nucleotides. P2Y2 and P2Y11 are not selective to both uracil and adenine nucleotides. Lastly, P2Y14 has an atypical selectivity for UDP-glucose (Costanzi et al., 2004).
P2Y receptors share some motif of Class A GPCRs, ‘DRY’ and ‘D/NPxxY(x)5,6F’ motif at the cytoplasmic end of TM3 and TM7 respectively. Additionally, these receptors possessed signature motif of their own. All known P2Y receptor subtypes possess 4 cysteine residues at their extracellular domains which form 2 disulfide bridges: the first one between N-terminal domain and EL3 and the second bridge between EL1 and EL2 (Hoffmann et al., 1999). Besides that, consensus sequence ‘S(I/V)(L/I)FLTCIS’ is also conserved in TM3 (Kugelgen and Wetter, 2000). Although the receptors in P2Y family display a relatively high diversity in amino acid composition, conserved residues were found in TM3, 6 and 7 which are involved in ligand binding (von Kugelgen, 2005).
1.4.2 Signal transduction
P2Y1, P2Y2, P2Y4, P2Y6 and P2Y11 receptors couple preferentially to the stimulation of phospholipase C (PLC) via Gq, and P2Y12, P2Y13 and P2Y14 receptors couple to the inhibition of adenylnyl cyclase via Gi. P2Y11 was also couple to the stimulation of adenylate cyclase via Gs. However, the specific downstream signal transduction pathway seems to be depending not only on P2Y subtype but also on cell type expressing receptor (Ralevic and Burnstock, 1998). P2Y13
receptor couple to Gi protein subunits and subsequently inhibits adenylnyl cyclase and cAMP formation. However, transfected P2Y13 receptor in 1321N1 neuroblastoma cells and Chinese hamster ovary can simultaneously couple to Gi, G16 and also Gs upon stimulation by ADP (Marteau et al., 2003). Stimulation of ATP in transfected P2Y11 receptor in 1321N1 neuroblastoma cells induced an increase in IP3 and cytosolic Ca2+ as well as cAMP via Gq and Gs respectively. Stimulation with UTP unexpectedly increases only cytosolic Ca2+ suggesting that stimulation of ATP and UTP on P2Y11 induces distinct signaling pathways (White et al., 2003).
16
Besides that, P2Y receptors also interact with cellular macromolecules, inducing signaling cascades that mediate responses in the cell. The interaction of P2Y receptors with small homomeric G proteins, integrins and tyrosine kinases activates mitogen-activated protein kinases (MAPK), in particularly extracellular signal-regulated kinase (ERK) pathway. In addition, P2Y receptors interact with PDZ domain and induce ion channel responses to induce trafficking in cellular membrane. The interplay of P2Y receptors with distinct G proteins and signaling pathways further indicates the complexity of this receptor family (Fischer and Krugel, 2007;
Koles et al., 2008).
1.4.3 Biological function
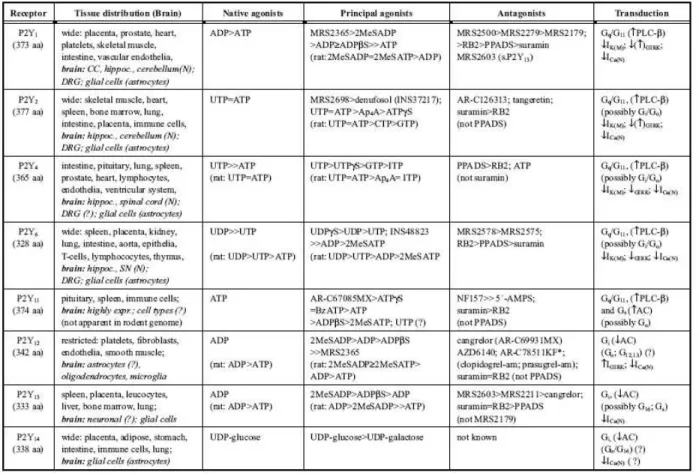
P2Y receptors are involved in neuronal and non-neuronal mechanisms in regulating neurotransmission, secretion, cell division, proliferation, differentiation, regeneration and apoptosis in the cell. These receptors are broadly expressed in many tissues notably in the central and peripheral nervous system (Table 1). The wide expression of P2Y subtypes in central nervous system indicates that these receptors are part of a component to maintain physiological balance in neuronal transmission directed to the survival of the organism. P2Y receptors mediate food foraging, response to enemies as well as reaction to injury, inflammation and oxygen deficiency in the organism (Burnstock, 2006; Fischer and Krugel, 2007).
1.5 Purinergic signaling
Extracellular purines are released by the cell itself to stimulate the activation of purinergic signaling. Purinergic receptor activation subsequently trigger a host of second messenger systems and other signaling molecules including cyclic AMP (cAMP), inositol-1, 4, 5- triphosphate (IP3), phospholipase C (PLC), arachidonic acid and nitric oxide leading to an increase of intracellular calcium concentration (Fields and Douglas, 2006).
ATP is an extracellular signaling molecule that exerts potent physiological response on a variety of tissues and cell types. ATP is released not only by presynaptic terminal but also postsynaptic membrane and other cells. The release occurs not only in response to neurotransmitter stimulation but also in response to physiological states to mechanical stress, hypoxia, inflammation and agonists. The degradation of ATP in extracellular space by ectoenzymes subsequently activates various types of P2X and P2Y receptors to provide a homeostatic regulation mechanism in the cell. P2X receptors act within milliseconds because ligand binding is directly linked to channel opening. Thus, P2X receptor can mediate fast ATP signaling over
17
short distances. In contrast, P2Y receptors can recognize lower concentrations of nucleotides (in the range of nM) and the binding of agonist triggers second messenger pathways. The signals and its duration is amplified and prolong over hundreds of milliseconds or even seconds, which makes it attractive as a neuromodulatory functions. Once released, ATP is rapidly degraded by ectonucleotidases to ADP, an agonist of P2Y1, 12, 13 rceptors. The degradation of ADP in turn generates AMP and later adenosine, which stimulates postsynaptic adenosine receptors. Adenosine receptors then activates neuronal K+ conductance and may also inhibit transmitter release via A1 (or A2) receptors (Fig. 1).
P2Y receptor families couple to Gq, Gs and Gi, hence modulating the activity of several types of voltage-gated ion channels via different G protein subunits. Upon stimulation with agonists, P2Y receptors inhibit N-type Ca2+ led to a reduced transmitter release or decreased neuronal excitability. P2Y12, 13 receptors inhibit N-type Ca2+ channels and activate G protein-activated inward rectifier (GIRK or Kir3) K+ channels, both via Gβγ subunit. P2Y1, 2, 4, 6 receptors close N- type Ca2+ channels via Gq and inhibit GIRK and M-type K+ channels. However, P2Y1, 2 is able to open GIRK channels due to the crosstalk between Gq and Gi mediated pathways in which the receptors interact with Gαiβγ trimers. This interaction led to the release and binding of Gβγ subunits to the K+ channel.
The release of ATP from astrocytes increased intracellular calcium via purinergic signaling (P2X2, 4, 5 ,7 and P2Y1, 2, 4, 14). The increased cytoplasmic calcium in turn stimulates the release of glutamate and other signaling molecules (aspartate, D-serine, nitric oxide and other neuroactive substances) from astrocytes to propagate the calcium wave to adjacent cells. The interaction between neuron and glia display an intercellular communication in the brain (Fields and Burnstock, 2006; Fischer and Krugel, 2007)
1.5.1 Cell proliferation, migration and differentiation
Purinergic signaling is present in the early stages of embryogenesis and is involved in processes of cell proliferation, migration and differentiation. Nucleotides exert a synergic effect on cell proliferation in association with growth factors, chemokines or cytokines in early stages of development by parallel activation of MAPK kinase pathway and/or by transactivation of growth factor receptors.
18
Activation of NMDA receptors increases proliferation and differentiation of neural progenitor cells (Joo et al., 2007). The presence of purinergic antagonists of pyridoxalphosphate-6- azophenyl-2’, 4’-disulfonic acid (PPADS), reactive blue 2 or suramin in P19 neural progenitor cells impaired activity of cholinergic and glutamate NMDA receptors in differentiated P19 cells.
The reduced activity of sholinergic and glutamate NMDA receptors suggest the participation of purinergic signaling in initiating downstream cascades of differentiation (Majumper et al., 2007, Resende et al., 2007).
Table 1: Characteristics of human P2Y receptors.
Adapted from Fischer and Krugel, 2007.
19
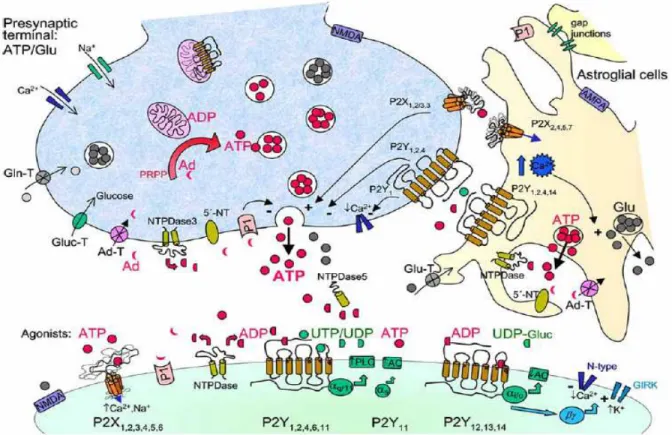
Adapted from Fischer and Krugel, 2007.
Figure 1: Schematic representation of purinergic signaling at central synapses.
ATP may be produced by de-novo purine biosynthesis from 5’-phosphoribosyl-1-pyrophosphate (PRPP) and also by purine salvage pathways from adenosine (Ad) in neurons (and astroglial cells, not shown).
ATP level in nerve terminals is generated via ADP mainly by oxidative phosphorylation in the mitochondria and may then be accumulated by carrier-uptake (vesicular ATP translocase) in synaptic vesicles (excitatory terminals likely present separate ATP- and glutamate-containing vesicles) as indicated. ATP released upon nerve stimulation from presynaptic terminals predominantly by exocytosis 1) activates “fast” ionotropic P2X- and with other nucleotides “slow” metabotropic P2Y-R subtypes at the postsynaptic neuronal membrane 2) modulates its own release or that of co-transmitters via presynaptic P2X (maybe P2X1,2/3,3,7) and P2Y (P2Y1,2,4) auto-receptors and 3) triggers Ca2+ signalling events in astrocytes via various P2X/Y-R (at least P2X2,4,5,7 and P2Y1,2,4,14). In addition, an astrocytic [Ca2+]i rise can also be induced in response to neuronal glutamate release or by other neurotransmitters via activation of the corresponding receptors. The induced Ca2+ signals or propagated Ca2+ waves represent an important form of glial excitability and mediate glial-glial cell and glial-neuronal communication. The range of astrocyte-synapse interactions might be very complex. Subsequently, ATP and glutamate (Glu) are released from astrocytic processes enwrapping the synapse, which in turn modulate the activity of the nearby neurons and synapses or signal back to the astrocyte. Several enzyme families can degrade ATP (nucleotides). For example, the presynaptically localized ectonucleoside triphosphate diphosphohydrolase3 (NTPDase3) hydrolyzes ATP to ADP, which is a strong agonist on P2Y1,12,13-Rs, and ADP further to AMP. The cellular localization of other NTPDase enzyme isoforms needs to be defined. Ecto-5’-nucleotidase (5’-NT), which is also present at synapses and astrocytes, degrades AMP to adenosine. Adenosine can activate various P1-Rs. Not depicted, surface-located ecto-nucleotide kinases in astroglial cells can interconvert nucleoside di- and triphosphates. Other abbreviations: Ad-T, adenosine transporter; Gln-T, glutamine transporter; Glu-T, glutamate transporter; Gluc-T, glucose transporter; αq/11, αs, αi/o, βγ, different G protein signalling; (↑) indicates activation;(↓) indicates inhibition;
(+) opening or (-) closure of ion channels (or positive/negative modulation of transmitter release).
20 1.5.2 Neuroprotection
Impaired cells release nucleic acids and their metabolites such as nucleotides, nucleosides and uric acids to the environment. These nucleic acids and their metabolites are recognized by specific host receptors (Toll-like receptors, ROG-like receptors and NOD-like receptors) and purinergic receptors (P2X, P2Y and adenosine receptors) to trigger immune responses (Ishii and Akira, 2008). Macrophages detected increased nucleotides levels via P2Y2 receptor, responsive to both ATP and UTP, and initiate the release of Ca2+ from the endoplasmic reticulum. The calcium release, in turn, triggers surface channel to promote Ca2+ entry and refilling of stores (Rey et al., 2006). The influx of calcium is essential for T cell activation and proliferation (Carroll et al., 2006). Besides that, released ATP induced the activation of P2Y1 in the astrocytes. Subsequently, this led to the production of interleukin-6 (IL-6) to rescue the impaired cells (Fujita et al., 2008).
1.6 Purine and aquatic animal
Aquatic animals can detect, discriminate and respond to a variety of water-borne stimuli to reproduce, social interactions, feeding, and predator detection (Derby and Sorensen, 2008).
Likewise, fish detect an array of chemicals in their environment for habitat recognition, food finding, conspecific identification and predator avoidance. In fish, pheromone associates to habitat recognition and reproduction whereas bile acids for alarm behaviour. Amino acids and nucleotides are always associated with feeding behaviour and mediated by both olfaction and gustation.
In channel catfish, nucleotides are processed by dorsolateral of the olfactory bulb. Bile acids and amino acids are processed in the medial and lateral olfactory bulb respectively (Hansen et al., 2003). Likewise in zebrafish, bile salts and amino acids are processed in the medial and lateral OB respectively. Conversely, nucleotides are processed between the clusters responding to amino acids and bile salts (Li et al., 2005). The conservation of processing zone of odorants in olfactory bulb indicates that the odotopic map is preserved in the fish. This odotopic map is further preserved in the forebrain of channel catfish. Feeding cues of amino acids and nucleotides are represented in lateral, palllial portions of the forebrain in the channel catfish.
Nucleotides responsive units were situated in the lateral half of the telencephalon near the amino acid response zone (Nikonov et al., 2005).
21
ATP is abundantly found in living organism due to their importance in carrying out biological processes. Therefore, ATP presents in high concentration in animal flesh but decays rapidly as cells die (Sikorski et al., 1990). Thus, ATP is an indicator for food. In spiny lobster, ATP stimulates carnivorous feeding while AMP inhibits feeding (Zimmer-Faust et al., 1988). In seawater, the level of ATP is minimized in the background by dephosphorylating enzymes and nucleotidases. Consequently, the presence of significant concentrations of ATP in seawater provides a reliable indicator that food source is nearby (Burnstock, 1996). The detection of extracellular ATP and other purines to initiate response in the cell is facilitated by purinergic receptor.
1.7 Purinergic receptor and olfaction
Hegg and colleagues (2003) reported that purinergic receptors modulate odor sensitivity in mice. Damaged cells release ATP, thereby activating purinergic receptors on neighboring sustentacular cells, olfactory sensory neurons, and basal cells and initiating a cascade for neuroprotection and regeneration. Calcium can modulate a number of receptors, enzymes,and channels involved in odorant signal transduction. The increase in intracellular calcium by purinergic transduction triggers homeostasis mechanisms that potentially alter odor sensitivity.
Although P2Y1 and P2Y2 are detected in olfactory epithelium and vomeronasal organ of the rat, both of the receptors seems not involve in chemosensation signaling. P2Y1 is involved in the proliferation of epithelial cells in olfactory epithelium. Although P2Y2 is detected within the neurosensory epithelium of vomeronasal organ, it was postulated that it is involved in mediating mucin secretion (Gayle and Burnstock, 2005).
In olfactory epithelium of Xenopus tropicalis tadpole, ATP activates a large number of sustentacular cells and to a lower extent, olfactory sensory neurons. Upon activation by ATP, sustentacular cells may secrete components that influence the composition of the mucus in olfactory epithelium and thereby, could affect the olfactory perception (Czesnik et al., 2006).
P2Y receptor could be olfactory receptor or could be the charaperone of OR. The association of purinergic receptors (P2Y1, P2Y2 and A2a) with olfactory receptor M71 in HEK-293 cells enhances plasma localization of M71. The enhanced plasma localization with purinergic receptors was also observed in M71 subfamily members, but not distantly related members.
This association suggesting that the interaction purinergic receptor is confined to a restricted
22
population of OR. The OR interactions with other receptors may act in concert with OR associations with accessory proteins to control OR trafficking (Bush et al., 2007).
1.8 Zebrafish as model organism
The zebrafish is an important model system for genetic and developmental studies (Kimmel, 1993). It has the combination of the best virtues of all other models which includes easily accessible embryos, simple breeding and short generation time. Besides that, the embryos are completely transparent during early development facilitating visualization. The organs in zebrafish larvae composed of fewer cells compared to other vertebrate model even though the organ functions in much the same way as in other vertebrates. All these attributes make zebrafish a desirable model to work with.
1.9 Aims:
The aim of this thesis is to lay the foundation for a comprehensive analysis of the P2Y receptor family in aquatic model system, zebrafish. Previously, most of the P2Y receptor studies are conducted in pharmacology research. Only a few studies have been conducted in vertebrate development. In particular, nearly nothing is known about the possible role of P2Y receptors in zebrafish, Hence, the aims of this project are:
i) To identify P2Y receptors and delineate the family in teleost ii) To understand the evolutionary dynamics of P2Y receptor iii) To characterise expression of P2Y receptor genes
23
2. R
ESULTS2.1 P2Y-like genes in teleost
A recursive database search against 5 teleost species (Danio rerio, Gasterosteus acualeatus, Oryzias latipes, Tetraodon nigroviridis and Takifugu rubripes) with eight functional human P2Y receptors as a query has led to the identification of 42 orthologues. Further bioinformatic analysis revealed an additional 185 GPCRs that showed a high degree of structural similarity with P2Y receptors. (Zebrafish (Danio rerio) have the largest family, with 68 genes. This is followed by stickleback (Gasterosteus acualeatus) and medaka (Oryzias latipes) whose P2Y families are comprised of 48 and 40 genes respectively. Lastly, 35 genes and 36 genes constitute the tetraodon (Tetraodon nigroviridis) and fugu (Takifugu rubripes) P2Y families, respectively.
To analyse the genesis of the P2Y family, database searches were performed in jawless and cartilaginous fishes. Twenty four P2Y genes were identified in the lamprey (Petromyzon marinus) genome, and 24 genes in the elephant shark (Callorhinchus milii) genome. The number of genes in these two species might not be the complete number as the genome projects are still in progress, and the genome coverage for shark is only 1.4 fold. A single p2y- like gene was found in little skate (Raja erinacea), another cartilaginous fish with only partial genomic sequence information available (Table 2).
To pinpoint the evolutionary origin of the P2Y family, database searches were extended to the ancestral chordate species, Ciona intestinalis, an ascidian. Only one candidate with rather low homology was found, but it turned out not to fulfil the inclusion criteria (see Methods), as it did not exhibit the seven transmembrane domain structure.
Intriguingly, the number of P2Y-like genes is not much different between Xenopus tropicalis and human (39 and 33 genes respectively). This suggests that those genes retained in the vertebrate transition from water to land may have kept their function. In contrast, large differences in family size are observed between teleost species, suggesting a dynamic adaptation to changing environmental conditions.
24 Table 2: P2Y genes in 10 vertebrate species.
Dr Ga Ol Tn Tr Re Cm Pm Xt Hs
Total 68 48 40 35 36 1 24 24 39 33
Funtional genes 67 45 38 31 33 1 19 20 36 33
Pseudogenes or partial sequences 1 3 2 4 3 - 5 4 3 -
Abbreviations: Dr, zebrafish; Ga, stickleback; Ol, medaka; Tn, tetraodon; Tr, fugu; Re, little skate; Cm, elephant shark; Pm, lamprey; Xt, frog; Hs, human.
2.2 P2Y genes are paraphyletic
To investigate the phylogenetic relationship of the P2Y receptors and candidate proteins obtained above, methods of neighbour joining (NJ), maximum parsimony (MP) and maximum likelihood (ML) are used. The three methods gave slightly varying tree topologies with the ML tree having the best resolution (Fig. 2). Olfactory receptors were used as an outgroup. Both olfactory receptor and P2Y receptor belong to the delta subgroup of GPCR class A receptor family. Hence, the olfactory receptor family is the nearest phylogenetic relative of the P2Y receptor family. Phylogenomic analysis revealed that P2Y receptor family is paraphyletic. Within the P2Y clade two other gene groups are contained, platelet-activating factor receptors and succinate receptors. These ‘internal outgroups’ are interspersed between two phylogenetically distinct subgroups of P2Y receptors. This is consistent with an earlier report by Abbracchio et al (2006). Within the P2Y clade a large number of orphan GPCRs are clustered together with the functional P2Y receptors, suggesting the presence of yet to be characterized P2Ys. Moreover, leukotriene cysteine, EBI2 and free-fatty acids receptors are close neighbors in the phylogenetic tree indicating that P2Y and related receptors exhibit high diversity both in sequences and ligands.
According to the International Union of Pharmacology, the term ‘P2Y’ is used for functional receptor proteins and the lowercase ‘p2y’ is used for mammalian orphan receptors or functional nonmammalian receptors without a mammalian orthologue. Hence, I have named the fish sequences according to their human orthologue. In the case that non-nucleotide ligands are known for a mammalian receptor, the orthologous fish sequence is named after the mammalian gene. The receptors within the P2Y family with unknown ligand are named as p2y-like (p2y-l) as they share a high sequence homology to P2Y receptor (Fig. 3).
25
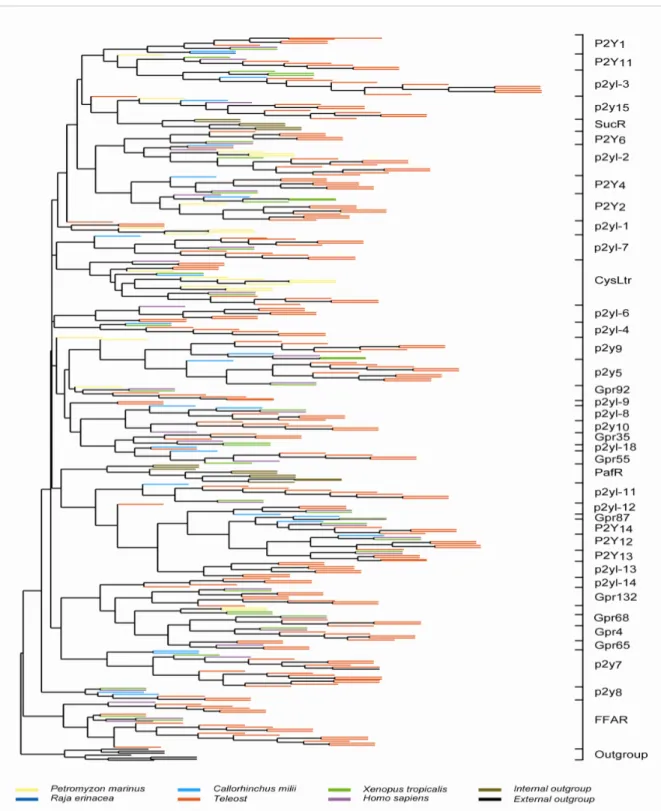
Figure 2 | Phylogeny of teleost with other vertebrate P2Y families.
A maximum likelihood tree was constructed based on the alignment of predicted amino acid sequences with 100 bootstrap replicas. 227 teleost P2Y (red), 24 shark P2Y (light blue), 1 little skate (dark blue), 24 lamprey P2Y (yellow), 28 frog P2Y (green) with human P2Y (purple).
Olfactory receptors (black) were used to root the tree. Both platelet-activating factor and succinate receptors served as internal outgroups of the P2Y family and are labeled in brown.
26
2.3 P2Y gene gains and losses in the teleost and tetrapod lineage
All P2Y genes identified clustered into 19 major clades divided into 38 subfamilies. Nearly all of the subfamilies contain tetrapod and teleost genes in each clade demonstrating that members of the subfamily have established before the divergence of Actinopterygii and Sarcopterygii.
However, two of the subfamilies did not have a mammalian orthologue (p2yl-3 and p2yl-4) even though the orthologue is present in Gallus and Xenopus (Appx 7.2A). The absence of the mammalian orthologue implied that the vertebrate orthologue is lost in the mammalian lineage.
On the other hand, several gene expansion events occurred in the teleost fish lineage, in eight of the subfamilies (P2Y2, P2Y4, p2y5, p2y7, p2y15, p2yl-7, p2yl-13 and p2yl-14). These gene duplications have occurred at different stages in evolution, as visualized by their presence in different subsets of teleost species. This scenario is displayed by P2Y4 and p2y15 clades in which the expansion only occurred in zebrafish, whereas P2Y4 and p2y15 remained a single gene in other teleosts. Furthermore, species-specific expansion in p2yl-13 clade only involved zebrafish (Fig. 3) and stickleback.
More than 60% of the clades have the full set of orthologues for each of the five analysed teleost fish genomes. It cannot be excluded that the lack of some orthologues in the remaining clades might be due to the inadequacy of the currently available databases. However, there is also the possibility that these genes are lost in some species.
27
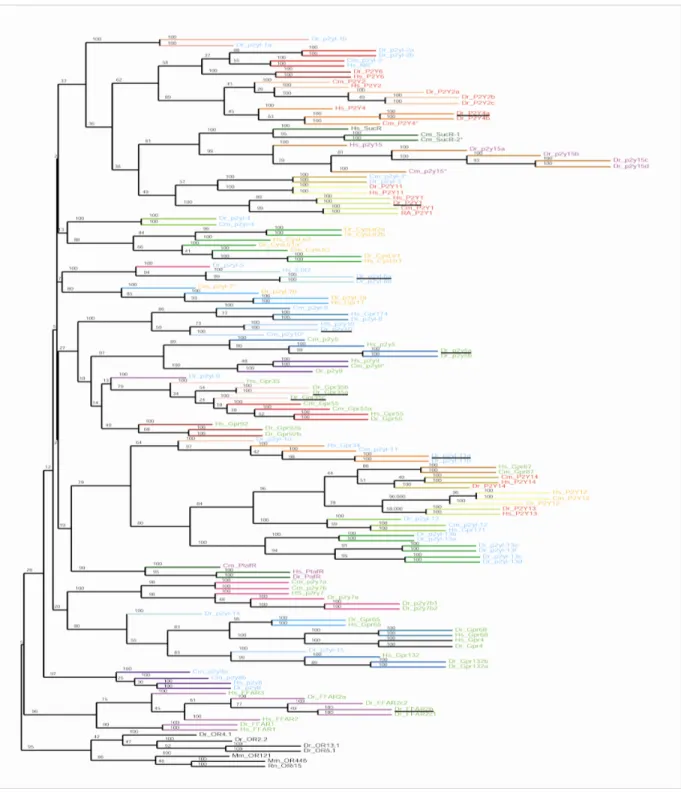
Figure 3 | Phylogeny of zebrafish P2Y gene and ligand correlation.
Phylogenetic tree of P2Y genes identified from zebrafish (68 genes), shark (24 genes) and human (33 genes). The tree was constructed using ML method with 100 bootstrap replicas. The branches are coloured to facilitate the identification of subfamilies. Dark green and black braches indicate internal and external outgroups respectively. The gene name is colour-coded according to the ligand: red, nucleotides; blue, lipid derivatives; orange, nucleotides and lipid derivatives; purple, α-ketoglutarate; green, unknown ligand. Underline gene names are candidates used for subsequent analysis.
28
2.3 Correlation between phylogenetic location and ligand
To examine the relationship between phylogenetic location and known ligand specificity, I have graphed the ligand specificity onto the maximum likelihood tree in Figure 3. Ligand information was collected for human P2Y receptors. Most receptors in this family bind either to nucleotide or lipid derivatives. Phylogenetic clusters of receptors that bind to similar types of ligands are present. However, this correlation is only partial, and there are several examples of phylogenetically neighboring receptors with rather different ligands, and also examples of phylogenetically distant receptors sharing a ligand.
Some examples of ligand promiscuity of the receptor are the activation of P2Y12 by both ADP and leukotrienes (Nonaka et al., 2005) and the activation of cysteine leukotriene receptor 1, cysteine leukotriene receptor 2 and Gpr17 by leukotrienes as well as UDP at nanomolar concentration (von Kuegelren, 2005). The large difference in chemical structure of these two endogenous ligands indicates the complexity of the ligand-receptor interactions in the diverse P2Y family.
The primitive P2Y-receptor found in the little skate Raja erinacea does not discriminate between different nucleotides agonists such as ATP, ADP or UDP (Dranoff et al., 2000). In contrast, mammalian P2Y1 which forms a sister clade with Raja erinacea P2Y-receptor is potently activated only by adenine nucleotides and not by uracil nucleotides (Fischer and Kruegel, 2007).
Thus, ligand selectivity of orthologues exhibits major species differences indicating a fine-tuning process during evolution. Hence, ligand-binding analysis of the P2Y repertoire with a whole range of species will be instructive.
2.4 P2Y genes have an early origin in jawless fish
The presence of P2Y orthologues in jawless and cartilaginous fishes revealed an ancient origin of this family of receptors. Sea lamprey P2Y genes usually form very basal branches (Fig. 2) inferring that the ancestral genes for these families existed before the segregation in jawless and jawed fish, about 560 million years (Volff, 2005). The phylogenetic analysis displayed that sea lamprey receptors did not always have one-to-one orthologue with human and teleost species. In some cases, sea lamprey representation is missing in the clade. There are two possibility of the absent in the clade, either the ancient sea lamprey gene have been lost during the transition from jawless to jawed fish or inadequacies of the current sea lamprey genome database.
29
The clustering of sea lamprey genes, basal to the three subfamilies (p2yl-1, p2yl-2, cysteine leukotriene receptor) indicating an independent duplication event occurred in lamprey lineage.
These genes formed a paralogue group within lamprey lineage. In few cases, sea lamprey gene is the ancestral of duplicate genes of higher species. Sea lamprey gene, P2Yu is ancestral gene of p2y5 and p2y9. The duplication of this orthologue occurred after the divergence from the jawless vertebrate.
On the other hand, elephant shark P2Y genes are distributed uniformly in the tree. Almost all the clades have orthologues shark gene and phylogenetically, the gene is located deep within the teleost clade demonstrating that the P2Y families are already established in the common ancestor of shark and bony fish.
Surprisingly, lamprey and elephant shark orthologues are not present in free-fatty acid receptor clade. The absence of the representatives from basal vertebrate raises the question whether free–fatty acid receptors arise only after the divergence of bony vertebrates. This will remain to be elucidated until both the lamprey and elephant shark genomes have been fully sequenced.
The distribution of the P2Y gene in the phylogenetic tree closely reflects the phylogenetic relationships of the species. The two pufferfish studied belong to the same family (Tetraodontidae) and their orthologues are closer related to each other than to those from any other species. The stickleback and medaka orthologues constituted their next neighbors, as pufferfish, stickleback and medaka belong to three subdivisions of the same superorder Acanthopterygii (orders Tetraodontiformes, Gasterosteiformes, and Beloniformes respectively).
In all cases the zebrafish orthologues occupy the most distant position (zebrafish being the evolutionarily most distant fish in this comparison, as it is an Ostariophysi, unlike the four other species which belong to a Neoteleostei.
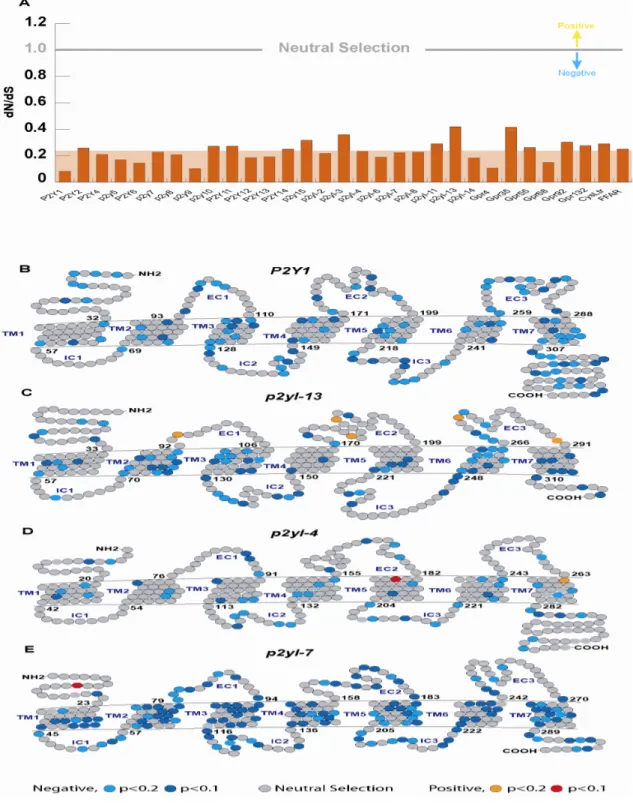
2.5 Global negative selection in teleost P2Y genes with a few positives sites
To investigate the evolutionary dynamics of P2Y genes, selective pressure analysis is conducted in teleost P2Y genes using both global and local analysis of substitution rates in non- synonymous (dN) vs. synonymous (dS) sites in 31 of the subfamilies. The remaining seven subfamilies are not included in the analysis due to the lack of number of genes. The global dN/dS values calculated for each of the groups ranging from 0.08 to 0.42, with an average of 0.23, indicating that P2Y genes are subjected to purifying selection (Fig. 4a). The purifying
30
selection is against amino acid changes in protein-coding genes, hence suggesting that these genes are slow evolving genes.
Global analysis of negative selection could mask positive selection on a few amino acid sites.
Site-by-site dN/dS analysis of the P2Y genes revealed a positively selected site in two of the analysed groups, p2yl-4 (Fig. 4d) and p2yl-7 (Fig. 4e). These sites are located in TM5 and N- terminal in p2yl-4 and p2yl-7 respectively. Conserved residues in TMs 3, 6 and 7 are likely to contribute to the binding pocket of the P2Y receptor (Erb et al., 1995; Jiang et al., 1997; Moro et al., 1998; Hoffman et al., 1999; Moro et al., 1999; Qi et al., 2001; Guo et al., 2002; Harold et al., 2004). All the positively selected sites are not positioned at the binding pocket indicating that the ligand specificity is most likely conserved in teleost lineage.
2.6 High conservation in transmembrane domains
To analyse the sequence similarity of the P2Y genes, pairwise comparisons are performed. P2Y genes showed low identity values (20-50%) indicating that this class of receptors is highly divergent in the amino acid composition (Appx. 7.2C). Across the species, homologues of a subtype have a higher homology and sequence conservation. For example, in the P2Y1 clade, zebrafish shared more than 60% of identity with little skate, elephant shark and human. The shared identity is extended to more than 80% in teleost species (data not shown).
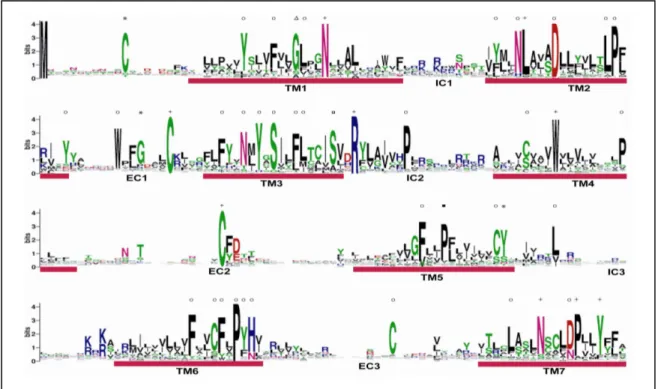
P2Y receptor belongs to the rhodopsin family of GPCR. Therefore, distinct amino conservation is much more prevalent in transmembrane region than non-transmembrane region. Nine sequence motifs of rhodopsin family is conserved in P2Y receptors (‘N’ in TM1, ‘L’ in TM2, ‘C’ in EC1 and EC2, ‘R’ in IC2, ‘W’ in TM4 and, ‘N’, ‘P’ and ‘Y’ in TM7). Besides that, P2Y also shared a conserved amino acid with VIR and ORA respectively (‘G’ in TM1 and ‘S’ in TM3). In addition, a conserved proline (P) in TM5 is also present in ORA, T2R and TAAR suggesting that this is a general motif of rhodopsin family (Fig. 5).
Next, consensus motifs are analyzed to search for characteristic sequence motif of this receptor family in fish. There are three consensus motifs reported for functional P2Y receptors in mammals. First, all known P2Y receptor subtypes possess 4 cysteine residues at their extracellular domain (Hoffmann et al., 1999; Ding et al., 2003). Second, a conserved consensus sequence of “S(I/V)(L/I)FLTCIS” in TM3 (Kuegelgen and Wetter, 2000). And third, an “Hxx(R/K)”
motif is present in TM6 (Abbracchio et al., 2006). The internal outgroups, platelet-activating
31
factor and succinate receptors possessed two of the three motifs listed above, emphasizing the high structural similarity with P2Y receptors. Both platelet-activating factor and succinate receptors possessed “S(I/V)LFLxxIS, HxxQ” and “SILF(L/M)xxxS, HxxR” motifs at TM3 and TM6 (data not shown). The conservation of cycteine residue is also extended to the outgroups.
Platelet-activating and succinate receptors retained cysteine residue at two and three of the extracellular domain respectively. However, conserved cysteine in N-terminal is absent in both receptors. Therefore, the cysteine residue in N-terminal may serve as a signature motif in identifying members of P2Y family.
The analysed subfamilies that possesed 4 cysteine residues in the extracellular loop are grouped into 3 classes: i) P2Y receptor; ii) uncategorized receptors that have known ligand (gpr55, gpr65, gpr68, gpr132 and cysteine leukotriene receptors) and iii) orphan receptors that have no known ligand (p2yl-2, p2yl-3, p2yl-4, p2yl-6, p2yl-7, p2yl-8, p2yl-11, p2yl-12, p2yl-13 and p2yl-14). This motif shared by P2Y receptor and orphan receptors may help to identified the yet remaining P2Y members.
Although the receptors possessed conserved sequence motifs, most of the motifs are also present in platelet-activating and succinate receptors. Both the receptors intertwined P2Y receptors in the phylogenetic tree. Hence, it is not surprising for platelet-activating and succinate receptors to share a high sequence similarity to P2Y receptor. Despite the high conservation of P2Y receptor with other receptors of rhodopsin family, yet three P2Y-specific motifs are located;
‘C’ in N-terminus, ‘G’ in EC1 and ‘Y’ in TM5. All the 3 P2Y-specific motifs are also present in the mammalian P2Ys.
32
Figure 4 | Evolutionary distances and selective pressure on P2Y genes.
(A) dN/dS ratios of 31 teleost P2Y subfamilies. dN/dS analysis is conducted only in group that contain more than 2 genes. dN/d >1 indicates positive selection; dN/dS < 1, purifying selection;
and dN/dS =1, neural selection. The group average ratio is indicated by background shading.
(B-E) A representative site-by-site selective pressure is shown for four P2Y sequences (negative selection in light blue, p<0.2 or blue, p<0.1, neutral selection in grey, positive selection in orange, p<0.2 and red, p<0.1.
33
Figure 5 | Positively selected amino acid site in teleost p2yl-7.
Red shaded indicates positively selected amino acid site in N-terminal. Yellow shaded indicates conserved cysteine residue site in N-terminal. Conserved cysteine is labeled in blue.
Figure 6 | Conserved sequence motifs of P2Y family.
Conservation of predicted amino acid sequence for the fish P2Y repertoire is displayed as sequence logo. The regions corresponding to the transmembrane (TM) domains and the extracellular and intracellular (EC and IC) domains are numbered and indicated. Crosses represent residues generally conserved among other class A GPCR families and circles represent residues conserved in platlet-activating and succinate receptors. Triangles represent residues conserved between P2Y and V1R. Squares represent aresidues conserved between P2Y and ORA. Filled squares represent residues conserved between P2Y, ORA, T2R and TAARs. Asterisks represent conserved residues found only in P2Y.
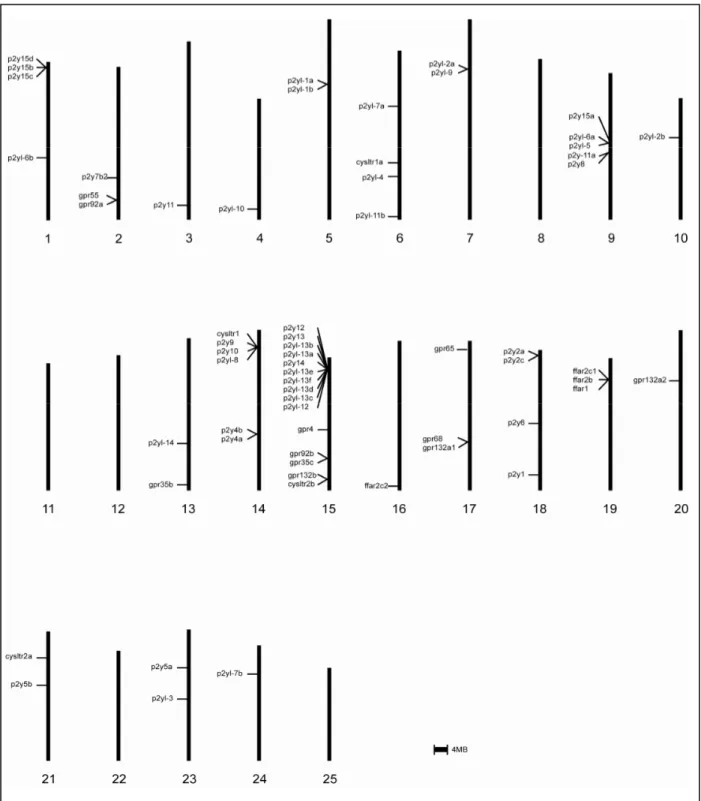
34 2.7 Genomic distribution of zebrafish P2Y genes
In zebrafish genomes, P2Y genes are distributed broadly, residing on 20 chromosomes. The genes are distributed both as singleton and cluster (Fig. 7). There is one major cluster containing 10 genes on chromosome 15. Several small clusters comprise of two to four genes are also found on chromosome 1, 2, 5, 7, 9, 14, 17, 18 and 19. The rest of the genes existed as singletons residing in other chromosomes except on chromosome 8, 11, 12, 22 and 25. Only 5 of the identified P2Y genes remain unassigned to any chromosomes.
The genomic location of ten listed genes in the major cluster in chromosome 15 concurred with the phylogenetic analysis inferring the presence of expansion event. Furthermore, the genes in the cluster are arranged in the tandem as in phylogenetic analysis postulating the existence of correlation between genomic linkage and phylogenetic relationship.
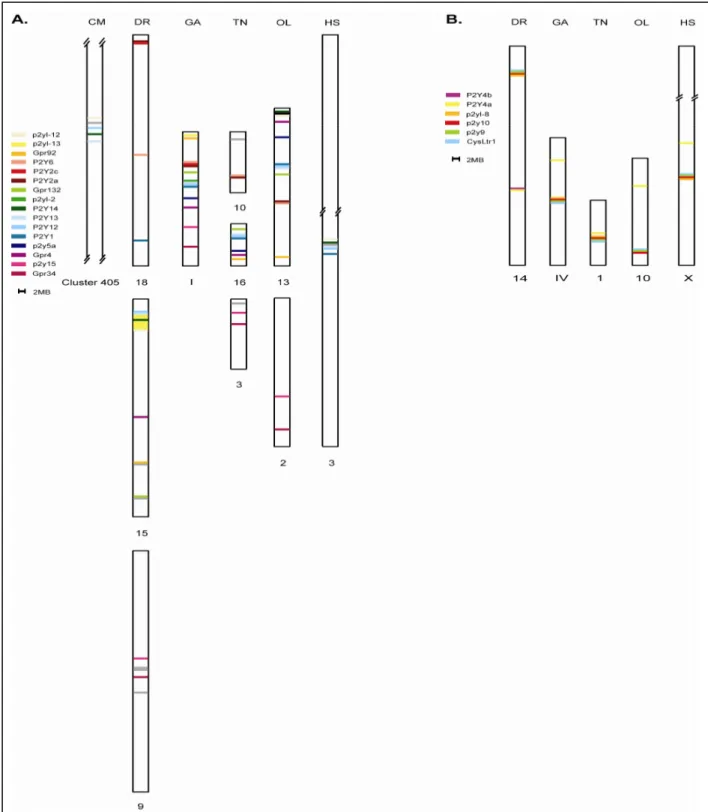
The ten genes are arranged in the order of: P2Y12, P2Y13, p2yl-13b, p2yl-13a, P2Y14, p2yl-13e, p2yl-13f, p2yl-13d, p2yl-13c and p2yl-12 (Fig. 8a). The cluster composed of P2Y12, P2Y13, P2Y14
and p2yl-12 is evolutionary well-preserved. This is supported by shared genomic location in elephant shark (cluster 405), stickleback (chromosome I), medaka (chromosome 13), tetraodon (chromosome 16) and human (3q24-3q25) (Schoeneberg et al., 2007; Venkatesh et al., 2007).
The addition of p2yl-13 subfamily into gene cluster of zebrafish demonstrated the gene expansion via gene duplication.
Two intrachromosomal duplication events have taken place. The first duplication event generated p2yl-13a and p2yl-13b from p2yl-12. Then, it was followed by second duplication event, producing p2yl-13c, p2yl-13d, p2yl-13e and p2yl-13f on chromosome 15 in zebrafish. The four genes may be originated from p2yl-13a and p2yl-13b based on the phylogenetic relationship. Besides zebrafish, the second duplication occurred only in stickleback although the duplicated gene is translocated to a different chromosome.
Second duplication event is not presence in other fish species suggesting either the duplication event is limited to zebrafish and stickleback only or the cluster of genes is lost in other species during evolution process.