Research Collection
Master Thesis
Review of Early Warning Dissemination in Media and Assessment of Flood Early Warning Systems in Media
A case study in West Africa
Author(s):
Hohmann, Thierry Publication Date:
2021-01
Permanent Link:
https://doi.org/10.3929/ethz-b-000468483
Rights / License:
In Copyright - Non-Commercial Use Permitted
This page was generated automatically upon download from the ETH Zurich Research Collection. For more information please consult the Terms of use.
ETH Library
Review of Early Warning Dissemination in Media and Assessment of Flood Early Warning Systems with Media
A case study in West Africa
Master Thesis
Federal Institute of Technology Zurich (ETHZ) Institute of Environmental Engineering (IfU)
&
Swiss Federal Institute of Aquatic Science and Technology (eawag) Decision Analysis (DA)
6
thof January 2021
Supervisors:
Prof. Dr. Peter Molnar, ETHZ, IfU Dr. Martijn Kuller, eawag, DA Dr. Darcy Molnar, ETHZ, IfU Dr. Judit Lienert, eawag, DA
Author:
Thierry Hohmann
i
Abstract
Climate change is projected to exacerbate flood hazards in the future. Around 20% of all floods worldwide occur in Africa. The impact of floods can be mitigated with Flood Early Warning Systems (FEWS). Effective FEWSs need early warning dissemination and sound forecasting modeling. Researchers found that media, and recently also social media, are key stakeholders in warning dissemination.
Furthermore, researchers investigated the potential of social media in assessing the accuracy or improving early warning dissemination in FEWS. However, little research on these two aspects has been conducted in West Africa. In this study, we aim to address the current warning dissemination in media and social media in West Africa. Furthermore, we investigate if social media can be used to assess the performance of FANFAR, a FEWS in West Africa predicting streamflow. We queried archives of newspapers, radio, and TV and tweets based on the flood event disaster database EMDAT and identified if early flood warnings are issued and whether they differ between events of different magnitude and between countries.
Furthermore, we compared the daily number of tweets to the daily forecasted flood risk by FANFAR on a
country scale. We employed a flood event detection algorithm developed by de Bruijn et al., 2019, which
uses machine learning to identify flood-related tweets. Results show that radio and TV archives that can be
systematically queried are, to the best of our knowledge, not available. However, the assessed newspapers
often disseminate the warning that has been issued by a governmental meteorological agency. We found,
that in Nigeria, more early warnings are issued in newspapers and tweets with an increase in people affected
during a flood. We did not observe this trend in Ghana and could not find any early warnings issued in the
Ivory Coast or Burkina Faso. Nevertheless, we found that tweets contain links with potential information
about flood warning dissemination. Results also show that tweets indicate flooding reliably. However, we
found that the assessment of FANFAR based on only flood-related tweets is not adequate. Additional
factors, such as rainfall, or systematic lags between tweets and forecasts, could play a role. These factors
should be determined on a regional scale. Mostly the influence of rainfall on tweets limits their usage in
FEWSs that predict streamflow, such as FANFAR. Nonetheless, in combination with an authoritative
dataset, such as streamflow, tweets could provide additional information. Our findings imply that media
and social media can be used as a tool for warning dissemination, a source for warning dissemination
research, and as additional data to support the assessment of FEWSs. Especially the projected increase of
social media in the future will facilitate the improvement of early warning research and FEWSs.
ii
iii
Acknowledgments
Throughout the writing of my thesis, I have been fortunate to receive great support and assistance along the way.
I would first like to thank Peter and Darcy Molnar from ETHZ, who enabled me to travel to Ghana in course of the Network of Water and Life program. Besides the friends I made in this program, I learned valuable lessons about research for impact and research in low-income countries. This experience assisted me greatly in completing my thesis. Also, you have been more than helpful with your constructive criticism and feedback concerning my thesis.
I would further like to thank Judit Lienert and Martijn Kuller from eawag. You supported me with day- to-day supervision and valuable inputs regarding report writing, conceptual thinking, and presentation of results. Your shared knowledge will also help me in future projects. Furthermore, I would like to thank the Decision Analysis cluster and the whole Environmental Social Sciences department at eawag for questions and inputs during presentations I held.
Also, I would like to acknowledge the support I received from Jafet Andersson, Léonard Santos, and Lorna Little from the Swedish Meteorological and Hydrological Institute (SMHI). You provided me with the necessary data along the way and pitched ideas and inputs for my thesis.
Furthermore, I would like to thank Jens de Bruijn from the Vrije Universiteit Amsterdam. You provided neatly structured data indispensable for my thesis and were always available when I had questions.
I also would like to thank my parents Beatrice and Charles Hohmann for their emotional support during the troublesome time of COVID-19. Finally, I would like to acknowledge the support of my friends from different branches of studies for invigorating and fruitful discussion related to my thesis. Namely, Vlad Bunkin, who helped me a great deal with programming-related issues, and Maurice Grunder, who assisted me in proof-reading, played a vital part in the development of this thesis.
This thesis utilized data from the FANFAR project, which has received funding from the European
Union’s Horizon 2020 research and innovation program under grant agreement No 780118.
iv
v
Table of Contents
Abstract ... i
Acknowledgments ... iii
Table of Contents ... v
List of Acronyms ... vii
List of Tables ... ix
List of Figures ... xi
1. Chapter: Introduction ... 1
2. Chapter: Literature Review ... 3
2.1 FEWS Warning Dissemination in West African Media ... 3
2.1.1 Early Warning Dissemination in FEWS ... 3
2.1.2 Content Analysis of Flood Related Issues in West African Media ... 4
2.2 Incorporating Social Media in FEWSs ... 5
2.2.1 Twitter in Flood Forecasting ... 5
2.2.2 Flood Event Detection with Twitter ... 6
2.2.3 Assessment of FEWSs in West Africa ... 8
3. Chapter: Methods ... 9
3.1 Case Study ... 9
3.1.1 FANFAR ... 9
3.1.2 Forecast Model ... 10
3.1.3 The HYPE Model ... 10
3.2 Flood Early Warning Dissemination Investigation in West African Media ... 15
3.2.1 Data Collection ... 15
3.2.2 Early Warning Dissemination Analysis ... 17
3.3 Assessing FANFAR with Twitter... 19
3.3.1 Data Collection and Pre-Processing... 19
3.3.2 Data Analysis ... 23
4. Chapter: Results and Discussion ... 25
4.1 Flood Warning Dissemination in West Africa ... 25
4.2 Assessing FANFAR with Twitter... 27
4.2.1 The Statistics of EMDAT, the FRI, Rainfall and tweets ... 27
4.2.2 Data Analysis ... 30
5. Chapter: Conclusion and Further Research ... 39
vi
Bibliography ... 41
A. Appendix: Methods ... I
A.1 Case Study: FANFAR, a FEWS in West Africa ... I
A.1.1 FANFAR ... I
A.1.2 The HYPE Model ... II
A.2 Twitter and FANFAR ... III
A.2.1 Data Collection ... III
B. Appendix: Results and Discussion ... V
B.1 Flood Warning Dissemination in West Africa ... V
B.1.1 Data Collection ... V
B.2 Assessing FANFAR with Twitter... VI
B.2.1 Data Analysis ... VI
vii
List of Acronyms
API: Application Programming Interface ... 5, 17, 20 EMDAT: The International Disaster Database ... passim EWS: Early warning system ... 1, 3, 4, 8 FANFAR: Reinforced cooperation to provide operational flood forecasting and alerts in West Africa
... passim FAR: False alarm rate ... 24, 34
FEDA: Flood Event Detection Algorithm ... 21
FEWS: Flood early warning system ... passim FN: False negative ... 24, 33, 35, 36 FP: False positive ... 24, 33, 34, 35 FRI: Flood risk indicator ... 22
GOF: Goodness-of-fit measure ... 39
HRU: Hydrological response unit ... 10
HydroGFD: Hydrological Global Forcing Data ... 13, 14, 20 ICT: Information and Communications Technology ... 9
KGE: Kling-Gupta efficiency ... 12, 13, 39 MLM: Machine learning methods ... 7
NER: Named entity recognition ... 7
NGO: Non-governmental organizations ... 4, 5 NRE: Normalized rainfall exceedance ... passim POD: Probability of detection ... 24, 34 QLCA: Qualitative content analysis ... 18
QNCA: Quantitative content analysis ... 18
R: Return period ... 20
RMSE: Root Mean Square Error ... 39
r
P: Pearson correlation coefficient ... 24
RQ: Research question ... 2, 16 r
S: Spearman correlation coefficient ... 24, 25 SC: Sub-catchment ... 10, 11 SDG: Sustainable Development Goal ... 1
SMHI: Swedish Meteorological and Hydrological Institute ... 10
SSA: Sub-Saharan Africa ... 1
TAGGS: Toponym-Based Algorithm for Grouped Geoparsing of Social Media ... passim
TN: True negative ... 24
TP: True positive... 24, 33, 34
WWH: World-Wide HYPE ... 13, 20, 23
ε: Base activity of Twitter users ... 23, 30, 39
viii
ix
List of Tables
Table 2-1: Research questions (RQ) and the corresponding search terms to find an initial body of literature.
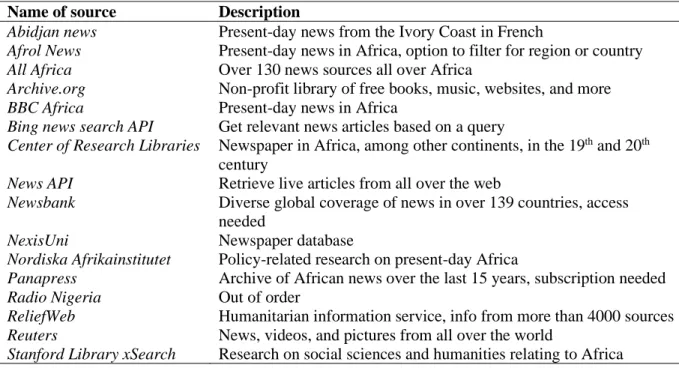
The research questions are specified in subsequent sections. A * indicates a wildcard ... 3 Table 3-1: Characteristics of the WWH and the Niger-HYPE sub-catchments (SCs). Adapted from (Andersson, 2020a). ... 12 Table 3-2: Meta-sources ordered alphabetically, that show lists of newspaper, TV, or radio sources. The links to the sources are displayed in Table B-1 in the Appendix. ... 16 Table 3-3: News sources ordered alphabetically and their description. The weblinks are displayed in Table B-2 in the Appendix. ... 16 Table 3-4: Categories identified from an initial set of newspapers. The category Warning in bold describes when the content of a news article is considered to be an early warning. ... 18 Table 3-5: Confusion matrix, showing how we define true positives (TP), true negatives (TN), false positives (FP), and false negatives (FN). FEDA detected events are assumed to be actual events. ... 23 Table 4-1: Countries and news publishers involved in warning dissemination. ... 25 Table 4-2 Flood event media analysis based on EMDAT. Total warnings denote the number of news or tweets that are categorized as warning-related. Early warnings are issued latest one day before an event registered by EMDAT, and late warnings are issued at the beginning or during the registered EDMAT flood event. Warning administration displays which administrations are mentioned in the news article.
Contain links shows the percentage of tweets containing links that potentially point to more information.
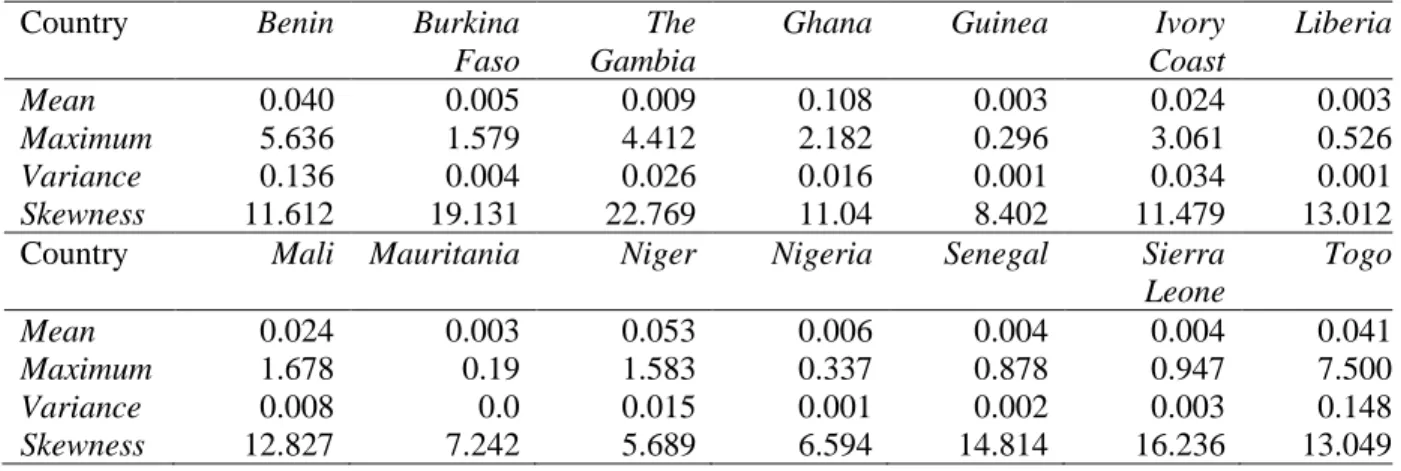
Administration abbreviations: NADMO - National Disaster Management Organisation, GMA – Ghana Meteorological Agency, VRA – Volta River Authority, SEMA – State Emergency Management Agency, NIHSA – National Hydrological Services Agency, Gov. – Government, NBA – Niger Basin Authority, Shiroro Hydroelectric Power Station, NOA - National Orientation Agency, KSG – Kwara State Government, FCT – Federal Capital Territory, DSG – Delta State Government. Note that for Burkina Faso and Ivory Coast, we do not distinguish between early and late warnings, as we do not have a flood event that we base the query on. ... 26 Table 4-3:Mean, maximum, variance, and skewness of the Flood Risk Indicator (FRI) for every country.
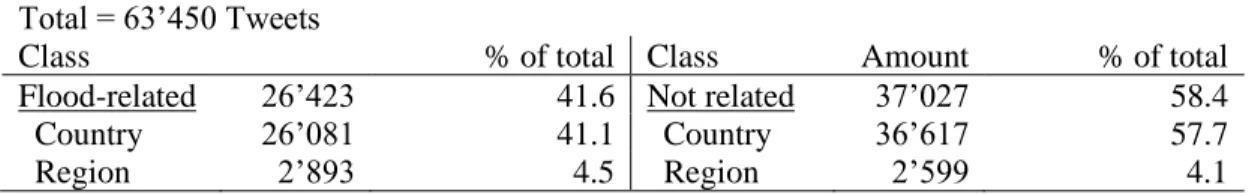
... 27 Table 4-4: Mean, maximum, variance, and skewness of number of daily rainfall exceedances > 20mm (NRE), normalized by the number of World Wide HYPE delineated basins, for every country. ... 28 Table 4-5: The total number of tweets and the percentage of tweets classified as flood-related and not related.
Furthermore, the levels at which the tweets are geo-located (country or regional) are indicated. Note that most tweets that are geo-located at a regional level are also located at a country level. ... 28 Table 4-6: Base activity ε
FRof flood-related tweets and ε
NFRof tweets containing the word flooding, but classified as not flood-related according to the natural language processing algorithm (BERT) over the years 2017-2020. ε
FRand ε
NFRare the average numbers of tweets inside the 10% and 90% quantile. d
FRand d
NFRindicate the number of days over which the average of tweets is calculated for ε
FRand ε
NFRrespectively. Example: In Benin, on average 3.34 flood-related tweets were posted over the 32 days
where the daily number of tweets did not fall below the 10 % or surpass the 90 % quantile. ... 29
Table 4-7: True positives (TP), false positives (FP), and false negatives (FN). A TP is noted when an event
detected by the algorithm and an increased FRI occur together. An FP is noted when an increased FRI
occurs without a detected event. An FN is noted when FEDA detected an event without an increased
FRI. POD
FEDAand FAR
FEDAindicate the probability of detection (POD) and false alarm rate (FAR)
based on tweets. POD
sand FAR
sindicate the POD and FAR based on streamflow exceednaces. In the
bottom row, the sum of TP, FP, and FN and the average of POD
FEDAand FAR
FEDAare noted. ... 32
x
Table 4-8: Correlation coefficients between flood-related tweets and the FRI with different features. The features include type (Spearman S), Seasonal (if yes, only values from May-Oct are included), Event (if yes, only forecasts and tweets during an event registered by the algorithm are included), and Lag (shifted tweets time-series between 1-5 days). The best correlations are highlighted in bold for every country.
The sum of the best correlations per column is shown in the bottom row. The underlined values indicate significance at a 5 % level. The p-values are listed in Table B-4 in the Appendix. ... 36 Table 4-9: Correlation coefficients between flood-related tweets and the FRI with different features. The features include type (Pearson P, Spearman S), Seasonal (if yes, only values from May-Oct are included), Event (if yes, only forecasts and tweets during an event registered by the algorithm are included), and Lag (shifted tweets time-series between 1-5). The best correlation is highlighted in bold for every country (with exception of Gambia). The sum of the best correlations per column is shown in the bottom row. Underlined values are significant at a 5 % level. The p-values are listed in Table B-5 in the Appendix. ... 37 Table 4-10: p-values of the Welch's test p
pre, p, and p
postbetween tweets during a FEDA detected event and outside. p
preincludes the FRI 5 days before and during a detected event into the event group, p only includes the FRI during a detected event, and p
postincludes the FRI during a detected event and 5 days after. In no case were both the event and no-event groups normally distributed according to the Shapiro- Wilk test. The results of the Shapiro-Wilk teste are displayed in Table B-6 in the Appendix. ... 38 Table B-1: Meta-sources ordered alphabetically, that show lists of newspaper, TV or radio sources, and the corresponding weblinks. ... V Table B-2: News sources ordered alphabetically and the corresponding weblinks. ... V Table B-3: Correlation coefficients between flood-related tweets and the FRI with different features. The features include type (Spearman S), Seasonal (if yes, only values from May-Oct are included), Event (if yes, only forecasts and tweets during an event registered by the algorithm are included), and Lag (shifted tweets time-series between -5 and 5 days). ... VI Table B-4: Correlation coefficients of flood-related tweets with the FRI with different features. The features include type (Spearman S), Seasonal (if yes, only values from May-Oct are included), Event (if yes, only forecasts and tweets during an event registered by the algorithm are included), and Lag (shifted tweets time-series between 1-5). The best correlation is highlighted in bold for every country. ... VII Table B-5: Correlation coefficients of flood-related tweets and corresponding p values with different features. The features include type (Pearson P, Spearman S), Seasonal (if yes, only values from May- Oct are included), Event (if yes, only forecasts and tweets during a FEDA detected event are included), and Lag (shifted tweets time series between -5-5). Underlined p-values are significant at a 5 % level.
... VIII
Table B-6: p-values of the Welch's test p
pre, p, and p
post. p
preincludes FRI 5 days before and during a detected
event into the event group, p only includes FRI during a detected event, and p
postincludes the FRI during
a detected event and 5 days after. Event
pre, Event, Event
postand No event
pre, No event, No event
postsignify
the event and no event group respectively. s and N show the sample size and normality of the group,
derived from the Shapiro-Wilk test. A value below 0.05 indicates a rejection of the null hypothesis that
the sample is normally distributed. ... IX
xi
List of Figures
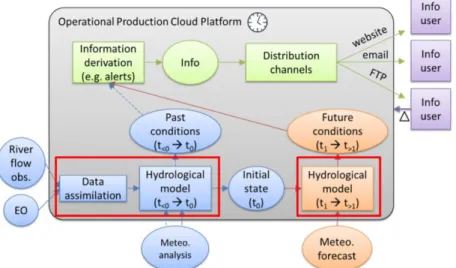
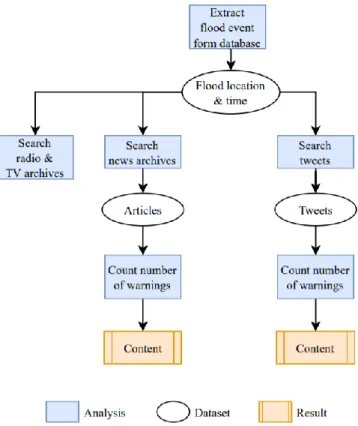
Figure 2-1: Disaster management cycle (black, solid), risk communication cycle (black, dashed), and its subset flood warning dissemination (red, dotted). Adapted from (Ping et al., 2016). ... 4 Figure 3-1: Components and data flow of the forecasting system within the Information and Communications Technology (ICT) dimension of FANFAR, taken from Andersson, 2020a. The red squares contain the hydrological modeling components. The blue shapes are data leading up to the initial state to model the future conditions (orange shapes). The green shapes show the dissemination of the result to the stakeholders (purple shapes). EO: Earth observation. ... 9 Figure 3-2: Example of a catchment divided into sub-catchments (SCs) or sub-basins (left) and the distribution of the corresponding HRUs (here named slc) for every SC (right). Taken from (SMHI, 2018).
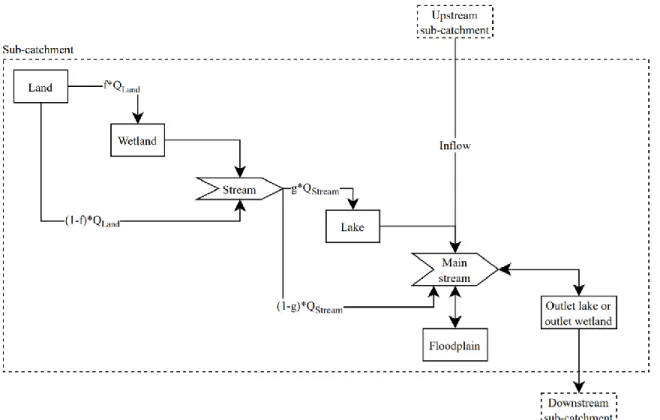
... 10 Figure 3-3: Horizontal elements within a sub-catchment (SC) modeling flow routing. Storages are displayed as rectangles and arrows. Q
Land- water from overland flow, f - fraction of overland flow reaching wetland, Q
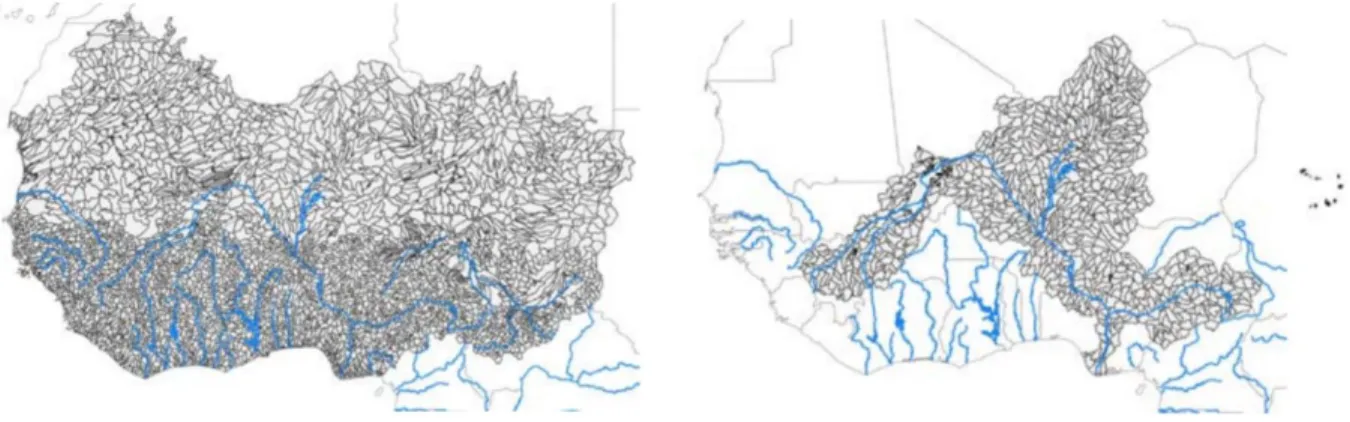
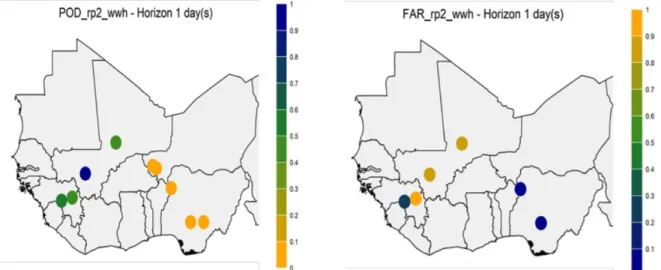
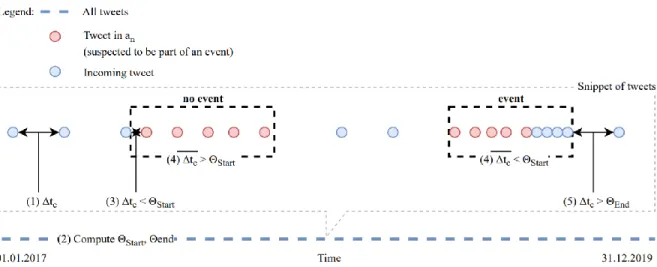
Stream- water from local flow, g - fraction of local flow reaching lake. Adapted from SMHI, 2020d. 11 Figure 3-4:Catchment delineation of the World Wide Hype (WWH, left) and the Niger-HYPE (right) before the adaptation to West Africa. Taken from (Andersson, 2020a). ... 12 Figure 3-5: Forecast skills of the World Wide HYPE (WWH) regarding probability of detection (POD) on the left and false alarm rate (FAR) on the right , assessed at 9 gauged locations (dots). Taken from (Andersson, 2020a). ... 14 Figure 3-6: Flowchart of the data collection process. Blue boxes show a data analysis step (e.g. the extraction of a flood event or the counting the number of warnings). White ovals show datasets, like articles or tweets, resulting from a data analysis step. This data is then put into the next analysis step. Yellow boxes indicate a result (i.e. early warning related content). ... 15 Figure 3-7: Flood event detection algorithm (FEDA) with steps (1)-(5) indicated, adapted from (de Bruijn et al., 2019). Abbreviations: Δt
c– Corrected time between tweets, Θ
Start, Θ
End– Thresholds for the start and end of an event, a
n– array of tweets suspected to be flood-related. ... 20 Figure 3-8: FANFAR forecasts, World Wide Hype (WWH) basin delineation, and subset level 0 (country, dark-blue) and level 1 (region, light-blue) borders for West Africa for the 19th of January 2017. The colors indicate the forecasted streamflow return period. No values can be mostly found in the desert area.
No danger (green) signifies no increased streamflow. Moderate (yellow), high (orange), and very high (red) indicate a return period of 2, 5, and 30 years respectively. ... 21 Figure 3-9: Lagged correlation between FRI (red) and number of tweets (green) for the lags -3 and 3 days.
The filled values (grey) are equal to the first respectively last value of the shifted time series. ... 24 Figure 3-10: Example of t-test sample group separations for the p-value types p
pre, p, and p
post, accounting for potential lags between the FRI and events detected by the Twitter algorithm. ... 24 Figure 4-1: Events detected by the sensitive algorithm (Algorithm, green) on the left and Events registered by EMDAT (EMDAT Events, blue) on the right for all 14 countries. Note that both y-axes are logarithmic. ... 27 Figure 4-2: Distribution of languages of all tweets, regardless of relatedness to flooding. ... 28 Figure 4-3: Time series of Ghana for EMDAT events (blue bar), FRI (red, dashed), flood-related and -
unrelated tweets (black and yellow bar), and precipitation exceedances (purple bar). The yellow bars
display the tweets not related to flooding, and the black bars show the tweets that have been identified
as flood-related by the classification algorithm. Furthermore, the duration of events identified by the
detection algorithm is displayed in green. The intensity of the event can be deduced from the number of
black bars inside the green area. True positives (TP), false positives (FP), and false negatives (FN) are
indicated as triangles. ... 30
xii
Figure 4-4: Time series of Niger for EMDAT events (blue bar), FRI (red, dashed), flood-related and - unrelated tweets (black and yellow bar), and precipitation exceedances (purple bar). The yellow bars display the tweets not related to flooding, and the black bars show the tweets that have been identified as flood-related by the classification algorithm. Furthermore, the duration of events identified by the detection algorithm is displayed in green. The intensity of the event can be deduced from the number of black bars inside the green area. True positives (TP), false positives (FP), and false negatives (FN) are indicated as triangles. ... 31 Figure 4-5: Probability of detection (POD) based on FEDA (POD
FEDA, left) and streamflow (right, POD
s, see Section 3.1.3). The red-dashed circles indicate the Upper Niger (1) and Lower Niger (2) basin. ... 33 Figure 4-6: False alarm rate (FAR) based on FEDA (left) and streamflow (right, see Section 3.1.3). The red-
dashed circles indicate the Upper Niger (1) and Lower Niger (2) basin. ... 33 Figure 4-7: Spearman correlation coefficients between FRI and tweets for the whole time series r
s(left) and only during events predicted by FEDA with the sensitive configuration r
s,sen(right). ... 34 Figure A-1: The dimensions of FANFAR. The green dimension shows the information and communication technology ICT, the blue dimension displays behavior and decisions and the orange dimension is concerned with a sustainable implementation of the project. Taken from (SMHI, 2020b). ... I Figure A-2: Water flows in the vertical component (HRU) in HYPE. The numbers 1-3 indicate the soil layer.
Adapted from (SMHI, 2020d). ... II Figure A-3: Overview of the TAGGS to geotag Tweets. (1) In the toponym (i.e. name of a location) recognition, contiguous words are compared to a gazetteer (dataset containing known location names).
For every toponym mentioned in the text, one or more candidate locations CL are extracted. (2) A scoring system is then applied to choose the most probable CL, based on additional info Twitter users can include in their profile or tweet (time zone, user hometown, other locations). (3) The tweets are then grouped under the assumption, that tweets containing identical toponyms in a certain timeframe refer to the same. (4) Subsequently, within every group, the average score of every candidate location is computed. For example, if 5 Tweets are in a group with three candidate locations, the 5 individual scores (calculated in the scoring step) of every Tweet are averaged for every candidate location. This yields 3 averaged values (one for every candidate location. (5) Finally, the CL with the highest score is assigned to the tweet. Adapted from (de Bruijn et al., 2017). ... III Figure B-1: Comparison of tweets, forecasts, rainfall exceedances, and EMDAT events during the rainy season for the years 2017-2019 in Benin. Note that the y-axis of the Tweets is logarithmic. P: Rainfall, R: Return period, NR: Tweets not related to flooding, FR: Tweets related to flooding. ... X Figure B-2: Comparison of tweets, forecasts, rainfall exceedances, and EMDAT events during the rainy season for the years 2017-2019 in Burkina Faso. Note that the y-axis of the Tweets is logarithmic. P:
Rainfall, R: Return period, NR: Tweets not related to flooding, FR: Tweets related to flooding. ... X Figure B-3: Comparison of tweets, forecasts, rainfall exceedances, and EMDAT events during the rainy season for the years 2017-2019 in the Gambia. Note that the y-axis of the Tweets is logarithmic. P:
Rainfall, R: Return period, NR: Tweets not related to flooding, FR: Tweets related to flooding. ... XI Figure B-4:: Comparison of tweets, forecasts, rainfall exceedances, and EMDAT events during the rainy season for the years 2017-2019 in Ghana. Note that the y-axis of the Tweets is logarithmic. P: Rainfall, R: Return period, NR: Tweets not related to flooding, FR: Tweets related to flooding. ... XI Figure B-5: Comparison of tweets, forecasts, rainfall exceedances, and EMDAT events during the rainy season for the years 2017-2019 in Guinea. Note that the y-axis of the Tweets is logarithmic. P: Rainfall, R: Return period, NR: Tweets not related to flooding, FR: Tweets related to flooding. ... XII Figure B-6: Comparison of tweets, forecasts, rainfall exceedances, and EMDAT events during the rainy season for the years 2017-2019 in Ivory Coast. Note that the y-axis of the Tweets is logarithmic. P:
Rainfall, R: Return period, NR: Tweets not related to flooding, FR: Tweets related to flooding. ... XII
xiii
Figure B-7: Comparison of tweets, forecasts, rainfall exceedances, and EMDAT events during the rainy season for the years 2017-2019 in Liberia. Note that the y-axis of the Tweets is logarithmic. P: Rainfall, R: Return period, NR: Tweets not related to flooding, FR: Tweets related to flooding. ... XIII Figure B-8: Comparison of tweets, forecasts, rainfall exceedances, and EMDAT events during the rainy season for the years 2017-2019 in Mali. Note that the y-axis of the Tweets is logarithmic. P: Rainfall, R: Return period, NR: Tweets not related to flooding, FR: Tweets related to flooding. ... XIII Figure B-9: Comparison of tweets, forecasts, rainfall exceedances, and EMDAT events during the rainy season for the years 2017-2019 in Mauritania. Note that the y-axis of the Tweets is logarithmic. P:
Rainfall, R: Return period, NR: Tweets not related to flooding, FR: Tweets related to flooding. ... XIV Figure B-10: Comparison of tweets, forecasts, rainfall exceedances, and EMDAT events during the rainy season for the years 2017-2019 in Niger. Note that the y-axis of the Tweets is logarithmic. P: Rainfall, R: Return period, NR: Tweets not related to flooding, FR: Tweets related to flooding. ... XIV Figure B-11: Comparison of tweets, forecasts, rainfall exceedances, and EMDAT events during the rainy season for the years 2017-2019 in Nigeria. Note that the y-axis of the Tweets is logarithmic. P: Rainfall, R: Return period, NR: Tweets not related to flooding, FR: Tweets related to flooding. ... XV Figure B-12: Comparison of tweets, forecasts, rainfall exceedances, and EMDAT events during the rainy season for the years 2017-2019 in Senegal. Note that the y-axis of the Tweets is logarithmic. P: Rainfall, R: Return period, NR: Tweets not related to flooding, FR: Tweets related to flooding. ... XV Figure B-13: Comparison of tweets, forecasts, rainfall exceedances, and EMDAT events during the rainy season for the years 2017-2019 in Sierra Leone. Note that the y-axis of the Tweets is logarithmic. P:
Rainfall, R: Return period, NR: Tweets not related to flooding, FR: Tweets related to flooding. ... XVI
Figure B-14: Comparison of tweets, forecasts, rainfall exceedances, and EMDAT events during the rainy
season for the years 2017-2019 in Togo. Note that the y-axis of the Tweets is logarithmic. P: Rainfall,
R: Return period, NR: Tweets not related to flooding, FR: Tweets related to flooding. ... XVI
xiv
1
1. Chapter: Introduction
Water is indispensable for life. However, every year water-related disasters, such as floods, cause death, and billion-dollar losses all over the world (Perera et al., 2019). 23% of all floods hit Africa, which makes it the second most affected continent after Asia (Perera et al., 2019). In 2010, more than 1 million people were affected by floods in 20 African countries (Dessalegn and Akalu, 2015) and in 2015-2016 the continent faced the most severe El Niño in decades. Besides physical damage, floods can lead to an outbreak of infectious diseases, such as Malaria, and expose people to toxic substances (Dessalegn and Akalu, 2015).
Furthermore, the situation in Sub-Saharan African (SSA) countries will likely be exacerbated in the future (van Niekerk and Nemakonde, 2017). The majority of SSA’s disasters are of hydrometeorological origin and are expected to increase in frequency and magnitude due to climate change (van Niekerk and Nemakonde, 2017) and lead to unprecedented floods (Besada and Sewankambo, 2009). This high exposure to flood disasters in tandem with a low adaptive capacity makes Africa one of the most vulnerable continents (Dessalegn and Akalu, 2015), not least due to the rapid human settlement growth (Ahadzie and Proverbs, 2011).
In general, two types of measures are available to protect the population from flooding: Structural and non-structural measures. On the one hand, structural measures, such as dams or weirs, store runoff (Madamombe, 2004) or pose a physical barrier to the flood. Non-structural measures, on the other hand, include flood early warning systems (FEWS) and settlement policies (Madamombe, 2004). In general, an early warning system (EWS) should disseminate warning information to individuals so that they can respond to an imminent threat (UNISDR, 2009) and harm and economic losses can be mitigated (UNEP, 2012) . An increase in preparedness for disasters of the population decreases deaths (Gwimbi, 2007). FEWS are already operational in various countries, e.g. the European Flood Awareness System (EFAS) in continental Europe or the Flood Forecasting & Warning Service in Australia (Emerton et al., 2016). The UN Office for Disaster Risk Reduction advocates for the strengthening of FEWS (Perera et al., 2019), also in light of the sustainable development goals (SDGs). Yet there is a lack of adequate FEWS in low-income countries (UNEP, 2012).
Challenges in the implementation of FEWS include communication with stakeholders and the forecast model accuracy. Firstly, the communication from the FEWS derived information to the stakeholders is vital for the success of an EWS (UNEP, 2012), as the communication to those most at risk influences the effectiveness of natural hazard management (van Niekerk and Nemakonde, 2017). The information must be effectively passed down to the end-user via various media, like newspaper, television, and radio (UNEP, 2012). Therefore, media, are key stakeholders in warning dissemination (Ganiyu et al., 2017a).
Nevertheless, the involvement of e.g. West African media in flooding has been criticized to be focused on the provision of relief measures rather than warning the population (Ahadzie and Proverbs, 2010; Ahadzie and Proverbs, 2011; Ganiyu et al., 2017a; Ganiyu et al., 2017b). Secondly, there is a trade-off between the warning lead-time and the prediction accuracy of a FEWS (UNEP, 2012). On the one hand, false alarms cause people to not take flood warnings seriously (Gwimbi, 2007; Madamombe, 2004). On the other hand, a flood without a preceding warning leaves the population unprepared. Therefore, the predictive capabilities of FEWSs need to be improved (UNEP, 2012; Perera et al., 2019).
Communication to reach potential flood victims needs improvement (Madamombe, 2004). Also, people
must be educated at a local level on how to react to flood hazards (Madamombe, 2004). For example,
newspapers in Nigeria feature disaster risk communication. However, around 80 % of the flood-related
texts are not prominently placed and around 20 % of texts are published before an actual event (Ganiyu
et al., 2016; Ganiyu et al., 2017a). In Ghana, around 3 % of news contains flood warnings and 8 % of news
raises awareness on how to behave during a hazard (Ahadzie and Proverbs, 2011). Furthermore, social
2
media is increasingly used as an information source for disasters (de Bruijn et al., 2017). Tweets related to flooding correlate with flood events in space and time (Fuchs et al., 2013) and can therefore be used to detect and locate floods (Rossi et al., 2018; de Bruijn et al., 2019). Tweets also proved helpful to predict areas at risk of flooding (Smith et al., 2015), augment flood risk information in the form of maps (Lorini et al., 2019), or serve as a proxy variable for rainfall (Restrepo-Estrada et al., 2018). Flickr also facilitates event detection with tags appended to images (Naoko Nitta and Babaguchi, 2014; Ling Chen, 2009). The use of social media in Africa is, except for Facebook, increasing (Statcounter, 2020).
We found that literature concerning flood warning communication is confined to a specific region and selected newspapers and that literature concerning FEWSs did not address the incorporation of social media in West Africa. We aim to close these research gaps by investigating the current warning dissemination in West African media and by analyzing how forecasts of a FEWS can be assessed with the help of social media. We broadened the spatial extent of news coverage and systematically searched online newspaper databases, radio and TV archives, and social media during flood events in the whole of West Africa. We then evaluated whether flood warning dissemination is included in the media to establish a baseline of the current practice of flood warning dissemination in West Africa. Furthermore, we compared the spatial, temporal, and quantitative occurrence of tweets and forecasted flood severity. We found that Twitter has the most instruments already available for our purpose (flood text classification, flood detection algorithm) compared to other social media. We investigated if tweets can be used to assess the performance of a FEWS in tandem with authoritative data series (rainfall and streamflow). We based our research on the FEWS Reinforced cooperation to provide operational flood forecasting and alerts in West Africa (FANFAR), which is currently being developed with local stakeholders and aims to provide flood risk forecasts 10 days ahead (SMHI, 2020b). Based on the research gap we identified, we aim to address the following research questions (RQs):
RQ1: How is flood risk communication currently disseminated in media (newspaper, radio, TV, and social media) in West Africa?
• RQ1.1: How does flood warning dissemination in media differ regarding content and channel between flood events of different magnitudes?
• RQ1.2: How does flood warning dissemination in media differ regarding content and channel between countries in West Africa?
RQ2: Can social media be used to assess the performance of FANFAR in West Africa?
• RQ2.1: How much does increased social media activity in a specific region in West Africa correspond to registered flood events from a flood event database?
• RQ2.2: How much does enhanced tweet activity correspond to an increased flood risk by FANFAR in a specific region in West Africa?
• RQ2.3: Can other media support the assessment of the performance of FANFAR?
3
2. Chapter: Literature Review
We reviewed both academic and grey literature. For academic literature, we used the online databases of Google Scholar and Web of Science and for grey literature Google.
Firstly, we defined a set of keywords with combinations of the words displayed in Table 2-1, to find an initial body of literature.
Secondly, we applied the snowballing procedure, including forward and backward snowballing, as described by Wohlin, 2014.
Using forward snowballing, we identified papers based on citations in the paper currently investigated. Backward snowballing, in contrast, is conducted by investigating the list of references attached to the document under consideration and identifying potentially suitable literature. Finally, we directly looked up the authors.
2.1 FEWS Warning Dissemination in West African Media 2.1.1 Early Warning Dissemination in FEWS
Definition of an EWS and FEWS
An EWS can be understood as “an integrated system of hazard monitoring, forecasting and prediction, disaster risk assessment, communication and preparedness activities systems and processes that enable individuals, communities, governments, businesses and others to take timely actions to reduce disaster risks in advance of hazardous events” (UNISDR, 2017, p. 17), or as a “[...] set of capacities needed to generate and disseminate timely and meaningful warning information to enable individuals, communities and organizations threatened by a hazard to prepare and to act appropriately and in sufficient time to reduce the possibility of harm or loss.” (UNISDR, 2009, p. 12). A FEWS is a type of EWS and consists of “Provision of specific forecasts relating to rainfall for both quantity and timing, for which numerical weather-prediction models are necessary” (WMO, 2011, p. 1-6), an “Establishment of a network of manual or automatic hydrometric stations, linked to a central control by some form of telemetry” (WMO, 2011, p. 1 - 6) and
“model software, linked to the observing network and operating in real time” (WMO, 2011, p. 1 - 6).
However, the terminology around EWSs is not consistent in the literature (UNDRR, 2006). Examples of FEWSs include the European Flood Awareness System (EFAS) in continental Europe, the Flood Forecasting & Warning Service in Australia (Emerton et al., 2016), and FANFAR in West Africa. Note, that in the three EWS/FEWS definitions, the communication, dissemination, and provision of risk are highlighted.
Table 2-1: Research questions (RQ) and the corresponding search terms to find an initial body of literature. The research questions are specified in subsequent sections. A * indicates a wildcard
RQ Keywords
RQ1 Africa, emergency risk communication, flood*, flood early warning system, flood warning dissemination Africa, flood warning Africa, implementation, evaluat* media reduction flood risk, media analys*, methodology media analy*, news fram*, newspaper analys*, print media flood risk communication, warn*
RQ2 classification, flood*, tweet, Twitter, Facebook, Flikr, social media, online scrap* algorithm, event detect*, detect*
algorithm
4 Risk communication in FEWSs
Risk communication is a vital part of any EWS, as a scientifically sound forecast will contribute little to mitigate the effects of a hazard if the communication is not understood (Baudoin et al., 2014, UNEP, 2012). Risk communication is concerned with informing the decision-makers, experts, and the affected public about a risk situation (Höppner et al., 2010;
Rollason et al., 2018). Early warning is a subset of risk communication (Figure 2-1). It is the communication step between the forecast itself and the subsequent actions taken by e.g.
authorities or local communities (Cools et al., 2016). Warning dissemination typically starts with scientific sources that channel warnings through government decision-makers and the media (UNDRR, 2006). The information should reach multiple actors, including emergency services, operators of utilities, economic service providers, and others, who themselves may act as onward disseminators (UNDRR, 2006). Warnings can be disseminated to
a targeted or broad audience on different levels (e.g. local or regional) and via various channels, like newspaper, radio, and TV (UNEP, 2012) and formats, like visual or printed (Macnamara, 2005). The warning message content needs to be tailored to the recipients, such as non-governmental organizations (NGO)s or villagers (Ping et al., 2016; Seeger et al., 2018) and usually takes the form of “top-down”
communication (Perera et al., 2019). Also, the timeliness of warning dissemination influences the effectiveness of early warning messages (Seeger et al., 2018). In a nutshell, warning messages are characterized through content, channel, format, and timing and media are key stakeholders in warning dissemination (Ganiyu et al., 2017a).
The role of media in early warning dissemination
Traditional media, such as television, radio, and newspaper, are commonly used to disseminate emergency information (Dessalegn and Akalu, 2015; Perera et al., 2019; Ruggiero and Vos, 2014; Seeger et al., 2018), and play a crucial role in communicating natural hazards (Höppner et al., 2010; UNDRR, 2006). Also, social media gained importance in disseminating warning messages (Castillo, 2016; Imran et al., 2015; Palen and Anderson, 2016; Smith et al., 2015), and creating situational awareness (Vieweg, 2012). Media can be investigated using content analysis, which entails analyzing text, ranging from interview transcripts to newspapers, television, or advertisement (Macnamara, 2005).
2.1.2 Content Analysis of Flood Related Issues in West African Media
Content analysis of West African newspapers showed that in Nigeria, out of 500 stories about flooding during 2012, predominantly in the form of news, around 20 % were published before an event (Ganiyu et al., 2016; Ganiyu et al., 2017a). Similarly, out of 167 issues from 20 different newspapers in Ghana between 2000 and 2010, around 3 % featured warning messages, and 7 % were concerned with educating the population about floods (Ahadzie and Proverbs, 2011). The other articles mostly reported on causes of floods or relief items provided by governmental and non-governmental organizations, likely due to political incentives (Ahadzie and Proverbs, 2011), i.e. the government wants to show that it cares about the population. The content does not only vary between newspapers, but also between the narrators crafting the news content (government, NGOs, local communities). In Nigeria for example, governmental agencies and
Figure 2-1: Disaster management cycle (black, solid), risk communication cycle (black, dashed), and its subset flood warning dissemination (red, dotted).
Adapted from Ping et al., 2016.
5
local communities tend to blame the cause of flooding on humans for not obeying the law, while NGOs see the cause of flooding in climate change and human factors (Adekola and Lamond, 2017).
We found that the importance of media in warning dissemination is acknowledged by the scientific community. However, we discovered that research mostly focuses on overarching topics such as governance of natural hazards or flood risk practices. Little is known about flood warning dissemination through media, especially in West Africa. Newspaper content analysis is limited on the most prominently circulated issues in West Africa in a few countries and to the best of our knowledge, no research has been conducted on flood warning dissemination in newspapers, radio, TV, and social media. Furthermore, the relationship between flood event magnitude and warning dissemination has not been addressed. We aim to close this research gap by analyzing flood early warning dissemination based on flood events in West Africa.
2.2 Incorporating Social Media in FEWSs 2.2.1 Twitter in Flood Forecasting
Social media and hazard detection
The World Wide Web allows millions of people to access a plethora of online information worldwide (UNEP, 2012). In recent years, “social media, and in particular Twitter, has gained traction as a novel source of information on disaster events” (de Bruijn et al., 2017, p. 1), and in event detection (de Bruijn et al., 2017; Musaev et al., 2015; Rossi et al., 2018). Information disseminated via social media can improve circumstantial awareness in a crisis (Vieweg, 2012). Therefore, services employing Twitter have been developed to create awareness during a disaster. For example, the Emergency Situation Awareness (ESA) increases situational awareness by displaying hazard-relevant tweets on a map, especially for earthquakes (Yin et al., 2012). Another example is the Artificial Intelligence for Disaster Response (Lucas et al., 2014) of harvesting hazard-related tweets to increase awareness of danger. Usually, these services consist of an overview of crisis-related social media and its temporal and spatial characteristics (Imran et al., 2015).
Although other social media (e.g. Flickr) were used for general event detection, such as “housewarming”
(Ling Chen, 2009) or “fireworks displays” (Naoko Nitta and Babaguchi, 2014), we found that mostly Twitter was used for hazard detection management.
Twitter and flood hazards
Twitter is a microblogging platform where users can post messages containing up to 240 characters, images, and videos and it is the most studied social media platform in hazard management (Simon et al., 2015). Its popularity roots in the user-friendly Application Programming Interface (API), which offers a free extraction of data (Imran et al., 2015; Rossi et al., 2018). The Twitter API allows to programmatically obtain and analyze data and chat on Twitter (Twitter, n.d.). Twitter has also been studied in flood risk research, since recent advances in e.g., smartphones can enhance flood forecasting and monitoring with
“big data” (Horita et al., 2017) and increase the spatial extent where data is available (Restrepo-Estrada
et al., 2018). For example, from 5 million tweets collected over eight months in Germany, a correlation was
found between flooded locations and the location where flood-related tweets were posted (de Albuquerque
et al., 2015; Fuchs et al., 2013). On a global scale, tweets reporting flood hazards coincided with the timing
and location of the hazard (de Bruijn et al., 2019). It is therefore suggested that tweets (and potentially other
social media such as Flickr, YouTube, Facebook) can serve as a complementary source of information
(Fuchs et al., 2013; Rossi et al., 2018) for flood monitoring and forecasting (de Bruijn et al., 2019; Lorini
et al., 2019; Rossi et al., 2018; Smith et al., 2015).
6 Twitter and its application to FEWSs
We identified two main uses of social media in the context of FEWSs: (1) Social media can be used reactively to infer where a hazard is taking place and how severe it is (de Bruijn et al., 2019; Lorini et al., 2019; Rossi et al., 2018) and (2) social media can be used to calibrate, validate, and improve hydrodynamic models (Restrepo-Estrada et al., 2018; Smith et al., 2015).
(1) Inference on hazards: Twitter can be incorporated into FEWSs as an additional service. Tweets are collected either when a region is deemed prone to flooding (Lorini et al., 2019, Rossi et al., 2018) or when a threshold of tweet occurrence is reached (Smith et al., 2015). The collected tweets are then used in FEWSs for flood risk communication using maps (Lorini et al., 2019), in warning messages (Rossi et al., 2018) and to identify flood risk areas (Smith et al., 2015). Tweets have proven to be well in line with the reports of emergency personnel (Rossi et al., 2018) or increased news coverage (Fuchs et al., 2013).
(2) Model validation: Social media help in forecast validation. Again, flood-related social media posts are stored and subsequently compared to model results or registered events. For example, Twitter was employed to select a suitable hydrodynamic model in the United Kingdom, based on the criteria depth and velocity that could be extracted from collected tweets (Smith et al., 2015). Also, floods can be located (i.e.
when and where a flood is taking place) with Twitter. 88 million tweets in 12 languages were collected globally and only the flood-related tweets were kept (de Bruijn et al., 2019). Results show that floods were detected that were not registered by flood databases (de Bruijn et al., 2019). Furthermore, tweets related to rainfall were used as a proxy variable for rainfall to generate a non-authoritative (i.e. not measured remotely or on the ground) data series in São Paulo (Restrepo-Estrada et al., 2018). The resulting data series were then used jointly with authoritative data series to calibrate a hydrological model (Restrepo-Estrada et al., 2018). This lead to improvements in estimating streamflow compared to only employing authoritative data (Restrepo-Estrada et al., 2018). Similarly, flood forecasts improved with the inclusion of crowd-sourced water levels together with static sensors (Mazzoleni et al., 2017). Tweets can also help to close measurement gaps due to malfunctioning measurement devices or to reduce inconsistencies in data series (Restrepo-Estrada et al., 2018). Regardless of the application of Twitter in FEWSs, flood events need to be detected based on tweets.
2.2.2 Flood Event Detection with Twitter
Three steps are required to detect events based on Twitter: (1) Tweets need to be geo-located to conclude their spatial occurrence, (2) tweets need to be filtered, based on the application (in our case tweets need to be flood-related), and (3) a criterion for the identification of events (in our case flooding) must be defined.
(1) Geolocation
A Twitter user can decide if they allow attaching exact geographic information to their tweet (Twitter,
2009) in the form of GPS coordinates (Twitter, 2020b) which is the case for around 2 % of all tweets
(Leetaru et al., 2013). Besides, the user can refine the precise geographic information by tagging a location
like a city or neighborhood (Twitter, 2020a). Tweets without GPS coordinates or a shared location need
additional steps for a location assignment. Assigning a location to a tweet is referred to as geotagging
(de Bruijn et al., 2017; Imran et al., 2015) and can be achieved by either using the specified GPS coordinates
or by applying geolocation algorithms. Most geolocation algorithms use toponym recognition, which
extracts a location from the text of a tweet (e.g. “Accra” from “Heavy floods hit Accra”), and toponym
resolution, which rules out ambiguities (e.g. multiple places in the world are called London) (de Bruijn
et al., 2017, Imran et al., 2015). Toponym resolution and recognition require a pre-defined set of locations,
called a gazetteer (de Bruijn et al., 2017), to which the extracted location is compared. However, gazetteers
are usually limited to unambiguous places with a large population (Amitay et al., 2004; Schulz et al., 2013),
7
i.e. only Paris, the capital of France, would be listed. Named Entity Recognition (NER) is a more sophisticated approach, which considers grammar and context (Al-Rfou et al., 2015) to extract locations.
However, the common and error-prone language used on Twitter poses a problem for NER (Li et al., 2012), since misspelled words might not be recognized. To mitigate the negative effect of a limited gazetteer on the geolocation process, further information provided in a tweet can be extracted, such as the location field, referenced websites, and the time zone (Schulz et al., 2013). de Bruijn et al., 2017 developed the Toponym- Based Algorithm for Grouped Geoparsing of Social Media (TAGGS) based on Schulz et al., 2013, which employs this additional information.
(2) Classification
It is vital to identify only the hazard-related tweets that contain useful information for further application, e.g. to identify flood events (Imran et al., 2015). The approaches for classifying tweets range from simple keyword filtering to advanced machine learning methods (MLMs). MLMs are mathematical models that can learn to recognize patterns (e.g. in the text) on their own (Keijsers, 2010). Simple keyword filtering, which allows selecting tweets that must contain a substring (e.g. “flood” or “flooding”), was applied by multiple authors to find flood-relevant tweets (Fuchs et al., 2013, Restrepo-Estrada et al., 2018). However, simple filtering methods, such as using keywords, will classify the sentence “my mail is flooded with spam”
as flood-related (Lorini et al., 2019). Such false positives can be mitigated with classifying algorithms that were trained on an example set of flood-related tweets. Common practices to collect tweets are described in Imran et al., 2015. A newer approach incorporating MLMs was developed by de Bruijn et al., 2019. The authors also included hydrologic data and managed to improve the precision and recall of their classification algorithm (de Bruijn et al., 2020). Besides the classification of a tweet in a single language, experiments to assess the transferability of an algorithm to new languages were conducted. For example, Lorini et al., 2019 provided a method to apply a classifying algorithm to a new language, and de Bruijn et al., 2019 collected and classified tweets in 12 languages. After tweet classification, we can assess whether they are related to an event.
(3) Event detection
We found that most event detection approaches are based on keyword bursts. However, other methods and domain-specific approaches have also been developed (Imran et al., 2015). Events can be detected under the assumption that an increase in usage of a word in tweets indicates a new event (Imran et al., 2015).
For example, authors compared the actual and expected or historical probability or frequency of a word in
a tweet occurring during a fixed time window. If the actual probability of frequency surpasses the expected
or historic one, a word is deemed to be “bursty” (Power et al., 2014; Yin et al., 2015), and an event is
assumed to take place. Also, tweet bursts can be detected by searching tweets sequentially and not in a fixed
time window, where a suspected burst is rejected or confirmed based on subsequently posted tweets
(SEQAVG, see e.g. Riley, 2008). Further, the criterion when a word is “bursty” can be adapted to the time
of day (people likely tweet less at night than during the day) and the general tweet activity in a country
(de Bruijn et al., 2019). The use of Twitter in event detection has, however, its drawbacks.
8 Drawbacks of Twitter in Hazard Detection
Drawbacks to using Twitter as a data source include that reporting a hazard can occur away from the hazard location (Fuchs et al., 2013) or that information useful for inclusion into modeling is usually disseminated after the event (Smith et al., 2015), making harvesting of tweets during an event impossible.
Furthermore, only using one form of social media is limiting and does not provide a complete view of a crisis (Imran et al., 2015). Besides, the large number of tweets that is not related to a hazard needs to be filtered before they can be applied to hazard management (Fuchs et al., 2013; Li et al., 2012), and literals and jargon make it difficult for some algorithms to classify tweets correctly (de Bruijn et al., 2017; Fuchs et al., 2013; Li et al., 2012; Yin et al., 2015). Finally, only 2% of tweets are geotagged (Leetaru et al., 2013), calling for algorithms necessary to identify the correct location of the tweets.
2.2.3 Assessment of FEWSs in West Africa
We discovered that social media and especially Twitter have been used in EWSs to increase situational
awareness during a crisis, to detect hazardous events, and to improve hydrologic models. However, we
found that research in that area was predominantly conducted in Europe. Little research has been conducted
in low-income countries. Furthermore, to the best of our knowledge, social media has not yet been used to
assess the performance of a FEWS. We aim to close this research gap by investigating if social media can
be used to assess the FEWS FANFAR.
9
3. Chapter: Methods
3.1 Case Study 3.1.1 FANFAR
FANFAR is a FEWS and an EU funded Horizon 2020 project that aims to provide short- and medium- term hydrological forecasts of up to 10 days to key stakeholders (SMHI, 2020a). The forecast system is designed to be reliable and robust and to disseminate relevant information at the right time (SMHI, 2020a).
The FANFAR project consists of the Information and Communications Technology (ICT), the decision analysis dimension, and the system sustainability dimension (Figure A-1 in the Appendix). The ICT dimension is concerned with adapting current and developing new ICTs in collaboration with stakeholders (SMHI, 2020b). The behavior and decision dimension investigates the stakeholders’ preferences and behavior to enhance the decision-making and technology adoption processes (SMHI, 2020b). Finally, the sustainability dimension scrutinizes the inclusion of West African institutions, the long-term challenges and constraints, and opportunities (SMHI, 2020b). Inside the ICT dimension lays the forecasting and alert system (Figure 3-1). River flow and earth observations are fed into the hydrological model. With the help of meteorological analysis, the past and the initial state of the modeling domain are determined. The initial state is then used to generate future conditions. Based on past and future conditions, a risk level in the form of a return period (2 years, 5 years, or 30 years) is determined and communicated to the stakeholders.
Figure 3-1: Components and data flow of the forecasting system within the Information and Communications Technology (ICT) dimension of FANFAR, taken from Andersson, 2020a. The red squares contain the hydrological modeling components. The blue shapes are data leading up to the initial state to model the future conditions (orange shapes). The green shapes show the dissemination of the result to the stakeholders (purple shapes). EO: Earth observation.
10
3.1.2 Forecast Model
It is crucial to understand the forecast model behind any FEWS to understand its strengths and weaknesses and include them in the FEWS evaluation. The subsequent information is, if not specified otherwise, taken from Andersson, 2020a. In the context of FANFAR, the hydrological model predicts the effects of meteorology on the river flow, water level, and soil moisture content. A suitable model for FANFAR should fulfill three points: Firstly, the model should already be operational somewhere else.
Secondly, the input files should be updated daily, and calibration and enhancing catchment delineation should be conducted if seen appropriate. Thirdly, the model should have adequate performance on a daily scale. Therefore, Andersson, 2020a, deemed the model Hydrological Predictions for the Environment (HYPE) developed by the Swedish Meteorological and Hydrological Institute (SMHI) appropriate to be used in the FANFAR context.
3.1.3 The HYPE Model
General
HYPE is a semi-distributed hydrological model mainly used to simulate water flows and quality (SMHI, 2018). It is driven by temperature and rainfall data and its domains are organized in the form of sub- catchments (SCs) or sub-basins that can be attributed to hydrological response units (HRUs), e.g. land use, soil type, and elevation (Lindström, 2017, Figure 3-2). The HRUs can be structured with a maximum of three soil layers with a specified thickness (see Lindström, 2017 for details). Multiple SCs then build a river catchment (Figure 3-2).
Figure 3-2: Example of a catchment divided into sub-catchments (SCs) or sub-basins (left) and the distribution of the corresponding HRUs (here named slc) for every SC (right). Taken from SMHI, 2018.
11 Elements of a sub-catchment
Horizontal components: The water moves, after falling on land, through the different storages (Figure 3-3). Firstly, a fraction f of the runoff Q
landfrom the land storage is routed to the wetland, whilst the rest is routed directly to a local stream. Again, the flow is diverted, and one part g of the flow Q
Streamis routed via an internal lake, whilst the other part (1-g)*Q
Streamof the local stream runoff flows directly into the main stream. The main stream exchanges water bi-directionally via a floodplain. Furthermore, the inflow from the upstream SC is added. Finally, the water flows into a lake or wetland and is routed to the next downstream SC.
Figure 3-3: Horizontal elements within a sub-catchment (SC) modeling flow routing. Storages are displayed as rectangles and arrows. QLand - water from overland flow, f - fraction of overland flow reaching wetland, QStream - water from local flow, g - fraction of local flow reaching lake. Adapted from SMHI, 2020d.
Vertical components: Every storage (Figure A-2 in the Appendix) is explained in detail in SMHI, 2020d. In general, only the land-storage can contain multiple components, such as snow, glacier, and up to three soil layer components. Processes such as precipitation, evapotranspiration, surface runoff, etc.
influence the water balance. All other storages are single component storages and their water balance is
dependent on inflows, outflows, or water abstractions, amongst others. The detailed formulas for
evapotranspiration, temperature, and other adjustments are provided in SMHI, 2020c.
12 The adaptation of HYPE to West Africa
Andersson, 2020a adapted the HYPE model for the usage in West Africa, as described in the following.
Two versions of HYPE are currently used in the context of FANFAR: The World Wide HYPE model (WWH) and the Niger-HYPE model. We focus on WWH since we used it in our analysis. However, the Niger-HYPE model is included in the subsequent explanation for the sake of completeness. WWH covers a larger domain than Niger-HYPE (Figure 3-4) and contains more SCs at a finer spatial resolution (Table 3-1).
Table 3-1: Characteristics of the WWH and the Niger-HYPE sub-catchments (SCs). Adapted from Andersson, 2020a.
Model WWH Niger-HYPE
Domain West African hydrological basins
(8.6 million km
2)
Niger River basin (2.1 million km
2)
Number of SCs [-] 4581 803
Average SC size [km
2] 1870 2619
FANFAR requires a daily forecast production to warn the stakeholders concerning future threats. WWH was evaluated against 106 streamflow gauges in West Africa and yielded a Kling-Gupta Efficiency (KGE) of -0.1 on a daily scale (Equation 1). KGE is, like the Nash-Sutcliffe efficiency, a metric in hydrology to summarize model performance, which is increasingly used in model performance assessment (Knoben et al., 2019).
𝐾𝐺𝐸 = 1 − √(𝑟 − 1)
2+ ( 𝜎
𝑠𝑖𝑚𝜎
𝑜𝑏𝑠− 1)
2
+ ( 𝜇
𝑠𝑖𝑚𝜇
𝑜𝑏𝑠− 1)
2
Equation 1: KGE - Kling-Gupta Efficiency, r - linear correlation between observation and simulation, σsim/obs – standard deviation of measured/observed streamflow, µsim/obs – mean of simulated/observed streamflow. Taken from Knoben et al., 2019.
A KGE of -0.1 was regarded as unsatisfactory (1 is the best value KGE can achieve, meaning that the simulations exactly match the observations). Therefore, Andersson, 2020a, undertook five major changes.
(1) The SC delineation had to be enhanced. Besides, four manipulations on the hydrological model were undertaken to improve performance: (2) The global meteorological forcing data, (3) the West African weather data, (4) the hydrological model processes, and (5) the assimilation of observations.
Figure 3-4:Catchment delineation of the World Wide Hype (WWH, left) and the Niger-HYPE (right) before the adaptation to West Africa. Taken from Andersson, 2020a.