Research Collection
Doctoral Thesis
Modelling of Speculative Bubbles and Forecasting of Market Crashes
Author(s):
Gerlach, Jan-Christian Publication Date:
2021
Permanent Link:
https://doi.org/10.3929/ethz-b-000476068
Rights / License:
In Copyright - Non-Commercial Use Permitted
This page was generated automatically upon download from the ETH Zurich Research Collection. For more information please consult the Terms of use.
ETH Library
DISS. ETH NO. 27422
M
ODELLING OFS
PECULATIVEB
UBBLES ANDF
ORECASTING OFM
ARKETC
RASHESA thesis submitted to attain the degree of
DOCTOR OF SCIENCES of ETH ZURICH (Dr. sc. ETH Zurich)
presented by JAN-CHRISTIAN GERLACH
MSc Mechanical Engineering, ETH Zurich born on 17.05.1993
citizen of Germany
accepted on the recommendation of
Prof. Dr. Didier Sornette Prof. Dr. Jérôme Kreuser
2021
Modelling of Speculative Bubbles and Forecasting of Market Crashes
Jan-Christian Gerlach
ETH Zurich, Department of Management, Technology and Economics
e-mail: jgerlach@ethz.ch
February 16, 2021
Abstract
This thesis is structured and submitted as a cumulative thesis, listing five first-author papers, with four of them published. One of these four is released in both a long English and a modified German version. The fifth paper is an unpublished working paper1. The central topic of this thesis is modelling and forecasting of speculative bubbles in financial markets, with an emphasis on equity markets and cryptocurrencies. This can serve multiple purposes; the general understanding of investor behaviour and market dynamics, the generation of warning signals to inform of potential evolving risks such as overvaluation or market crashes, as well as the exploitation of these signals in robust, capital-preserving trading strategies. This thesis forms around two bubble models that are built upon the frameworks of rational expectations and behavioural finance; the Log-Periodic Power Law SingularityModel (Sornette et al., 1996; Johansen et al., 2000) and theKreuser-Sornette- Model of Efficient Crashes (Kreuser and Sornette, 2019, 2018), termed “Efficient Crashes Model”.
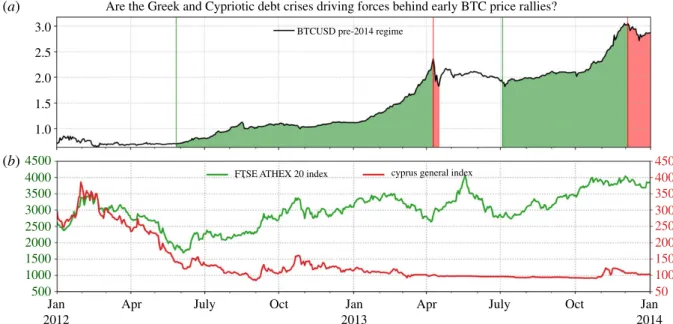
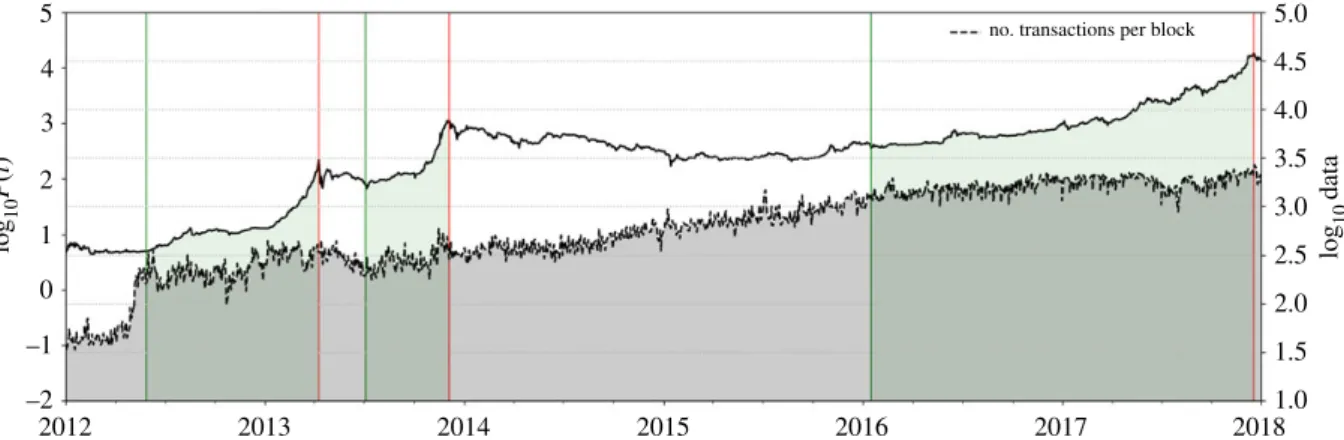
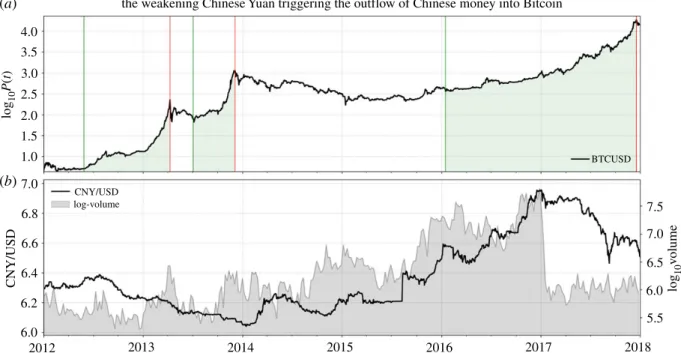
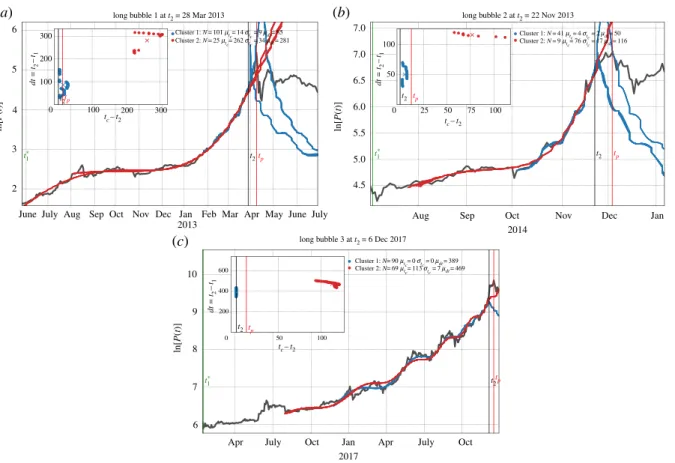
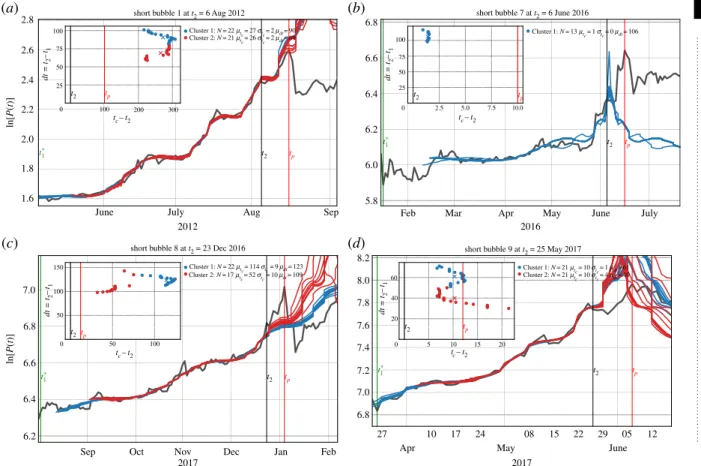
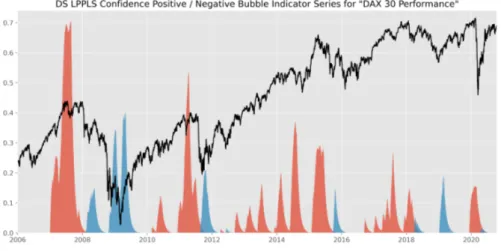
The positive feedback between market sentiment and return that underlies the explosive dynamics of speculative bubbles often leads to faster than exponential, so-called super-exponential growth of the price of an asset, that is, an acceleration of returns during the bubble. By definition, this type of growth cannot be sustained forever, thus, ultimately, a bubble must burst. Both time series models investigated here capture super-exponential price dynamics. The LPPLS model has reliably served in the detection of super-exponential price patterns ever since its initial formulation in 1995 (Sornette et al., 1996). At the heart of the model stands the parametertc, which is the time of the crash. The forecast of this so-called critical time provides a direct response to the question when a bubble will burst. Nowadays, the LPPLS model is employed for crash forecasts on a daily base in the Financial Crisis Observatory at ETH Zurich (Sornette et al., 2009), where it has evolved into an automated platform for monitoring speculative bubbles. This thesis contributes two papers in which relevant real-world asset price data are analyzed and new indicators and techniques are developed to improve forecasts of the time of the crash based on the LPPLS model. The first paper (Gerlach et al., 2019) (Section 2.3) focuses on the price history of the highly speculative cryptocurrency Bitcoin between 2012 and the end of 2017, with successful predictions of the ending times of major bubbles. The second paper (Gerlach et al., 2020c) (Sections 2.4 and 2.5) thematizes the recent regime of strong growth of global equity markets, following the 2008 financial crisis, and presents the LPPLS model as a tool for dynamic risk management (Kovalenko and Sornette, 2013), as opposed to passive investment strategies. Furthermore, two additional papers focusing on the Efficient Crashes Model (Kreuser and Sornette, 2019) were produced in the course of this doctorate.
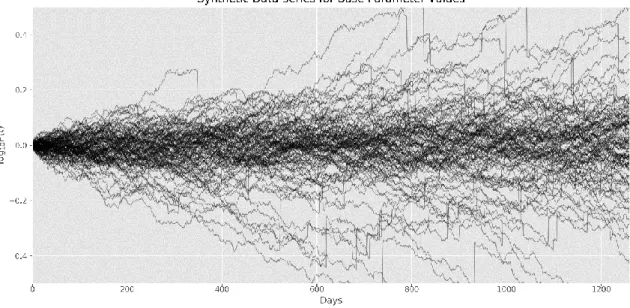
The first one (Gerlach et al., 2020a) (Section 3.3) investigates the - relatively new - model in a synthetic data setting. A significant outperformance of a Kelly trading strategy for optimal portfolio allocation (Kelly, 1956) based on the model could be demonstrated in Monte Carlo simulations.
Outperformance compared to standard benchmark strategies had been previously demonstrated on real-world data sets (Kreuser and Sornette, 2019), but the employed simulation techniques allowed validating the model performance within a much broader and more conclusive test. Furthermore, a sensitivity and a robustness analysis were performed for the model. The resulting insights from the synthetic data study in part led to a modified version of the model which results in more
1An abstract for this paper was not written, yet.
1
controllable model dynamics. The modified version is presented in the second paper (Gerlach et al., 2020b) (Section 3.4). As in the original paper by (Kreuser and Sornette, 2019), a Kelly trading strategy was derived and tested. In order to obtain statistically meaningful test results, an ex-ante backtesting algorithm was created. The test has several desirable properties. First of all, it can be applied to any price time series with ease, secondly, it simulates the true performance of the model out-of-sample and lastly, it solves the difficult problem of selecting optimal values for the model hyperparameters such as the portfolio rebalancing time by calibrating them to historical data. The results of the backtest analysis, tested for twenty relevant equity indices over a thirty years time frame (comprising multiple boom-bust-market-cycles), revealed a positive strategy return in 95% of cases and a probability of outperforming the buy-and-hold-strategy in 60% across all analyzed assets. The final part of the thesis (Section 4.2) presents a new topic, the dynamics of transactions on the Bitcoin blockchain. The cryptocurrency Bitcoin is a novel financial asset which has aroused the interest of the financial research community since its inception in 2009, due to the underlying Blockchain technology. Furthermore, Bitcoin has been in the focus of the investor community because of its extreme returns and highly speculative nature. Thus, it is a relevant object of research, worth exploring. As the Blockchain holds the history of all past Bitcoin Blockchain transactions and is publicly accessible, it provides an exceptional view on trading dynamics and investors’ behaviour. In the (unfinished) working paper, the authors present a novel model for the generation conservation of Bitcoins in the network of Bitcoin traders. From this model, insightful quantities and metrics that characterize the transaction dynamics over time are derived and computed based on the Blockchain dataset up to 2020. Furthermore, a variety of statistical procedures are employed. These lead for instance to the result that the transaction dynamics follow a clear (non-truncated) power law distribution with long memory. Markets thus remember of certain past levels of the Bitcoin price for long times and traders make their decisions of buying and selling with respect to these price marks. The authors assume that this transaction behaviour is also generally applicable to all kinds of traded assets and therefore can be seen as a general mechanism of transaction dynamics. Based on these deeper understandings of the transaction dynamics on the Blockchain, in future studies, the model may well be employed to identify characteristic price levels, predict transaction volumes and by that, ultimately, even price returns.
2
Kurzfassung
Die vorliegende Arbeit ist als kumulative Dissertation aufgebaut und eingereicht. Sie setzt sich zusammen aus f¨unf Erstautorenpublikationen, von denen vier ver¨offentlicht sind. Eine dieser vier ist sowohl in einer langen englischen als auch in einer angepassten deutschen Version ver¨offentlicht. Das f¨unfte Papier ist ein unver¨offentlichtes working paper 2. Das zentrale Thema dieser Arbeit ist die Modellierung und Vorhersage von Spekulationsblasen in Finanzm¨arkten, mit einem Schwerpunkt auf der Analyse von Aktienm¨arkten und Kryptow¨ahrungen. Die Vorhersage von Marktcrashs kann mehreren Zwecken dienen: dem allgemeinen Verst¨andnis von Anlegerverhalten und Marktdynamik, der Generierung von Warnsignalen, um ¨uber potenziell entstehende Risiken wie ¨Uberbewertung oder Marktcrashs zu informieren, sowie der Ausnutzung dieser Signale in robusten, kapitalerhaltenden Handelsstrategien. Diese Arbeit dreht sich haupts¨achlich um zwei Modelle von Spekulationsblasen, die auf dem Rahmenwerk der rational expectations theory und der Behavioral Finance aufgebaut sind; dasLog-Periodic Power Law Singularity Modell (Sornette et al., 1996; Johansen et al., 2000) und das Kreuser-Sornette-Modell (Kreuser and Sornette, 2019, 2018), typischerweise bezeichnet als “Efficient Crashes Model”. Die positive R¨uckkopplung zwischen Marktstimmung und Rendite, die der explosiven Dynamik von Spekulationsblasen zugrunde liegt, f¨uhrt oft zu einem schneller als exponentiellen, sogenanntensuper-exponentiellen Wachstum des Preises von Verm¨ogenswerten, d.h. zu einer Beschleunigung des Preisanstiegs w¨ahrend einer Blase. Definitionsgem¨aß kann diese Art von Wachstum nicht ewig aufrechterhalten werden, daher muss eine Blase letztendlich platzen.
Beide hier untersuchten Zeitreihenmodelle entspringen der Klase super-exponentieller Preisblasen- modelle. Das LPPLS-Modell hat seit seiner erstmaligen Formulierung im Jahr 1995 (Sornette et al., 1996) zuverl¨assig bei der Erkennung von super-exponentiellen Preismustern gedient. Im Zentrum des Modells steht der Parameter tc, der den Zeitpunkt des Crashs angibt. Die Vorhersage dieser sogenannten critical time liefert eine direkte Antwort auf die Frage, wann eine Blase platzen wird.
Das LPPLS-Modell wird heute im Financial Crisis Observatory der ETH Z¨urich (Sornette et al., 2009) t¨aglich f¨ur Crash-Prognosen eingesetzt und hat sich dort zu einer automatisierten Plattform zur ¨Uberwachung von Spekulationsblasen entwickelt. Diese Doktorarbeit liefert zwei Publikationen, in denen die realen Preisdaten relevanter Indizes analysiert und neue Indikatoren und Techniken entwickelt werden, um die Vorhersage des Zeitpunkts des Crashs basierend auf dem LPPLS-Modell zu verbessern. Die erste Publikation (Gerlach et al., 2019) (Abschnitt 2.3) konzentriert sich auf die Preisgeschichte der hochspekulativen Kryptow¨ahrung Bitcoin zwischen 2012 und Ende 2017, mit erfolgreichen Vorhersagen der Endzeitpunkte mehrerer Blasen. Die zweite Publikation (Ger- lach et al., 2020c) (Abschnitte 2.4 und 2.5) thematisiert das j¨ungste Regime starken Wachstums der globalen Aktienm¨arkte seit der Finanzkrise 2008 und stellt das LPPLS-Modell als Werkzeug f¨ur dynamisches Risikomanagement (Kovalenko and Sornette, 2013) (im Gegensatz zu passiven Anlagestrategien) vor. Dar¨uber hinaus entstanden im Rahmen dieser Promotion zwei weitere Ar- beiten, die sich mit dem Efficient Crashes Model (Kreuser and Sornette, 2019) besch¨aftigen. Die erste, (Gerlach et al., 2020a) (Abschnitt 3.3) untersucht das - relativ neue - Efficient Crashes Mod- ell in einem synthetischen Datenexperiment. In Monte-Carlo-Simulationen konnte eine signifikante Outperformance einer auf dem Modell basierenden Kelly-Strategie (Kelly, 1956) nachgewiesen wer-
2F¨ur dieses Paper wurde noch kein Abstract geschrieben
3
den. Die Outperformance im Vergleich zu Standard-Benchmark-Strategien wurde bereits zuvor auf realen Datens¨atzen nachgewiesen (Kreuser and Sornette, 2019), aber die verwendeten Simula- tionstechniken erlaubten die Validierung der Modell-Performance durch einen viel umf¨anglicheren und aussagekr¨aftigeren Test. Dar¨uber hinaus wurden eine Sensitivit¨ats- und eine Robustheitsanal- yse f¨ur das Modell durchgef¨uhrt. Die Erkenntnisse aus der synthetischen Datenstudie f¨uhrten zur Formulierung einer modifizierten Version des Modells, die zu einer besser kontrollierbaren Modell- dynamik f¨uhrt. Diese modifizierte Version wird im zweiten Paper (Gerlach et al., 2020b) (Abschnitt 3.4). Wie im urspr¨unglichen Paper von (Kreuser and Sornette, 2019) wird eine Kelly-Strategie konstruiert und getestet. Um statistisch aussagekr¨aftige Testergebnisse zu erhalten, wurde ein Ex- ante-Backtesting-Algorithmus erstellt. Der Test hat mehrere w¨unschenswerte Eigenschaften; erstens kann er problemlos auf beliebige Preiszeitreihen angewendet werden, zweitens simuliert er die wahre Performance des Modells out-of-sample, also statistisch signifikant, und drittens l¨ost der Algorith- mus das schwierige Problem der Auswahl optimaler Sch¨atzwerte f¨ur die Modell-Hyperparameter (wie z.B. die Portfolio-Rebalancing-Zeitabst¨ande), indem er die Hyperparameter basierend auf his- torischen Daten kalibriert. Die Backtest-Analyse, durchgef¨uhrt f¨ur zwanzig relevante Aktienindizes
¨
uber einen Zeitraum von dreißig Jahren, ergab in 95% der F¨alle eine positive Rendite der Strategie und in 60% eine Wahrscheinlichkeit, die Buy-and-Hold-Strategie zu ¨ubertreffen. Der letzte Teil der Arbeit (Abschnitt 4.2) pr¨asentiert ein weiteres Thema, die Dynamik von Transaktionen auf der Bitcoin-Blockchain. Die Kryptow¨ahrung Bitcoin ist ein neuartiger finanzieller Verm¨ogenswert, der aufgrund der zugrunde liegenden Blockchain-Technologie seit seiner Einf¨uhrung im Jahr 2009 das Interesse der Finanzforschungsgemeinschaft geweckt hat. Dar¨uber hinaus steht Bitcoin aufgrund seiner extremen Renditen und hochspekulativen Natur im Fokus vieler Investoren. Somit ist Bit- coin ein hochrelevantes Forschungsobjekt. Da die Blockchain die Historie aller vergangenen Bitcoin- Blockchain-Transaktionen enth¨alt und ¨offentlich zug¨anglich ist, bietet sie einen außergew¨ohnlichen Einblick in die Handelsdynamik und das Verhalten von Investoren. In dem (unvollendeten) work- ing paper pr¨asentieren die Autoren ein neuartiges Modell, welches die Generierung und Erhaltung von Bitcoins im Netzwerk von Bitcoin-H¨andlern mithilfe von Erhaltungsgleichungen beschreibt.
Aus diesem Modell werden aufschlussreiche Gr¨oßen und Metriken, die die Transaktionsdynamik im Zeitverlauf charakterisieren, abgeleitet und auf Basis des Blockchain-Datensatzes bis 2020 berech- net. Dazu werden verschiedene statistische Verfahren eingesetzt. Diese f¨uhren beispielsweise zu dem Ergebnis, dass die Transaktionsdynamik einer klaren (nicht abgeschnittenen) Potenzgesetzverteilung (non-truncated power law) mit Langzeitkorrelation folgt. M¨arkte “erinnern” sich also f¨ur lange Zeit an bestimmte vergangene Niveaus des Bitcoin-Preises und Trader treffen ihre Kauf- und Verkauf- sentscheidungen im Hinblick auf diese vergangenen Preislevel. Die Autoren gehen davon aus, dass dieses Transaktionsverhalten auch allgemein auf alle Arten von gehandelten Verm¨ogenswerten an- wendbar ist und daher als ein allgemeiner Mechanismus der Transaktionsdynamik angesehen werden kann. Basierend auf dem durch die Blockchain-Daten gewonnenen, tieferen Verst¨andnis, k¨onnte das Modell in zuk¨unftigen Studien durchaus eingesetzt werden, um charakteristische Preisniveaus zu identifizieren und Transaktionsvolumina und damit letztlich auch Preisentwicklungen vorherzusagen.
4
Acknowledgements
At ETH Zurich, Prof. Didier Sornette, the supervisor of this thesis, founded the Financial Crisis Observatory in 2008, during the emerging financial crisis that shook the global financial markets.
With the goal of monitoring and warning of speculative bubbles and imminent market crashes, the observatory nowadays has grown into a research platform, releasing monthly, openly accessible forecast reports globally to hundreds of investors, fund managers, institutions and other individuals.
I started to follow the reports of the Financial Crisis Observatory from 2017 on, after first get- ting to know Prof. Sornette during his ETH lecture on “Financial Market Risks”. The lecture provides a “detailed primer” about diverse topics in finance to students with a non-finance back- ground. Through Didier’s highly enthusiastic and motivating style of teaching theories like the Efficient Market Hypothesis, the Capital Asset Pricing Model, Markowitz portfolio theory or the Black-Scholes-Model, I became so interested in the field of finance, and particularly in research on speculative bubbles, that I straightforwardly approached Prof. Sornette after one of his last lectures of the semester and asked for a position as a research assistant in his group.
Back then, I would not have believed that, now, a couple of years later, I would have released dozens of FCO reports, myself, together with Didier and other researchers of our group. In the final weeks of this doctorate, I look back at three years of intense training in finance, statistics, time series analysis, coding, scientific writing, teaching and leading students and so much more that I learned throughout my time at the Chair of Entrepreneurial Risks.
I would like to express my deep gratitute to Didier Sornette for giving me this great chance, to become a part of his research group. With great enthusiasm, Didier has taught me about a multitude of theories and problems in the field of finance. He guided me through the doctorate, letting me find my own path, but always being ready to help, and thereby opened the way for me to basically reinvent myself in terms of studying an entirely new field. With Didier, it is possible to discuss topics of basically any kind, whether it is physics, chemistry, biology, geology, politics, economics or health sciences. Didier, a true poly-scientist, has an educated mind about pretty much everything, and in that, is a great role-model to me.
During my second year of the doctorate, I furthermore got introduced to Prof. J´erˆome Kreuser from the United States with whom I have collaborated in two research papers. During this time, J´erˆome has always been available for a meeting, and, with patience and pleasure, taught me about financial time series modelling and trading strategies. For taking this time next to all his other obligations, I would like to thank Prof. Kreuser, as well.
A further thanks goes to my co-authors Guilherme Demos and Dongshuai Zhao, with whom I have written two papers. Moreover, I would like to thank Guilherme for expending a lot of time during
5
his final phase of the doctorate to introduce me into the workings of the Log-Periodic Power Law Singularity Model for forecasting of market crashes. Further thanks go to Dr. Spencer Wheatley and Dr. Michael Schatz, both former post-docs at the Chair of Entrepreneurial Risks, as well as Assistant Professor Dr. Ke Wu at Southern University of Science and Technology in Shenzhen, China, who all were available for many interesting and insightful discussions about research projects.
Organizational procedures always elegantly happen in the background and the efforts that are be- hind them are therefore often forgotten. I would like to thank Isabella Bieri, Adriana Schellenbaum- Lenner and Judith Holzheimer for helping me with any question that I had about the doctorate.
Furthermore, Chahat Bhatia was a great colleague, who also answered a lot of my questions about computational issues and helped me with IT access.
My best colleagues at the chair were Giuseppe Ferro and Sumit Ram, with whom I had many cheerful and funny moments, but also deep discussions about our research ideas. My warm greetings also go to all co-students and group members who were there in the course of the doctorate; Rebecca Westphal, Ran Wei, Dijana Tolic, Ali Ayoub, Yue Peng and Vladimir Korenev, as well as my former master students, Clint Kurinjirappalli and Virgile Troude, with whom I have enjoyed working.
My friends have supported me through my entire doctorate by always being interested in my research and spending countless unforgettable moments with me. I would like to express my profound gratitude and appreciation to my best friend, Fabian Landers. Furthermore, a big thanks to my true friends Carl-Felix Waller, Julian Radziwil, Maximilian Paurat, Moritz K¨ohme, Lukas K¨undig, Wendel Liu, Constantin von Arnim and Julien Laval.
My love and gratitude go to my girlfriend Dr. Lara Zankena, who warms my heart with her happy and passionate nature. She is there for me at all times and knows when I need a gentle push to find my motivation. Her cheerfulness and humour, but also her discipline and determination, are a great inspiration to me.
Last but not least, I would like to address my family, my parents, Gefion and Kay Gerlach and my siblings, Cosima and Timmy. Without you, I would not be the person that I am proud of being today. I am infinitely thankful for your unconditional love and support through my entire life, and especially these last years of the doctorate. Thank you for all that you have done for me and for always being there for me. You are the best family that I could ever wish for.
January 2021, Jan-Christian Gerlach
6
Dedicated to my parents, Gefion and Kay Gerlach
7
Contents
1 Introduction 9
2 The Log-Periodic Power Law Singularity Model 12
2.1 Presentation of the LPPLS Model . . . . 12 2.2 Research Papers on the LPPLS Model . . . . 19 2.3 Paper 1: Dissection of Bitcoin’s multiscale bubble history from January 2012 to Febru-
ary 2018 . . . . 22 2.4 Paper 2.1: Forecasting Financial Crashes: A Dynamic Risk Management Approach . . 51 2.5 Paper 2.2: Prognose von Finanzcrashs f¨ur ein dynamisches Risikomanagement . . . . 70 3 The Kreuser-Sornette-Model of Efficient Crashes 80 3.1 Presentation of the Efficient Crashes Model . . . . 80 3.2 Research Papers on the Kreuser-Sornette-Model . . . . 84 3.3 Paper 3: Awareness of Crash Risk Improves Kelly Strategies in Simulated Financial
Time Series . . . . 87 3.4 Paper 4: Crash-sensitive Kelly Strategy built on a modified Kreuser-Sornette bubble
model tested over three decades of twenty equity indices . . . 123
4 Bitcoin Blockchain Transaction Dynamics 161
4.1 Bitcoin Transaction Dynamics . . . 161 4.2 Working Paper 5: Bitcoin Transaction Dynamics . . . 164
8
Chapter 1
Introduction
Forecasting asset prices is an ambitious goal. Financial markets are highly uncertain, nonlinear and non-stationary systems. They move in subsequent boom-bust-cycles, forming different regimes of growth and decline. In a market, the entirety of investor’s actions and interactions determines supply and demand and, by that, lastly the formation of asset prices. Markets are thus highly complex networks that depend on countless factors. The manifold dynamics resulting from these networks can be highly uncertain and difficult to foresee. Therefore, forecasting asset prices is often considered one of the most challenging problems in finance.
Asset prices are a result of investors’ current information and their expectations about the future. Rational investors buy and sell assets with the aim of maximizing financial performance while simultaneously minimizing the risk of loss. Depending on their individual preferences, thereby they act risk-tolerant or risk-averse, frequently or rarely, short-sighted or long-term oriented.
Investors base their decisions on future expectations and, by their collective actions, push the price towards the expected value, turning their forecasts into self-fulfilling prophecies (Merton, 1948).
For example, many investors may believe that the price of an asset will rise in the future. As a result, the demand for the asset increases, and so does its price. Given their expectations do not change, investors should continue to buy as long as the market price remains below the expected price. Finally, the price reaches this level, and the prediction comes true.
Whenever a market participant possesses a secret bit of information compared to the rest of the market, they act on this advantage, incentivized by the profit attached to this so-called “arbitrage opportunity” (see for instance(Dybvig and Ross, 1989)). By the corresponding trading decisions, and as the information spreads through the market, investors “efficiently” move the price closer towards its true value, thereby eliminating arbitrage opportunities for others.
Following this argumentation, the Efficient Market Hypothesis (EMH) states that all information available to investors is reflected in asset prices (Samuelson, 1965; Fama, 1965). The EMH implies that assets should be priced according to their current true value, with no information advantage available to individual investors for exploitation.
Obviously, in actual markets, there is a continuous “fight” of order and disorder (Johansen et al., 2000) about where the price will ultimately end up. Investors’ expectations are based on many different factors and criteria, hence cover a diverse range of opinions and ideas. These forces are in permanent competition, such that prices are constantly “pushed” up and down and may
9
temporarily deviate from fundamental values. Prices therefore not necessarily reflect the true value of an underlying asset.
Thus, there is an ongoing debate about market efficiency and to what degree it holds in reality (Frankfurter and McGoun, 2000; Malkiel et al., 2005; Malkiel, 2005). The strong-form EMH (Fama, 1970), which states that markets are fully efficient, is often rejected because of numerous real-world inefficiencies that prove its validity wrong. Amongst the most striking examples of such market inefficiencies are speculative bubbles. During a bubble, the price of an asset temporarily deviates from its true underlying value. This results in a mispricing; the market price of the asset does not reflect its true price any longer. Hence, the existence of speculative bubbles would be in direct contradiction to the idea of market efficiency.
There are numerous historical examples of speculative bubbles that were ended by large market crashes or declines, such as the Tulip Mania of the 1630s or the South Sea Bubble in 1720 (Sornette, 2003). In 1929, the “Black Friday” crash marked the beginning of the great recession. In October 1987, the “Black Monday” crash caused the largest single-day decline in the history of the Dow Jones. In the early nineties, the booming Japanese economy entered a long-lasting recession, the
“lost decades”, triggered by the burst of a preceding bubble. Examples that last in the mind of many until today are the Dotcom bubble of the late 1990s that came to an end in 2000, the United States real estate bubble that collapsed in 2009 (and expanded into a global economic crisis later on), as well as the most recent market shock in 2020, triggered by the unforeseen impact of the Corona pandemic. These examples provide strong evidence against the idea of market efficiency.
The domain of behavioural finance explains speculative bubbles as a result of human psycholog- ical failure (Ritter, 2003). The formation of a bubble is typically connected to an overly optimistic market sentiment that causes the demand for an asset to increase. This optimism could, for instance, be initiated by a random series of positive news and price moves (Harras and Sornette, 2011). As a reaction to the increased demand for the asset, the price surges. This, in turn, attracts more in- vestors that further drive up the demand and the price. A feedback loop between price growth and market sentiment sets in, spiralling up the price to ever-higher levels. The self-fulfilling prophecy of investors’ positive expectations turns into a state of “irrational exuberance” (Shiller, 2005). In this state, market participants become overconfident, greedy and ignorant towards risks. Driven by imitation and herding, as well as the fear of missing out, more and more investors blindly enter the market to participate in the hype. This feedback between enthusiasm and price growth is a charac- teristic signature of bubbles and causes an acceleration of prices and returns (Ardila-Alvarez et al., 2020). The existence of these so-calledsuper-exponential price dynamics has been demonstrated in real-world examples and lab experiments (Leiss et al., 2015; H¨usler et al., 2013).
Ultimately, towards the end of a bubble, the ever-higher returns cannot be sustained by the inflow of new investments anymore; a tipping point is reached. No “greater fool” (Selim, 2005) is willing to buy the asset at an even higher price; the demand is saturated. Suddenly, investors “wake up” and their enthusiasm turns into a selling panic. The bubble collapses in a crash or a successive correction that drives the price back towards the fundamental value (Yan et al., 2012).
Speculative bubbles and market crashes form a key research topic of this thesis. Modelling and predicting bubbles and crashes may prevent financial damage to individuals, companies, markets, or even entire economies. It is a major goal of this thesis to develop an understanding of the origins
10
and mechanics behind the formation of bubbles, as well as their characteristics and dynamics, in order to develop methods for early bubble detection. The main focus of this thesis is on two rational expectations bubble models with super-exponential price dynamics, the Log-Periodic Power Law Singularity (LPPLS) model (Johansen et al., 2000) and the Kreuser-Sornette-Model of Efficient Crashes (ECM) (Kreuser and Sornette, 2019). In the following sections, at first, derivation of the LPPLS model is summarized. Then, two papers on the LPPLS model are presented. The motivations and goals of these papers, as well as their results and placement in LPPLS research are explained. Secondly, the Efficient Crashes Model is introduced and the corresponding papers are presented. Finally, Bitcoin, as a highly speculative asset, is investigated in depth. Its transaction dynamics are the focus of the final section, which presents a working paper about a novel model of the dynamics of blockchain transactions.
11
Chapter 2
The Log-Periodic Power Law Singularity Model
2.1 Presentation of the LPPLS Model
The potential impact of market crashes can be destructive. Typically, market participants run into crashes completely unprepared and blind to the potential risks and financial ruin they may face.
Thus, often, the end of a bubble comes unexpected to many. At ETH Zurich, the Financial Crisis Observatory (FCO) was founded by Prof. Didier Sornette in 2008, during the emerging financial crisis, with the mission to warn of imminent market crashes (Sornette et al., 2009, 2010; Woodard et al., 2010). The FCO is an automated, scientific platform for the detection and monitoring of speculative bubbles. Nowadays, it is employed by the Sornette group as a resilient warning system for dynamic risk management of crash risk (Kovalenko and Sornette, 2013). In the course of the doctorate, the author of this work and Prof. Sornette have published dozens of monthly reports for the FCO, which inform readers about potentially risky and harmful market developments associated with the formation of speculative bubbles.
At the heart of the FCO, theLog-periodic Power Law Singularity(LPPLS) model of speculative asset price dynamics is employed to generate crash predictions and aggregate bubble signals (Jo- hansen et al., 2000; Sornette, 2009; Johansen and Sornette, 2010). The model has been a central tool in bubble forecasting for more than two decades. First proposed in the context of speculative bubbles in 1995 (Sornette et al., 1996), the model was further reviewed (Sornette and Johansen, 1997; Sornette, 1998; Sornette and Johansen, 1998; Johansen and Sornette, 1999a,b) and elaborated into a rational expectations model by Johansen et al. (2000).
From an economic point of view, the LPPLS model defines a bubble as a period of unsustainable growth during which the price of an asset climbs to ever-higher levels, accompanied by a series of accelerating phases of corrections and rebounds (Sornette and Cauwels, 2015). Thereby, the market value of the asset increasingly decouples from its intrinsic fundamental value (Kindleberger, 1978;
Sornette, 2003) until the bubble finally explodes.
In the following, a derivation of the LPPLS model that is mostly based on the seminal paper
“Crashes as Critical Points” by Johansen et al. (2000), is provided. Due to the importance of the paper, the LPPLS model is also often named after its authors; the Johansen-Ledoit-Sornette- Model, short JLS-Model. Both abbreviations essentially refer to the same model. There are also
12
many extensions and modifications of the JLS model, but here, the main focus lies on the derivation presented in the JLS-paper.
The LPPLS model assumes that the price of an assetp(t) can be decomposed into
p(t) =pf(t) +pb(t) (2.1)
wherepf(t) is the fundamental value of the asset (that forms as a consequence of future dividend payment valuation for instance) andpb(t) is the bubble component of the price which results from an over- or undervaluation of the asset. At the very foundation, the derivation of the LPPLS model therefore starts off from one of the most widely accepted mathematical definitions of a bubble; no matter what are the origins, the dynamics or other characteristics, it is generally agreed upon that an asset price can be written according to Eq.(2.1) or some similar separation of fundamental and bubble component (for instance multiplicative p(t) =pf(t)pb(t) and so on) above.
From the initial definition Eq.(2.1), the framework by Johansen et al. (2000) then regards a purely speculative asset without intrinsic value, i.e. withpf(t) = 0 and therefore:
p(t) =pb(t) (2.2)
The price of the asset is thus solely a result of mispricing. The assumption that an asset has no intrinsic fundamental value, at all, may seem like a too harsh restriction or oversimplification; it is hard to imagine that any traded, “tangible” asset is worthless, but on the other hand, a famous candidate, the cryptocurrency Bitcoin is seen as a direct proof for the existence of purely speculative assets by some (Cheah and Fry, 2015).
Regardless of this debate, by defining a new variablex(t) = ln[p(t)/pf(t)], the formalism pre- sented below can however also directly be applied to assets with a non-zero, dynamic fundamental value process pf(t), as shown by (Ide and Sornette, 2002). Thus, without loss of generality, the derivation continues from Eq.(2.2). The dynamics of the asset pricep(t) are modelled according to a stochastic jump diffusion process of the form
dp
p =µ(t)dt+σ(t)dW−κdj (2.3)
where µis the excess return of the asset price and σ anddW are the volatility and increment of a stochastic standard Wiener process (withE[dW] = 0 andE[dW2] = 1), respectively. The last termκdj represents a possible market crash, wheredjis the increment of a jump process withj= 0 before the time of the crash and j = 1 after the time of the crash. The parameterκis the size of the jump.
Conditional on no jump having occurred, yet, the probability per unit of time of a jump to occur (i.e. forj to switch from 0 to 1 within the interval [t, t+dt]) is given byh(t)dt, whereh(t) is the so-calledcrash hazard rate. Writing the expectation of the jump increment connects it to the crash hazard rate in the following way:
E[dj] =h(t)dt·1 + (1−h(t)dt)·0 =h(t)dt (2.4)
13
Thus, the expected jump size over the next interval is equal to the probability of the jump to occur within that interval, h(t)dt.
The economic theory of “rational expectations” (see for instance Muth (1961); Sheffrin (1996)) assumes that markets are populated by rational traders that collectively form their estimates of the price of an asset according to logic and rational models and decision processes. Thus, on average, they come up with correct estimates of the future true price of an asset. Together with the assumptions underlying the LPPLS model setting (Johansen et al., 2000), rational traders arrive at the following estimates of future prices:
Et[p(t0)] =p(t) ∀t0 > t (2.5)
Mathematically, Expression (2.5) is known as the “martingale condition”. The formulation is a logic expression of market efficiency; given information up to timet, as expressed by the expectationEt[·], in an efficient market, the current pricep(t) is the best estimate of all future prices, because it should reflect all information up to that time, that investors can draw on to estimate the value of an asset.
A future price change could hence solely depend on additional information that becomes available in the future and is not yet known. A rational investor’s best estimate of the future price of an asset under the current information set thus amounts to the current price of the asset. Consequently, the expected future price change (over any interval) must be zero. This is expressed by the no-arbitrage condition
Et[dp] = 0 (2.6)
which is nothing but a rearranged expression of Eq.(2.5). Computing the no-arbitrage condition for the stochastic process in Eq.(2.3) under the assumption that no crash has occurred, yet (j = 0), yields:
µ(t) =κh(t) (2.7)
Equation (2.7) establishes a fundamental relation between the return of the asset price during a bubble and the risk of a crash. It expresses that bubbles can in fact result from the interactions of rational market participants; traders act rationally in that, with the growing risk of a crash (which is proportional to h(t)), they demand an ever-higher excess return µ(t) to remain invested in an asset during a bubble. Hence, rational investors price the risk of a crash into their expectations of the future price during the bubble. As they expect the price to surge with the increasing risk of a crash, it is a rational decision for them to remain invested in the speculative asset, in order to profit from the price increase during the bubble. Therefore, “there can be rational deviations of the price from the [fundamental value]1” (Blanchard and Watson, 1982), so-called rational bubbles.
The concept of rational bubbles partly solves the conflict between speculative bubbles and mar- ket efficiency by describing the investment into an asset during a bubble and under the risk of a crash as an economically sensible process. Nevertheless, an obvious criticism is that, “rational ex- pectation bubbles, [...] by design, suffer from the paradox that a rational market should not allow for misvaluation” (Schatz and Sornette, 2020). This weakness of the rational expectations theory also previously motivated the extension of the LPPLS framework beyond the setting of rational
1Changed by the author.
14
expectations (Zhou and Sornette, 2006a) by modeling for instance a behavioural component via a suitable stochastic pricing factor (Cochrane and University, 2001).
Reinserting the risk-return-relation obtained in Eq.(2.7) into Eq.(2.3) and assuming that no crash has occurred (i.e. j = 0), the solution of the stochastic process for the log-price at time t (with initial conditionp(t0) = 1) is given by:
Et[lnp(t)] =κ Z t
t0
h(t0)dt0 (2.8)
So far, a stochastic jump diffusion process (that is an overlay of Geometric Brownian Motion with additional jumps) for the dynamics of the asset price was introduced. The process was embedded into the framework of rational expectations, which allowed the application of the no-arbitrage condition.
From this, a relation between the return of the price of an asset and the risk of a crash, which justifies the existence of “rational bubbles” as the result of a rational traders’ actions, was obtained.
The yet undefined core component leading to the LPPLS model is the crash hazard rate h(t).
Johansen et al. (2000) define the crash hazard rate as
h(t) :=B0(tc−t)−α+B1(tc−t)−αcos[ωln(tc−t) +ψ0] (2.9) with parameters {B0, B1, tc, α, ω, ψ0}.
The crash hazard rate in Eq.(2.9) originates from an underlying agent-based model of “noise traders” (Kyle, 1985; Black, 1986; De Long et al., 1990). These noise traders are characterized by irrational behaviour; they engage in risky and uneducated trading decisions, and are prone to human biases such imitation and herding. Therefore, many explain their presence in financial markets as a major source of irrational behaviour that may lead to the formation of speculative bubbles (Shiller et al., 1984; Campbell and Kyle, 1993; Brown, 1999; Johansen et al., 2000).
The crash hazard rate proposed by Johansen et al. (2000) mathematically captures the interac- tions of noise traders in a complex network. Within this network, their tendency to imitate their neighbour’s actions (“local imitation”) and be influenced by the global network trend (“global im- itation”) induces a self-reinforcing, positive feedback cycle into the dynamics of the crash hazard rate (Johansen et al., 1999; Abreu and Brunnermeier, 2003).
Inserting the crash hazard rateh(t) into Eq.(2.8) and computing the integral leads to the LP- PLS model, which describes the trajectory of the expected log-price Et[lnp(t)] during a bubble as (Filimonov and Sornette, 2013):
LPPLS(t|θ) :=A+B(tc−t)m(C1cos(ωln(tc−t)) +C2sin(ωln(tc−t))) (2.10) The seven parameters of the LPPLS model are θ:={A, B, C1, C2, tc, m, ω}.
As visible, the mathematical form of the hazard rate “propagates” to the LPPLS model. There- fore, although the LPPLS model is built within the framework of rational expectations, through the agent-based model of noise traders underlying the crash hazard rate, the LPPLS model incor- porates both rational and noise traders. Thus, while making use of the simplifying mathematical implications of the no-arbitrate condition, the model also takes into account the presence of noise
15
traders which represent the irrational part of the model.
Mathematically, the LPPLS formula in Eq.(2.10) expresses the dynamics of the log-price as a finite-time power-law singularityB(tc−t)moverlaid with log-periodic oscillations C1cos(ωln(tc− t)) +C2sin(ωln(tc−t). The power law (with amplitude B and exponentm) captures the super- exponential price dynamics that originate from the positive feedback effect (between return and market sentiment) that fuels the growth of bubbles. The log-periodic oscillation terms (with am- plitudeC =p
C12+C22 and angular frequency ω) symbolize the tension and competition between rational and noise traders (Yan et al., 2010).
For a value B < 0 of the power law constant, the log-price slopes upwards, while for a value B >0, the price slopes downwards, describing the trajectory of what is referred to as a “negative bubble” (Sornette and Cauwels, 2015). A negative bubble is thus a transient period of downward momentum, which ends in a sudden sharp increase of the price. Furthermore, the value of must be constrained in 0 < m <1 in order to ensure (i) that the probability of observing a crash up the critical timetc (i.e. the integral of the crash hazard rateh(t) up totc) does not exceed a value of 1 and (ii) that the log-price does not diverge for t≤tc (Filimonov and Sornette, 2013).
Compared to standard exponential growth, which naturally originates in finance due to the compounding effect of returns, the power law term in the LPPLS equation implies that the price defined by the LPPLS model grows faster than exponentially, in other words, super-exponentially, towards the price peak at the end of the bubble (i.e. ast→tc), as the normal compounding effect seen in prices is then superimposed with the positive feedback dynamics during a bubble. Super- exponential can be demonstrated with a simple example. Assume that, up to a certain timetc and a value A at that time, the price of an asset either grows according to an exponential model (i.e.
linearly in the logarithm),
lnp(t) =A−(tc−t) (2.11)
or evolves following a power law
lnp(t) =A−(tc−t)m (2.12)
The power law specification of the price is similar to the dynamics underlying the LPPLS model, hence used here as a simplifying example.
The first-order derivative of the log-price with respect to timedlnp(t)/dtis the growth rate of the asset price. For the two price specifications, the growth rates are computed as:
dlnp(t)
dt = 1 (2.13)
and dlnp(t)
dt =m(tc−t)m−1 (2.14)
Super-exponential growth qualifies when the return itself is growing and hence, the price accel- erates. Computing the second-order derivatives of the price with respect to time,
d2lnp(t)
dt2 = 0 (2.15)
16
and d2lnp(t)
dt2 =−m(m−1)(tc−t)m−2 (2.16)
reveals that this is logically not the case for the exponential price specification, which has a derivative equal to zero. For the power law price process however, the second-order derivative is always positive for 0< m <1. Thus, power laws are a fundamental expression of super-exponential dynamics in asset prices.
As the critical time tc is approached (t →tc), simultaneously to the acceleration of the price, the log-periodic oscillations of the LPPLS model increase in frequency, because the argument
t→tlimc
ln(tc−t)→ −∞ (2.17)
in the oscillation terms diverges. This acceleration represents the more and more hectic behaviour of traders and the corresponding increase in volatility towards the end of a bubble, which finally unloads in a crash at the time of the singularity. Thus, at t = tc, the crash or “gentle deflation”
of the bubble follows (Yan et al., 2012). Beyond this point, the price enters a new regime. The LPPLS formula is then not valid anymore, due to negative argumenttc−t <0 in the logarithm of the log-periodic oscillations. This transition of the market into a new regime is analogous to critical phase transitions in statistical physics (Sornette and Johansen, 1998).
Power laws and log-periodicity both mathematically are expressions of so-called(discrete) scale invariance (Sornette, 1998). A scale-invariant function fulfils the identity:
f(λx) = 1
µ(λ)f(x) (2.18)
It turns out that a power law of the form f(x) :=xm exactly solves this relation
f(λx) = (λx)m=λmxm=λmf(x) (2.19) with µ(λ) = λ−mand hence the exponent of the power law is m=−lnµ/lnλ. Thus, power laws are scale invariant functions. Their ratio
f(λx)
f(x) =λm (2.20)
does not dependent on the argument x, but only the scaling factorsλ andµ. Thus, changing the scale of the function (“zooming in or out”) qualitatively results in the same shape of the function, magnified by a constant factor. This property is closely related to the concept of self-similarity which describes functions that are similar to themselves on different scales.
Furthermore, assuming the functionf(x) =xmis a power law and inserting f(x) to the above Equation (2.18) yields the following identity
µ(λ)f(λx)
f(x) =µ(λ)λm= 1 (2.21)
which leads to a more general solution for the exponent m of the power law. As 1 = exp(i2πn)
17
(wherenis an integer), a general complex discrete solution for the exponent is given by solving
ln(µ) +mnln(λ) =i2πn (2.22)
which results in:
mn=−lnµ
lnλ+i2πn
lnλ (2.23)
Forn= 0, the continuous case of scale invariance, as shown above, with exponent m=−lnµ/lnλ results. However, for non-zero values ofn, there are actually infinitely many discrete solutions that fulfill the above condition for scale invariance. Since these solutions are discrete, the functional property is then referred to asdiscrete scale invariance.
Keeping the full solutionmn and reinserting it into the power lawxmresults in
xm=xm0+i2πnlnλ (2.24)
which is a complex power law, which can also be rewritten as:
xm=xm0ei2πnlnlnxλ (2.25)
Thus, the general, complex solution of the scale invariance condition in (2.18) is given by a continuous power law multiplied by a periodic function π with period 1 that is periodic in the logarithm of its argumentx(Johansen et al., 2000), in other words a log-periodic function:
fn(x) =x−lnµ/lnλπhlnx lnλ
i (2.26)
The angular frequency of the periodic functionπis:
ω= 2π
lnλ (2.27)
In this form, immediately one sees that the relation to the LPPLS model in Eq.(2.10) above, which in its core can be written in the form
LPPLS(t)∝xmcos(ωlnx−φ) (2.28)
The LPPLS is thus exactly a power law with log-periodic corrections which has the property of discrete scale invariance.
Discrete scale invariance is a property emerging from the dynamics of many natural systems.
For an extensive review see (Sornette and Johansen, 1998). The occurrence of log-periodicity has already long been observed in diverse physical phenomena such as alignment of atomic spins to create magnetization (Sornette, 1998; Johansen et al., 2000), rupture of composite materials and pressure tanks under mechanical stress (Anifrani et al., 1995, 1997) or earthquake propagation (Sornette and Sammis, 1995). Similarly, asset price patterns emerging during speculative bubbles have been observed to follow these dynamics Sornette et al. (1996); Feigenbaum and Freund (1996). The information in price data tied to these patterns can be incorporated into the prediction of market
18
crashes by calibrating the LPPLS formula to such market patterns by “locking in” the log-periodic oscillations of the LPPLS to log-price patterns Johansen et al. (2000).
After this derivation of the model and the presentation of the involved economic and physical concepts, in the following, the contribution of the two research papers, which apply the LPPLS model to forecast market crashes on various real-world price time series, is explained.
2.2 Research Papers on the LPPLS Model
The LPPLS model has proven valuable in the detection of financial bubbles and forecasting of crashes. Multiple speculative bubbles have been identified ex-ante and ex-post to obey endogenous LPPLS dynamics. Examples comprise the Black Friday Crash of October 1929 (Zhang et al., 2016), the Black Monday Crash of October 1987 (Johansen and Sornette, 2010; Sornette and Johansen, 2001), the Dotcom Bubble (Johansen and Sornette, 2000; Sornette and Zhou, 2002; Zhou and Sornette, 2003a,b; Zhang et al., 2016), as well as the US real estate bubble (Zhou and Sornette, 2006b; Sornette and Woodard, 2010). But also “ancient” bubbles such as the Tulip Mania in the 1630’s and the South Sea Bubble in 1720 (Sornette, 2003), as well as bubbles on novel assets such as Bitcoin (Gerlach et al., 2019; Wheatley et al., 2019) and cryptocurrencies in general have been investigated in this context.
Throughout all these studies, besides the investigation of the dynamics that prices undergo during a bubble regime, the central interest lies on the prediction of market crashes. In the LPPLS model, the time of the crash is captured by the critical timetc of the phase transition. Thus,tc is a major model parameter of interest. Its estimation provides a direct (ex-ante) forecast of the most probable time of the crash. “The critical time is indeed the prize of the whole forecasting exercise:
the sooner a bubble is identified, that is, the further away is tc from the present time, the better it is for policy makers to take appropriate actions.” (Filimonov and Sornette, 2013).
It was a major goal of this thesis to investigate procedures for improving the estimation of the critical time. In order to estimate the critical time, the LPPLS model must be calibrated to financial log-price data. The calibration of the LPPLS model typically follows a calibration scheme developed by Filimonov and Sornette (2013). A combination of grid search and numerical optimization for the nonlinear parameters (tc, m, ω) with an Ordinary Least Squares (OLS) regression for the linear parameters (A, B, C1, C2) is applied to minimize the sum of squared errors (SSE) as the objective function. During optimization, the search space for the nonlinear parameters is constrained, whereas the linear parameters are free. Other methods of calibration such as Modified Profile Likelihood (Filimonov et al., 2017) or Generalized Least Squares (GLS) (Wheatley et al., 2019), as well as different error model specifications such as AR(1)-GARCH(1,1) (Gazola et al., 2008), have been tested in the past.
In the course of the doctorate, most of the mentioned calibration procedures were implemented and tested by the author. Surprisingly, most more sophisticated and computationally complex techniques did not deliver a significant edge over the robust procedure developed by Filimonov and Sornette (2013). Thus, in both LPPLS papers, the standard calibration scheme was utilized to obtain results.
Besides in-optimization techniques, the aggregation of parameter estimates played an important
19