Research Collection
Journal Article
On the anisotropy of shear fracture toughness in rocks
Author(s):
Nejati, Morteza; Bahrami, Bahador; Ayatollahi, Majid Reza; Driesner, Thomas Publication Date:
2021-06
Permanent Link:
https://doi.org/10.3929/ethz-b-000473585
Originally published in:
Theoretical and Applied Fracture Mechanics 113, http://doi.org/10.1016/j.tafmec.2021.102946
Rights / License:
Creative Commons Attribution-NonCommercial-NoDerivatives 4.0 International
This page was generated automatically upon download from the ETH Zurich Research Collection. For more information please consult the Terms of use.
ETH Library
Theoretical and Applied Fracture Mechanics 113 (2021) 102946
Available online 2 March 2021
0167-8442/© 2021 The Author(s). Published by Elsevier Ltd. This is an open access article under the CC BY-NC-ND license
(http://creativecommons.org/licenses/by-nc-nd/4.0/).
On the anisotropy of shear fracture toughness in rocks
Morteza Nejati a , * , Bahador Bahrami a , b , Majid Reza Ayatollahi b , Thomas Driesner a
a
Department of Earth Sciences, ETH Zurich, Switzerland
b
Fatigue and Fracture Research Laboratory, School of Mechanical Engineering, Iran University of Science and Technology, Tehran, Iran
A R T I C L E I N F O Keywords:
Shear failure
True mode
IIfracture toughness Fracture energy
Rock anisotropy Fracture process zone Digital image correlation
A B S T R A C T
Experimental and theoretical analyses are presented that assess true mode II fracture toughness, K
IIc, fracture energy, 𝒢
IIc, and associated fracture process zone (FPZ) in anisotropic rocks. The term true signifies the type of mode II crack that grows in a self-planar manner as a result of shear stresses, and thus differentiates it from a generic mode II crack that often extends by forming a tension-induced kink. We give the theoretical basis for the sinusoidal variation of K
IIc, and present simplified relations for the direction dependence of the 𝒢
IIcin an anisotropic plane. Our experimental data on anisotropic Grimsel Granite validate this theoretical model, thereby providing supporting evidence that K
IIcof this rock type indeed follows a sinusoid function. This model takes only two principal values of K
IIcto characterise fracture toughness and energy in any direction within an anisotropic plane. Our analyses also show that the values of K
IIcand 𝒢
IIcare noticeably higher than the ones of mode I, and one must distinguish between these toughness values when formulating growth criteria in rocks.
Lastly, a thorough analysis of the strain localisation obtained from the digital image correlation data gives insight on the nature of the FPZ, and demonstrates that the FPZ of a true mode II crack is of a semi-elliptical shape and has a comparable size with the one of a mode I crack.
1. Introduction
Hydro-mechanical interactions on fractures and faults in the Earth’s crust control both risks and benefits of important natural (e.g., earth- quakes, ore-forming hydrothermal systems) and engineering (e.g., geothermal reservoirs, wastewater injection) processes in the subsur- face. For example, hydraulic stimulation (injection of pressurized water) to enhance permeability in deep, hot and fractured rocks is considered the key technology for enabling a carbon-free geothermal power gen- eration [1,2]. A central question in this context is where, when and how propagating fluid-pressure in differently oriented, connected fractures will lead to shear- or tension-based rupture of exsiting fractures, or even cause the nucleation of new ones [3–5]. An answer to this question re- quires a good underestanding of the rock fracturing porcesses due to shear shresses, i.e. shear-based fracturing mechanisms.
Many rocks display an anisotropic behaviour as a result of the preferred orientation of micro-cracks and/or alignment of mineral grains with anisotropic mechanical properties. The in-situ experiments at the Grimsel test site in Switzerland have demonstrated that the fracture growth patterns are influenced by the anisotropy of the granitic host rock [3]. Based on these observations, a series of experimental
studies were performed to rigorously analyse the effects of anisotropy on the failure growth in Grimsel Granite [6–8]. All these laboratory studies are established based on the assumption that the development of crack growth is mainly due to the tensile stresses. However, due to the large stress confinement in the subsurface, there is a potential for fractures oriented along the maximum shear, to demonstrate shear-based ruptures as a result of elevated fluid pressure inside the fractures. The tendency towards shear failure at high confining pressures has been evidenced by many experimental studies, including Refs. [9–12] to name a few.
A shear crack (mode II or mode III ) in its classical definition refers to a loading condition that allows only sliding between the crack surfaces.
In mode II loading, standard laboratory tests often yield a crack exten- sion that involves the formation of a kink at an angle about 70
◦with respect to the notch plane [13,14]. Since the kink angle can be predicted accurately by the maximum tangential stress (MTS) criterion, this form of failure is proved to be caused by the tensile stress [15,16]. A similar kinking process is observed in some mode III experiments, where the orientation of crack extension, generated by a twist of 45
◦with respect to the crack front, can be explained using the maximum normal stress criterion [17 – 19]. We note that in predicting the growth of kinked crack in both modes II and III, only the mode I fracture toughness (K
Ic) comes into play as a material property related to fracture growth (see Refs.
* Corresponding author.
E-mail address: mnejati@ethz.ch (M. Nejati).
Contents lists available at ScienceDirect
Theoretical and Applied Fracture Mechanics
journal homepage: www.elsevier.com/locate/tafmec
https://doi.org/10.1016/j.tafmec.2021.102946
Received 23 November 2020; Received in revised form 22 January 2021; Accepted 23 February 2021
[20,21] as examples).
Under high confinement, a mode II crack can extend in a co-planar manner, where not only is the loading shear-induced, but also the fail- ure is shear-based [22–25]. As explained in Bahrami et al. [25], shear- based fracturing tends to occur when the confinement is high enough to supress or arrest any tension-based failure along a potential kink.
They referred this type of fracturing to as true mode II, to differentiate it from the classical mode II which yields a kinked crack. Experimental data on some mode III cracks also give evidence on a self-planar type of crack extension [27,26]. As explained in Refs. [28,29], for a main (parent) mode III crack to grow, first a set of daughter cracks are formed normal to the direction of maximum tensile stress (at an angle of about 45
◦), followed by local fragmentations connecting these daughter cracks to yield a self-planar crack extension. This is due to the geometrical constraint applied by the notch plane and also the available energy in the system that does not allow daughter (tensile) cracks to extend beyond a critical size [29]. Both mode II and III self-planar crack ex- tensions involve energy dissipation processes that are not simply taken into account when measuring K
Icof the material. Additional material properties are therefore required to measure the resistance against the growth of cracks undergoing such modes of propagation. These prop- erties may be referred to as true mode II and true mode III fracture toughness, K
IIcand K
IIIc. The term true simply differentiates these toughness properties from the ones that are obtained in experiments with crack kinking, thus making them being treated as material properties.
Our literature survey shows that the mechanism of shear-based fracturing of anisotropic rocks has largely been unexplored, mainly due to the difficulties in conducting shear-based fracture tests. The previous experimental methods for true mode II testing are either incapable of testing anisotropic rocks in specified directions [23], or require a complex testing procedure, e.g. cubic samples and a custom-
designed loading frame [24]. Recently, Bahrami et al. [25] suggested a simple and straightforward testing method based on the diametrical compression of double-edge notched Brazilian disks (DNBD), whereby enabling us to determine true mode II fracture toughness in any direc- tion with respect to the anisotropy orientations, and to investigate its direction dependence. The literature currently lacks such an analysis.
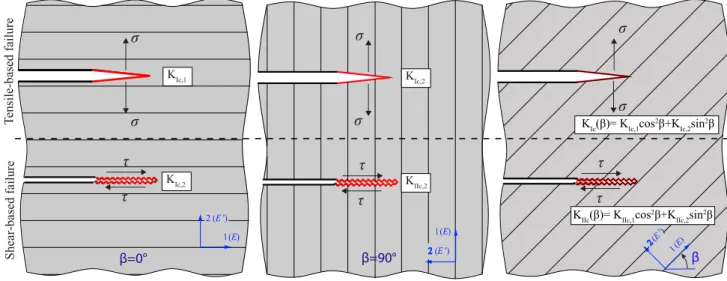
Consider an anisotropic medium with the principal directions 1 and 2, with Young ’ s moduli E and E
′, as schematically shown in Fig. 1. Nejati et al. [8] recently demonstrated that mode I fracture toughness in this anisotropic plane varies based on a sinusoidal function of two principal values, namely K
Ic,1and K
Ic,2. In this paper, we use the results of the DNBD tests on Grimsel Granite to demonstrate that, in fact, true mode II fracture toughness also varies based on a sinusoidal function, and in- cludes two principal values K
IIc,1and K
IIc,2. These principal values can therefore fully characterise direction dependence of true mode II frac- ture toughness. Using the crack tip fields, we then propose a relationship for the variations of the critical energy release rate that is also referred to as the fracture energy. Such a relationship is essential when using the maximum energy release rate criterion for predicting crack growth in anisotropic media. We also characterise the shear-based fracture process zone (FPZ) developed in front of a true mode II crack tip, and show that it is of a semi-elliptical shape and has a similar size to the FPZ of a mode I crack.
2. Experimental study 2.1. Rock material
We conducted true mode II fracturing tests on the anisotropic Grimsel Granite. Samples were prepared from the cores of the borehole that was used for injecting pressurized-water during the in-situ stimu- lation experiments at the Grimsel test site in central Switzerland [2,3].
Nomenclature Nomenclature
a Crack length
E , E
′Young’s modulus within and normal to the isotropy plane G Shear modulus within the isotropy plane
G
′, G
′svTransverse shear modulus and its approximation from the Saint-Venant relation
𝒢
I, 𝒢
IIMode I and true mode II energy release rates
𝒢
Ic, 𝒢
IIc,𝒢
IIIcMode I, true mode II and true mode III fracture energies K
I, K
IIMode I and mode II stress intensity factors
K
Ic, K
IIc, K
IIIcMode I , true mode II and true mode III fracture toughness
K
Ic,1, K
Ic,2Mode I fracture toughness along principal directions 1 and K
IIc,1, K
IIc,22 True mode II fracture toughness along principal
directions 1 and 2
̂ K
Ic, ̂ K
IIcAverage mode I and true mode II fracture toughness K
aIIcApparent mode II fracture toughness
l Half of the ligament between the two notch tips in the DNBD specimen
p
k, q
k, d
k( k = 1 , 2 ) Parameters related to the elasticity constants r , θ Crack tip polar coordinates
R Radius of DNBD or SCB specimen
S Half of support span length of the SCB specimen
̃ S, ̃ S
ijCompliance matrix in normalised form and its ij component
u
i, ̃ u
iDisplacement components along i and its normalised form xyz Crack tip Cartesian coordinate system
x
′y
′z
′Cartesian coordinate system aligned with the material principal directions
α Loading angle of the DNBD specimen
β Angle between the crack plane (x-axis) and principal direction 1 (x
′-axis)
κ, κ
i( i = 1 , 2 , 3 ) Constants dependent on ξ and the Poisson ’ s ratios μ
i, μ
′i( i = 1 , 2 ) Complex parameters in the coordinate systems xy and
x
′y
′ν , ν
′Poisson’s ratios within and normal to the isotropy plane ξ, η Ratios of anisotropy in Young ’ s modulus, E / E
′, and
apparent shear modulus, G
′/ G
′svσ
i, ̃ σ
iNormal stress and its normalised form in direction i σ
c, τ
cTensile and shear strength
̂ σ
c,̂ τ
cAverage tensile and shear strength
∊
i, ̃ ∊
iNormal strain and its normalised form in i direction τ
ij,̃ τ
ijShear stress ij and its normalised form
τ
c,1, τ
c,2Shear strength for failure along directions 1 and 2 γ
ij, ̃ γ
ijShear strain ij and its normalised form
Abbreviations
DNBD Double-edge notched Brazilian disk ERR Energy release rate
FPZ Fracture process zone
LEFM Linear elastic fracture mechanics SCB Semi-circular bend
SIF Stress intensity factor
MTS Maximum tangential stress
MERR Maximum energy release rate
Situated in the granitic formations of the Aare massif, this underground laboratory is underneath the Juchlistock at the depth of about 450 m [5].
Metamorphism processes caused the reorientation of sheet silicates during the Alpine deformation, whereby forming a clearly visible foli- ation plane which makes transverse isotropy an ideal elastic model for this rock type [30,31]. Experimental data in Ref. [30] show that the foliation plane of the Grimsel Granite coincides with a symmetry plane.
This enables us to identify the anisotropy orientation in the samples based on the orientation of the foliation plane. Let us define principal directions 1 and 2 along the foliation plane and perpendicular to it, respectively. The elastic properties of Grimsel Granite, measured from Brazilian disk and uniaxial compression tests, are as follows: E = 36 GPa and E
′= 18 GPa are the Young’s moduli along the foliation and normal to it, G
′= 10 GPa is the transverse shear modulus, and ν = 0 . 3 and ν
′= 0 . 15 are the Poisson ’ s ratios within and normal to the foliation plane [6,31] (see A). Also, the mode I fracture toughness is almost twice for cracks propagating along direction 2 (normal to the foliation) in com- parison to the ones propagating along direction 1 [6,8]. Measurements using the digital image correlation technique has also revealed that the length of the FPZ is about L
c= 10 mm [6]. Overall, the Grimsel Granite falls into the category of moderate anisotropic rocks with a quasi-brittle
behaviour due to its large FPZ size.
2.2. Fracture toughness tests
For measuring true mode II fracture toughness, K
IIc, we employed the DNBD test, an experiment based on the diametrical compression of a double-edge notched Brazilian disk specimen, schematically shown in Fig. 2a (see Ref. [25] for details). From the original cores of 60 mm radius, sub-cores of 47 mm radius were extracted parallel to the foliation plane, followed by cutting the sub-cores into Brazilian disks of about 30 mm thickness. Two external notches of about 37 mm length were then
τ τ σ σ
2(E ') 1(E)
Shear -based failure
τ τ
2(E ')
σ σ
σ σ
τ τ
2(E ') 1(E)
β=0° β=90° β
Tensile-based failure
K
IIc(β)= K
IIc,1cos
2β+K
IIc,2sin
2β K
Ic(β)= K
Ic,1cos
2β+K
Ic,2sin
2β
K
IIc,2K
Ic,2K
Ic,1K
Ic,21(E)
Fig. 1. Variations of mode I and true mode II fracture toughness values within an anisotropic plane.
Fig. 2. a) The schematics of the DNBD test for K
IIcmeasurement. b) A sample DNBD test on Grimsel Granite ( β = 90
◦).
Table 1
Geometrical details of the DNBD samples.
Radius (mm) a/R α
(◦) β(◦)Tests Thickness (mm)
47 0.8 10 0 5 26–38
22.5 5
45 5
67.5 4
90 5
introduced within planes that make five angles of β = 0
◦, 22 . 5
◦, 45
◦, 67 . 5
◦, 90
◦with respect to the foliation plane. Table 1 summarizes the specifications of the DNBD tests conducted on the Grimsel Granite samples.
To compare the results of K
IIcwith the ones of mode I fracture toughness (K
Ic), we also conducted semi-circular bend (SCB) tests for two configurations of crack extensions along the foliation ( β = 0
◦) and normal to it ( β = 90
◦), in order to measure the principal values of K
Ic,1and K
Ic,2. Nejati et al. [8] showed that the K
Icalong any other direction follows a sinusoidal fit of these two principal values. SCB samples of R = 47 mm radius, with notch length to the specimen radius of a / R = 0 . 5, and support span to the specimen radius of S / R = 0 . 6 were employed for testing, based on the guidelines described in Ref. [32].
All the DNBD and SCB tests were conducted using the Zwick/Roell universal testing machine with 100 kN load capacity. In the entire tests, the displacement rate was considered as 0 . 5 mm/min. For the DNBD tests, two wooden sheets were used as flexible jaws to properly distribute the applied load and prevent possible fracture initiations from the loading points (see Fig. 2b). For the SCB tests, two roller supports were utilized to reduce frictional forces between supports and the specimens. Fig. 3 shows DNBD and SCB specimens after fracturing at different orientations. As seen, a self-planar fracture growth is seen in all specimens. Once fracture loads were obtained from the tests, the frac- ture toughness of each sample was computed using geometry factors that were calculated through finite element analyses. Abaqus finite element package was utilized to model both DNBD and SCB samples using an anisotropic elasticity material model, with the elastic proper- ties given in Section 2.1. Details of finite element modelling can be found in Refs. [25,33].
2.3. Digital image correlation measurements
In order to obtain detailed strain fields near the notch tips in the DNBD specimens, the VIC-3D DIC setup consisting of two Prosilica GT 3400 cameras with the spatial resolution of 9.2 Megapixel and the focal length of 80 mm was utilized. Speckle patterns of suitable resolution were created on the surfaces of the specimens using a white spray to paint the background colour and a black airbrush to add random black dots. The reference (undeformed) images of the surfaces were taken at zero load, followed by taking images of deformed samples with the rate
of 1 frame per second. In all samples, the images associated to 95% of the peak load were selected to analyse the FPZ. In the post-processing stage, VIC-3D 8 software was utilized, where the subset size of 70 × 70 pixels and the step size of 2 pixels were considered to correlate the images of undeformed and deformed configurations.
3. Anisotropy of K
IIcTo analyse the fracture toughness anisotropy, let us first briefly describe the crack tip fields in an anisotropic plane. The details of such analysis are given in Appendix A. Consider an anisotropy plane with principal directions along x
′(direction 1) and y
′(direction 2), where β is the angle between x
′y
′and the reference coordinate system xy (see Fig. A.1). Also assume that E and E
′are the Young’s moduli along di- rections 1 and 2, respectively, ν and ν
′are the Poisson ’ s ratios within and perpendicular to the x
′z
′plane, and G
′is the transverse shear modulus in x
′y
′. The components of the compliance matrix in this plane can be written in terms of two dimensionless parameters ξ = E / E
′and η = G
′/ G
′sv, where G
′svis the approximated transverse shear modulus given by the Saint-Venant relation: 1 / G
′sv= 1 / E + ( 1 + 2 ν
′)/ E
′. The roots of the characteristic equation in Eq. A.6, denoted by μ
′1and μ
′2, are called the complex parameter and derive the dependence of elasticity solution on the elastic constants. The crack tip fields including stress, strain and displacement are then formulated in terms of the complex parameters in Eqs. (A.8)–(A.12).
Eqs. (A.8) and (A.10) show that the crack tip stress and strain dis- tributions subjected to pure mode II loading are proportional to one single parameter, the mode II stress intensity factor (SIF), K
II. This parameter fully characterises the crack tip fields under pure mode II loading in an area called the singular-dominant zone. We point out that only series expansions of infinite terms give the complete solution of the crack tip fields within an anisotropic plane [34,35]. The singular terms are in fact the dominant contributors to the fields within the singular- dominant zone [36]. Therefore, in cases where the FPZ of a mode II crack is smaller than the singular-dominant zone, fracture propagation criteria can be in principle formulated based on one single parameter, i.
e. K
II.
Since the work of Sih et al. [37], who laid out the foundation of the crack tip fields in anisotropic planes, many studies have investigated
Fig. 3. Self-planar growth under mode I (SCB) and true mode II (DNBD) along different orientations in Granite Granite.
different criteria for predicting propagation of cracks in anisotropic media. The maximum tangential stress (MTS, [7,38,39]) and the maximum energy release rate (MERR, [40–43]) are the most effective criteria in this context. The formulations of these criteria require differentiable continuous functions that characterise the variations of growth resistive forces, i.e. the critical SIF (fracture toughness) and the critical ERR (fracture energy), to predict the fracture growth path. Un- like a mode I crack for which a sinusoidal variations of fracture tough- ness has been introduced and validated [8,38,39], the variations of true mode II fracture toughness has been so far unexplored theoretically and experimentally. In the following, we present a theoretical basis for the variations of the fracture toughness and fracture energy in anisotropic planes, and suggest a simple relationship for the correlation between these two measures.
3.1. True mode II fracture toughness–K
IIcAccording to the critical SIF approach (also called the K-based approach), a crack propagates once stress, strain or their linear combi- nation exceeds a critical value at the crack tip region. For example, a mode I crack, which generally grows in a self-planar manner, extends when K
I(or equivalently tensile stress/strain in front of crack tip) attains a critical value referred to as K
Ic. K
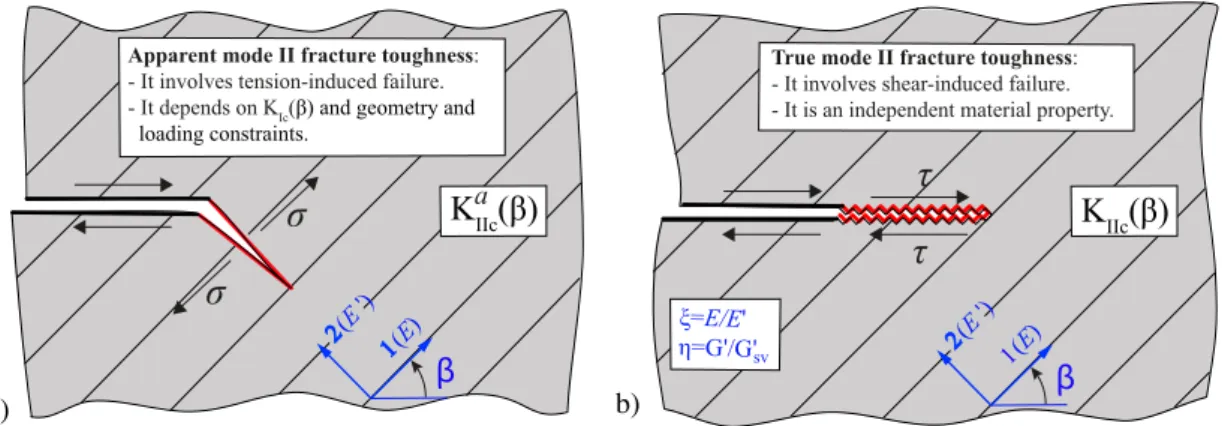
Icis generally considered as an inherent property of the material. Similar to mode I , a mode II crack, which normally tends to deflect towards a direction at which the tangential stress is maximum, extends when K
IIexceeds its critical value named as the apparent mode II fracture toughness, K
aIIc(see Fig. 4a).
However, a major difference to a mode I crack is that K
aIIcis not an inherent property of the material, but instead a parameter that depends on K
Icof the material as well as the geometrical and loading constraints of the cracked specimen. Many mode II laboratory tests indeed measure this apparent fracture toughness rather than an inherent property of the material (see Ref. [20] for two examples).
For example, it is experimentally and theoretically proven that a mode II crack in an isotropic brittle material grows once K
IIreaches K
aIIc≈ 0 . 87K
Ic, at a kink angle of about 71
◦[15]. This is only valid as long as the FPZ lays within the singular-dominant zone of the crack [16].
For the cases where the FPZ lays outside the singular-dominant zone, and failure still happens due to the tensile stress, the higher order terms of crack tip field (such as the T-stress) may influence the apparent mode II fracture toughness and kink angle, but K
aIIcstill remains as a dependent parameter to K
Ic[44]. T-stress is the first non-singular term in the series expansion of crack tip stress distribution, that acts parallel to the crack.
In such cases, the kink angle or K
aIImay vary, but in most cases they can be estimated using the MTS or MERR criteria by including non-singular terms in the crack tip fields.
Let us now consider the case where a mode II crack propagates in a self-planar manner and solely due to the shear stresses, as in true mode II fracturing (see Fig. 4b). This behaviour mainly happens due to the
loading confinement (e.g. large negative K
Ior T-stress) that supresses any kink formation at the crack tip [25]. In such cases, mode II frac- turing happens when K
II(or equivalently shear stresses ahead of crack tip) reaches its critical value, K
IIc. Here, K
IIcis an inherent property of the material, and therefore completely independent of K
Ic. In fact, K
IIcrepresents the strength of the cohesion that resist any type of shear sliding at the crack tip region. Similar to the K
Icof anisotropic materials, which follows continuous variations with direction, the K
IIcalso exhibits direction dependence.
Assume that the shear strength of rock associated to failures along directions 1 and 2 are τ
c,1and τ
c,2, respectively. Also consider β as the angle between a failure plane and the principal direction 1. The shear strength associated to failure along the direction β can be approximated by τ
c(β) = τ
c,1cos
2β + τ
c,2sin
2β . We write this equation based on the balance of force along the direction β , provided that normal stresses in directions 1 and 2 are neglected. This equation shows that for failure to occur along direction β, the associated shear force must be large enough so that its components along directions 1 and 2 exceed the corre- sponding resistive shear forces along those directions. Let us now as- sume that K
IIc,1and K
IIc,2are the principal values of K
IIalong the principal directions 1 and 2, respectively. The relationship between the shear stress along the crack bisector and the mode II SIF follows τ =
K
II/ ̅̅̅̅̅̅̅̅
2 π r
√ . At the onset of fracture growth, one can assume that the stress at a critical distance r
creaches the shear strength of the material: τ
c=
K
IIc/ ̅̅̅̅̅̅̅̅̅
2 π r
c√ . Subsituting this relatioship into τ
c(β) = τ
c,1cos
2β + τ
c,2sin
2β , and assuming that r
cis direction-independent yields
K
IIc( β )
= K
IIc,1cos
2β + K
IIc,2sin
2β (1)
Eq. (1) provides a smooth function for K
IIcthat can be potentially used in any stress-based fracture growth criteria. However, it should be first validated through experimental data before putting into practice. Sec- tion 4.1 demonstrates the accuracy of Eq. (1) when fitting to the experiment data on Grimsel Granite.
3.2. True mode II fracture energy–𝒢
IIcFor a linear elastic material, the energy release rate (ERR) is the rate of decrease in the potential energy of solid (Π) with an increase in crack surface, A : 𝒢 = − dΠ/dA. The maximum ERR assumes that crack propagation takes place when the energy released by an increment of crack advancement, 𝒢 , is enough to surpass the critical value of the ERR, 𝒢
c, that is referred to as the fracture energy [45]. In quasi-brittle materials such as concrete, fracture energy is often denoted by 𝒢
f[46]. 𝒢
cis considered as the energy needed to generate a unit area of fracture surface. When assuming a self-planar crack extension, linear elastic fracture mechanics (LEFM) theory provides a relation between the SIF and energy release rate in each mode of loading. These relations are fully developed for cracks in an anisotropic medium by Ref. [37], followed by
2 ( E ') 1 ( E ) β τ
τ
True mode II fracture toughness:
- It involves shear-induced failure.
- It is an independent material property.
σ σ
Apparent mode II fracture toughness:
- It involves tension-induced failure.
- It depends on K
Ic(β) and geometry and loading constraints.
K a IIc (β)
a) b)
2 ( E ') 1 ( E ) β
K IIc (β)
ξ=E/E' η=G'/G'
svFig. 4. Schematics of the difference between a) apparent mode II fracture toughness and b) true mode II fracture toughness.
discussions put forward by Refs. [47 – 49].
To obtain the relationship between mode II SIF and ERR, a crack with the initial length of a +Δa is assumed to be subjected to pure mode II loading. Then, the work required to reverse the shear slip along the section Δa by applying a reverse shear stress is calculated. By utilizing the shear stress component τ
xyand the relative displacements of the crack surfaces from Eqs. (A.8) and (A.11), the mode II ERR, for the limit Δa→0, is presented by [37]
𝒢
II= K
2II2E ̃ S
11I( μ
1+ μ
2). (2)
Here, I indicates the imaginary part of a complex number. We point out that due to the self-planar growth assumption, Eq. 1 gives the ERR due to an extension along the crack plane, and not the ERR due to the formation of a kink. When a material undergoes a true mode II fracturing, the MERR criterion expresses that 𝒢 = 𝒢
IIsurpasses 𝒢
IIcat the onset of crack propagation, where 𝒢
IIcis the true mode II fracture energy. In fact, 𝒢
IIcis considered as the energy needed to generate a unit fracture surface in the crack plane by applying the mode II loading. Rewriting Eq. (1) at the onset of fracture growth gives the relation between direction dependent true mode II fracture energy, 𝒢
IIc(β) , and the direction dependent true mode II fracture toughness, K
IIc(β) , as
𝒢
IIc(
β )
= K
2IIc( β )
2E ̃ S
11I( μ
1+ μ
2). (3)
We note that 𝒢
IIcincludes only the energy needed to introduce rupture at the tip, and does not include any energy dissipation by a potential frictional sliding along the fracture surfaces. When substituting the complex parameters from Eq. (A.6) together with Eqs. (A.7) and (A.3) into Eq. (3), the true mode II fracture energy yields as a function of fracture toughness (K
IIc), the elastic parameters E , ν
′, ν , ξ, η as well as the anisotropy direction β . This relation is lengthy and complex for generic elastic constants. However, for the special case of plane-stress condition and η = 1, one can simplify Eq. (3) into the following simple form 𝒢
IIc( β
)
= K
2IIc( β ) 2E
[(
1 + ̅̅̅
√ ) ξ cos
2β +
( ξ + ̅̅̅
√ ) ξ sin
2β
]
. (4)
We note the Saint-Venant relation gives an accurate estimate of G
′for many rock-type materials. This suggests that, for rocks, the value of η is often close to unity [33]. Eq. (4) gives the exact relationship between 𝒢
IIcand K
IIcunder two assumptions: 1) plane-stress condition, and 2) η = 1.
The relation for 𝒢
IIcbecomes complex and lengthy in the plane-strain condition even under the assumption of η = 1. In that case, a good approximation of 𝒢
IIccan still be formulated using the roots of the plane- stress characteristic equation (Eq. A.6). Such derivation follows 𝒢
IIc( β
)
= K
2IIc( β ) 2E
[ κ
1( 1 + ̅̅̅
√ ) ξ
cos
2β + κ
2( ξ + ̅̅̅
√ ) ξ sin
2β
] (5)
where κ
1and κ
2are dependent parameters on the elastic constants: κ
1= 1 − ν
2, κ
2= 1 − ξ ν
′2. Note that negligible terms are omitted when deriving Eq. (5). Eqs. (4) and (5) are helpful in providing simple mathematical functions to relate K
IIcaand 𝒢
IIcin rocks. Table 2 sum- marises the relationships for the variations of both fracture toughness and fracture energy. These relationships are simplified for isotropic
materials (K
IIc,1= K
IIc,2= K
IIc, E
′= E , G = E / 2 ( 1 + ν ) ) to the well- known relationships presented in Table 3.
4. Results and discussion
4.1. Fracture toughness and fracture energy variations
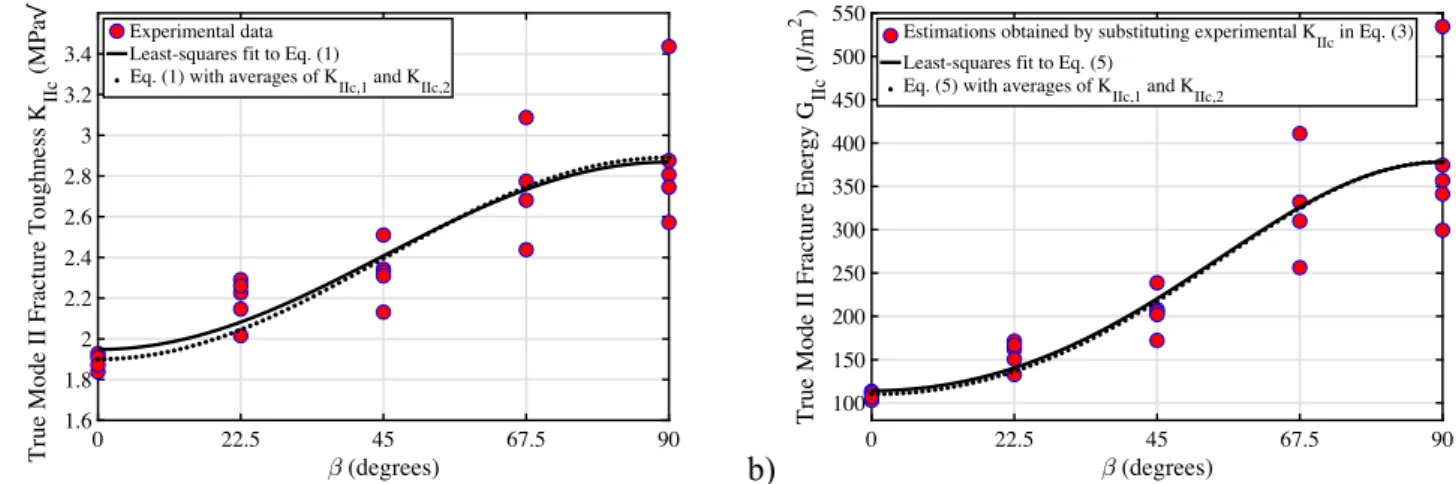
Fig. 5a presents the experimental data on K
IIcagainst the angle β for the tested Grimsel Granite samples. The values of K
IIc(β) are obtained by calculating the mode II SIF at the fracture load, using the geometry factors obtained from the finite element analysis of an anisotropic DNBD sample [25]. We note that the notches in the DNBD sample are not subjected to a pure mode II loading. This is because the mode I SIF is not zero, and holds small negative values. However, the mode I SIF is un- likely to contribute to the failure at the notch tip since along the notch plane, where the shear failure occurs, mode I loading only contributes to compressive normal stresses.
A careful examination of the test data in Fig. 5a shows a gradual increase in the data scatter with β. In fact, the standard deviation of the fracture toughness data shows an increase of about 700% from β = 0
◦to β = 90
◦. The results of mode I experiments on Grimsel Granite also show a similar trend [8]. This trend in scatter may be attributed to the change of micro-cracking mechanism from dominant intergranular at β = 0
◦to dominant transgranular at β = 90
◦. For crack growth along foliation (β = 0
◦), fracturing occurs along the sheet silicates such as biotite and chlorite, indicating a dominant intragranular micro-cracking mecha- nism aligned with a biotite-rich plane. In fracture growth normal to the foliation (β = 90
◦), however, crack seems to break through patches of stiffer quartz and feldspar minerals, whereby indicating a dominant transgranular micro-cracking mechanism. Since the Grimsel Granite has large grains, e.g. quartz grains of up to about 1 cm size, its heterogeneity can influence the fracture toughness data in a transgranular growth mechanism much more than in a intergranular one. For example, a quartz grain sitting at the crack front can cover about one-third of crack front length, and significantly influence the fracture toughness when micro-cracking mechanism is mainly transgranular. This may be the reason for the increase in the data scatter with β .
The solid line in Fig. 5a represents the least-squares fit, employing the relation presented in Eq. (1). The dotted line also represents Eq. (1) when the averages of the experimental data of K
IIc,1( β = 0
◦) and K
IIc,2(β = 90
◦) are substituted. As seen, the experimental data fits well the sinusoidal function introduced in Eq. (1). This gives supporting evidence
Table 2
The correlation of fracture toughness and fracture energy in anisotropic materials ( η = 1). κ
1= κ
2= 1, and κ
1= 1 − ν
2, κ
2= 1 − ξ ν
′2for the plane-stress and plane- strain conditions, respectively.
Driving force Resistive force Variation type Anisotropy ratio
SIF–K
IITrue mode II fracture toughness–K
IIc(β)K
IIc(β) =K
IIc,1cos2β+K
IIc,2sin2βK
IIc(π
/2
)K
IIc(0
) =K
IIc,2K
IIc,1ERR–𝒢
IITrue mode II fracture energy–𝒢
IIc(β)𝒢IIc
( β) =
K
2IIc(β)2E
[κ1
(
1
+ ̅̅̅√ )ξ cos2β+κ2
( ξ+ ̅̅̅
√ )ξ sin2β
]
𝒢IIc(
π
/2
) 𝒢IIc(0
) =(
K
IIc,2K
IIc,1)2⎛
⎝κ2
( ξ+ ̅̅̅
√ξ) κ1
(
1
+ ̅̅̅√ξ)
⎞
⎠
Table 3
Equivalency of true mode II fracture toughness and true mode II fracture energy in an isotropic material [50]. κ = ( 3 − ν )/( 1 + ν ) and κ = 3 − 4 ν for plane-stress and plane-strain conditions, where E , ν and G are the Young ’ s modulus, the Poisson ’ s ratio and the shear modulus.
Driving
force Resistive force Resistive force
in K
IIcResistive force in
𝒢IIcSIF–K
IITrue mode II fracture toughness
–K
IIcK
IIc̅̅̅̅̅̅̅̅̅̅̅̅̅̅̅̅̅̅
8G
κ+1
𝒢IIc√
ERR–𝒢
IITrue mode II fracture energy–𝒢
IIcκ+
1
8G K
2IIc 𝒢IIcthat the sinusoidal function given by Eq. (1) provides an appropriate type of variation for K
IIcof Grimsel Granite, and possibly other types of anisotropic rocks. Morever, Eq. (1) with averages of K
IIc,1and K
IIc,2matches well with the least-square fit. The significance of this finding is that one can use two principal values of K
IIcmeasured along the two principal material directions, i.e. K
IIc,1and K
IIc,2, to estimate K
IIcin other orientations.
Fig. 5b demonstrates the variations of the true mode II fracture en- ergy, 𝒢
IIcagainst β. The values of 𝒢
IIcare calculated by inputting the data of K
IIcand the elasticity parameters presented in Section 2.1, into Eq.
(3). The solid line shows the least-squares fit to Eq. (5) when the elastic constants are substituted. The dotted line is also obtained by substituting the averages of experimental data on K
IIc,1and K
IIc,2into Eq. (5). We point out that the values of 𝒢
IIcare not directly determined but they are instead calculated using the measured values of K
IIcand employing the LEFM theory. The reason is that the direct measurements of 𝒢
IIcis more challenging than the measurement of K
IIcsince it requires a test with a stable crack growth. The good match of the solid and dotted lines in Fig. 5b shows that Eqs. (4) and (5) could be simply used to estimate 𝒢
IIcand its direction dependence from the measured fracture toughness values at principal directions, i.e. K
IIc,1and K
IIc,2. Eqs. (4) and (5) in conjunction with Eq. (1) are therefore of considerable help when employing an energy-based growth criterion for anisotropic rocks. An important application is indeed with phase-field models where a direction-dependent fracture energy can be simply prescribed.
We point out that K
IIcis generally expected to be dependent on the normal stress applied on the fracture plane. This is due to the important role of frictional dissipative processes in shear-based fracturing. Since the normal stress within the FPZ is controlled by K
I, the ratio K
II/ K
Iis important when reporting values of K
IIc. In the DNBD sample, this ratio is controlled mainly by α and, to a lower extent, by the ratio a / R.
With the DNBD configuration used in this study (a / R = 0 . 8 , α = 10
◦), the ratios K
I/ K
II= 0 . 23 and K
I/ K
II= 0 . 32 respectively apply to the configurations β = 0
◦and β = 90
◦. Based on these ratios, and assuming a linear elastic behaviour, the mode I SIF at the onset of fracture propagation is calculated as K
I= − 0 . 44 MPa ̅̅̅̅
√ m
and K
I=
− 0 . 93 MPa ̅̅̅̅
√ m
for β = 0
◦and β = 90
◦, respectively. These are signifi- cant figures, indicating that the plane of failure is in fact under signifi- cant compressive forces when fracture growth occurs. Therefore, K
IIcvalues reported in this paper are only applicable to cases where such compressive normal stresses are present. In general, K
IIcshould be developed as a function of the normal stress applied to the notch plane, which is directly dependent on K
Iat the failure load. A frictional constitutive law can facilitate developing such a dependence (see Ref. [25]).
4.2. Fracture process zone
Fig. 6 presents the full-field deformation (maximum principal strain at 95% of peak-load) ahead of the notch tips in the DNBD samples of Grimsel Granite. Each column contains three tests with the same angle β between the notch plane and the principal direction 1 (foliation plane).
These images demonstrate the localisation of strain at the notch tips, thereby shedding light on the size, shape and orientation of the FPZ in DNBD samples.
Note that strain is the secondary output in the DIC analysis, that is derived from the gradients of the directly measured displacements by means of smoothing techniques. Although the directly-measured displacement fields are more accurate, strains are also reliable param- eters to identify the FPZ region, provided that appropriate smoothing parameters of step size and filter size are employed (see Ref. [6]). In this paper, we used the subset size of 70 × 70 pixels and the step and filter sizes of 2 pixels and 7 points, respectively.
The following remarks are noted with regard to the PFZ development in true mode II tests:
• Although some FPZs are oriented along the notch plane, some others, particularly the ones in samples with large β, are tilted with respect to the notch plane. These tilted FPZs make angles between 60
◦and 90
◦with respect to the notch plane. The fact that the maximum tangential stress occurs at such orientations indicates the tendency of crack kinking by tensile stresses in the tests. However, the final fracturing in none of the tests takes place along these tension-based FPZs.
• The fact that the final fracturings of all samples happen along the notch plane supports the argument that any kink formation along the development of tilted tension-based FPZs is eventually arrested. This is explained theoretically by the large compressive T-stress which acts parallel to the crack and prevents the growth of such tension- induced kinks (see Bahrami et al. [25]). In contrast, the FPZs developed along the ligaments cannot be arrested by the compressive T-stress.
• Perhaps, in those tests with tilted FPZs in Fig. 6, a second FPZ is developed along the notch plane, that does not appear in the images.
However, more test results are required to validate this hypothesis that two FPZs, one shear-induced and one tension-induced, can develop independently. There is also a possibility that crack starts growing along the tilted tension-induced FPZ, but arrests at some distance from the notch tip. Acoustic emission tests can indeed give valuable information on the process of true mode II FPZ development.
a) 0 22.5 (degrees) 45 67.5 90
1.6 1.8 2 2.2 2.4 2.6 2.8 3 3.2 3.4
True Mode II Fracture Toughness K
IIc(MPa m )
Experimental data Least-squares fit to Eq. (1)
Eq. (1) with averages of KIIc,1 and KIIc,2
b) 0 22.5 (degrees) 45 67.5 90
100 150 200 250 300 350 400 450 500 550
True Mode II Fracture Energy G
IIc(J/m
2)
Estimations obtained by substituting experimental KIIc in Eq. (3) Least-squares fit to Eq. (5)
Eq. (5) with averages of KIIc,1 and KIIc,2
Fig. 5. Experimental and theoretically-fitted variations of true mode II a) fracture toughness and b) fracture energy for Grimsel Granite.
• The regions along the notch planes, which are mostly of blue and green colours, are also subjected to strain concentrations. This shows how strains are localised in these regions, and eventually cause the final fracturing. The formation of shear-based FPZ along the ligament is also clear in some samples with small β. This is because in these configurations, the formation of a tension-based kink requires extension along angles almost normal to the foliation (strong direc- tion), and may therefore be suppressed at the early stages of load application by the shear-based failure that takes place along the foliation (weak direction).
• The true mode II FPZ at the notch tip develops in a semi-elliptical shape, that is similar to the FPZ shape in mode I tests (see Ref. [6]).
• The length of the FPZ is in the order of 1 cm, that is also in agreement with the length of the FPZ developed in front of mode I cracks, re- ported by Dutler et al. [6].
4.3. Comparision to modes I and III
Table 4 compares the principal values of K
IIcand 𝒢
IIcwith the ones of mode I determined from the SCB tests. As is seen, in both modes of fracturing, the fracture toughness and energy are significantly higher along direction 2 in comparison to direction 1. Additionally, the fracture toughness and energy of true mode II are considerably higher than the ones of mode I . This suggests that true mode II energy dissipative pro- cesses are completely different than the ones associated with the mode I.
Unlike true mode II for which frictional energy dissipative processes
accounts for the majority of the fracture energy, mode I fracturing mainly happens simply via intergranular and transgranular de-cohesion processes in the material.
Recently, Bahrami et al. [51] proposed a simple test for true mode III fracturing of rocks. The results of these tests along the foliation (K
IIIc= 1 . 61 MPa ̅̅̅̅
√ m
, 𝒢
IIIc= 110 MPa ̅̅̅̅
√ m
) demonstrate that the values of true mode II and III fracture toughness and fracture energy have a good agreement with each other. Note that the relationship between K
IIIcand 𝒢
IIIcalong the principal direction 1 follows 𝒢
IIIc= K
2IIIc/ 2 ̅̅̅̅̅̅̅̅
GG
′√ [37].
The similarity of true mode II and III toughness values could be explained by the fact that a shear-induced failure takes place in both modes. In particular, the identical values of the fracture energies of true mode II and true mode III indicates similar energy dissipation processes in these modes of crack extension.
4.4. The effects of sample size
The FPZ size in Grimsel Granite is rather large due to its large grain size. Using DIC measurements, Dutler et al. [6] reported a FPZ length of about 10 mm for mode I cracks in the SCB samples. This FPZ length is rather large compared to the size of the tested samples (R = 47 mm).
The DIC measurements in this study also suggest a FPZ length of about 10 mm ahead of mode II cracks in the DNBD specimen of R = 47 mm radius (see Fig. 6). The choice of the sample size in the current experi- mental study was restricted by the size of the available core material extracted from the Grimsel underground laboratory. This type of re- striction often applies to many industrial geo-mechanical projects where the core diameter is strictly limited by the borehole diameters, that is in the order of 3–4 inches.
One implication of such large FPZ length is that the LEFM concepts may not be applicable to small samples, since a large portion of the sample deforms nonlinearly. Another implication is that since this large FPZ sits outside the singular-dominant zone in a small sample, the measured fracture toughness is often underestimated due to the influ- ence of higher order terms. Based on a detailed theoretical and experi- Fig. 6. Fields of the maximum principal strain at 95% of the peak load, demonstrating the fracture process zone developed ahead of true mode II cracks in Grimsel Granite. For each β , the FPZ development in three samples are presented.
Table 4
Comparisons of the fracture toughness and energy of true mode II with the ones of mode I for Grimsel Granite.
Crack loading Fracture Toughness (MPa
̅̅̅̅√m
) Fracture Energy (J/m
2)
β=
0
◦ β=90
◦ β=0
◦ β=90
◦Mode I 0.78 1.35 28 56
True mode II 1.90 2.88 110 376
mental study, Ghouli et al. [52] suggested size-dependent scaling factors that compensate for this underestimation of fracture toughness in mode I SCB samples. Bahrami et al. [53] later extended this model for the DNBD specimens, and introduced similar scale-dependent correction factors to compensate for the underestimation of K
IIcin small DNBD samples.
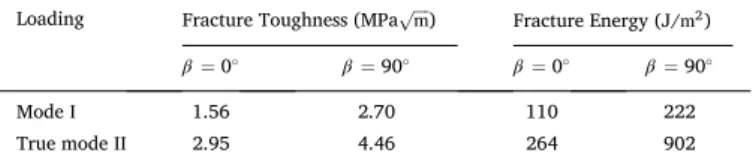
Although the studies in Refs. [52,53] are based on isotropic material behaviour, we can still apply their correction procedure to obtain rough estimates of scale-independent fracture toughness in Grimsel Granite.
Let us consider the average tensile strength of ̂ σ
c= 10 . 2 MPa [6], as well as the average mode I fracture toughness of ̂ K
Ic= 1 . 07 MPa ̅̅̅̅
√ m . The dimensionless sample radius for the SCB sample is calculated by R
*= R /( K ̂
Ic/̂ σ
c)
2= 4 . 28, which is associated to the correction factor of about C
k= 2 for the SCB configuration used in this study (a / R = 0 . 5 , S / R =
0 . 6) (see Ref. [52] for details). To apply a similar procedure for true mode II tests, we consider an average true mode II fracture toughness of K ̂
IIc= 2 . 39 MPa ̅̅̅̅
√ m
. Since no value is available for the average shear strength of Grimsel Granite, we use the following approximation: ̂ τ
c=
̂ σ
c× K ̂
IIc/ K ̂
Ic= 22 . 8 MPa. This yields the same dimensionless radius as the one obtained for the SCB samples, i.e. R
*= R /( ̂ K
IIc/̂ τ
c)
2= 4 . 28.
This dimensionless radius is associated to the correction factor of about 1.55 for the DNBD test results (see Ref. [53] for details).
Table 5 presents the estimated values of scale-independent mode I and true mode II fracture toughness and fracture energy of the Grimsel Granite along its principal directions. As expected, due to the small sample size and large FPZ length, the measured fracture toughness of Grimsel Granite is significantly underestimated. In addition, true mode II values of fracture toughness and fracture energy are significantly higher than the corresponding mode I values. This explains why a mode II crack often tends to kink and follow a tensile failure unless a signifi- cant loading constraint supresses the formation of kink cracks and fa- vours crack advancement by shear stresses.
5. Conclusions
Main conclusions of the current article are as follows: 1) The experiment results on anisotropic Grimsel Granite validate the theoret-
ical model that true mode II fracture toughness indeed follows a sinu- soidal variation between the two principal values determined along the principal directions of the material. The significance of this finding is that once the principal values of K
IIcare measured, the fracture tough- ness along any direction can be estimated. 2) The unique dependency of the true mode II fracture toughness and fracture energy for anisotropic rocks are given in terms of a simplified relation. Given that the fracture toughness values and elastic constants are known in principal directions, the fracture energy along any other direction can be simply estimated by the suggested relation. This relation is of significant importance when predicting fracture growth path using the MERR criterion in anisotropic rocks. 3) Analysing the FPZ ahead of a true mode II crack shows that it develops in a semi-elliptical shape and has a comparable size with the one of a mode I crack. In addition, the fact that in several cases the FPZ is tilted with respect to the notch plane demonstrates the tendency of the notch to kink and grow by the tensile stress. Since all notches eventually propagate along the notch plane, any potential tension-induced kink seems to be arrested in the tested DNBD samples, causing a shear-based failure to eventually prevail. 4) K
IIcand 𝒢
IIcof Grimsel Granite exhibit strong anisotropy, with anisotropy ratios of about 1.5 and 3.5, respec- tively. Additionally, K
IIcand 𝒢
IIcare significantly higher than the ones of mode I, while being comparable to the ones of true mode III.
CRediT authorship contribution statement
Morteza Nejati: Conceptualization, Formal analysis, Resources, Writing - original draft, Writing - review & editing, Visualization, Funding acquisition, Project administration. Bahador Bahrami: Meth- odology, Investigation, Writing - review & editing, Visualization. Majid Reza Ayatollahi: Supervision, Writing - review & editing. Thomas Driesner: Supervision, Writing - review & editing, Funding acquisition.
Declaration of Competing Interest
The authors declare that they have no known competing financial interests or personal relationships that could have appeared to influence the work reported in this paper.
Acknowledgement
This research received financial support from the Swiss Federal Of- fice of Energy, grant Sl/501912-01. The first author is thankful for the financial support by the Swiss Innovation Agency Innosuisse to the Swiss Competence Center for Energy Research - Supply of Electricity (SCCER- SoE). The authors would also like to thank Dr. Gunter Siddiqi for his valuable scientific input.
Appendix A. Crack tip fields in an anisotropic medium
Assume the coordinate system x
′y
′with x
′and y
′respectively oriented along and normal to the isotropy plane (x
′z
′) of a transversely isotropic material (see Fig. A.1). The Hooke ’ s law within x
′y
′for the plane-stress condition is presented by
⎡
⎣
∊
x′∊
y′γ
x′y′⎤
⎦ =
⎡
⎢ ⎢
⎢ ⎢
⎢ ⎢
⎢ ⎣ 1 E − ν
′E
′0
− ν
′E
′1 E
′0
0 0 1
G
′⎤
⎥ ⎥
⎥ ⎥
⎥ ⎥
⎥ ⎦
⎡
⎣ σ
x′σ
y′τ
x′y′⎤
⎦ (A.1)
where E and E
′are respectively the Young ’ s moduli along the directions x
′and y
′, while G
′and ν
′are the shear modulus and Poisson ’ s ratio within x
′y
′. For plane-strain case, the compliance matrix is obtained by the following re-definitions: E ↦ E /( 1 − ν
2), E
′↦ E
′/[ 1 − ( E / E
′) ν
′2] and ν
′↦ ν
′( 1 +
ν )/[ 1 − ( E / E
′) ν
′2] , where ν is the Poisson’s ratio within the isotropy plane x
′z
′. Table 5
Estimated size-independent values of fracture toughness and fracture energy for Grimsel Granite.
Loading Fracture Toughness (MPa
̅̅̅̅√m
) Fracture Energy (J/m
2)
β=
0
◦ β=90
◦ β=0
◦ β=90
◦Mode I 1.56 2.70 110 222
True mode II 2.95 4.46 264 902
Let us consider xy coordinates formed via rotating x
′y
′by − β along z
′, as shown in Fig. A.1. Transforming Eq. (A.1) into xy coordinate system gives
⎡
⎢ ⎢
⎣
∊
x∊
yγ
xy⎤
⎥ ⎥
⎦ = 1 E
⎡
⎢ ⎢
⎣
̃ S
11̃ S
12̃ S
16̃ S
12̃ S
22̃ S
26̃ S
16̃ S
26̃ S
66⎤
⎥ ⎥
⎦
⏟̅̅̅̅̅̅̅̅̅̅̅̅̅̅⏞⏞̅̅̅̅̅̅̅̅̅̅̅̅̅̅⏟
̃
S⎡
⎢ ⎢
⎣ σ
xσ
yτ
xy⎤
⎥ ⎥
⎦ , (A.2)
where
̃ S
11= κ
1cos
4β + κ
2ξsin
4β +
( 1 + ξ + 2ξ ν
′(1 − κ
3η ) 4 η
) sin
22β,
̃ S
12=
( (κ
1+ κ
2ξ) η − (1 + 2 ν
′)ξ − 1 4 η
)
sin
22β − κ
3ξ ν
′( cos
4β + sin
4β ) ,
̃ S
16= [
κ
1cos
2β − κ
2ξsin
2β −
( 1 + ξ + 2ξ ν
′(1 − κ
3η ) 2 η
) cos2β
] sin2β,
̃ S
22= κ
1sin
4β + κ
2ξcos
4β +
( 1 + ξ + 2ξ ν
′(1 − κ
3η ) 4 η
) sin
22β,
̃ S
26= [
κ
1sin
2β − κ
2ξcos
2β +
( 1 + ξ + 2ξ ν
′(1 − κ
3η ) 2 η
) cos2β
] sin2β,
̃ S
66= (κ
1+ κ
2ξ + 2κ
3ξ ν
′)sin
22β +
( 1 + ξ + 2ξ ν
′η
) cos
22β,
(A.3)
Here, κ
1= κ
2= κ
3= 1 for the plane-stress and κ
1= 1 − ν
2, κ
2= 1 − ξ ν
′2, κ
3= 1 + ν for the plane-strain condition. The dimensionless parameters ξ and η are also given by
ξ = E
E
′, η = G
′G
′sv(A.4)
where G
′svis the transverse shear modulus approximated from the well-known Saint-Venant relation: 1 / G
′sv= 1 / E + ( 1 + 2 ν
′)/ E
′. The reasons for employing ξ, η to formulate the elasticity tensor are given in detail in Refs. [7,31].
Using the Airy stress function, the general solution of an anisoptric two-dimensional elasticity problem depends on the roots of [54]
̃ S
11μ
4− 2 ̃ S
16μ
3+ (
2 ̃ S
12+ ̃ S
66)
μ
2− 2 ̃ S
26μ + ̃ S
22= 0. (A.5)
which are complex, and always occur in conjugate pairs: μ
1= a
1+ ib
1, μ
2= a
2+ ib
2, μ
3= μ
1, μ
4= μ
2. The simplest relations for these complex parameters are obtained in x
′y
′. Substituting Eq. (A.3) into Eq. (A.5) yields
μ
′4+ [ 1 + ξ
κ
1η + 2ξ ν
′1 − κ
3η κ
1η
] μ
′2+ κ
2κ
1ξ = 0 . (A.6)
x,u
y,u σ
yσ
xτ
xyCrack θ
r
β
x y