Research Collection
Journal Article
How food choices link sociodemographic and lifestyle factors with sustainability impacts
Author(s):
Frehner, Anita; van Zanten, Hannah H.E.; Schader, Christian; de Boer, Imke J.M.; Pestoni, Giulia;
Rohrmann, Sabine; Müller, Adrian Publication Date:
2021-06-01 Permanent Link:
https://doi.org/10.3929/ethz-b-000479180
Originally published in:
Journal of Cleaner Production 300, http://doi.org/10.1016/j.jclepro.2021.126896
Rights / License:
Creative Commons Attribution-NonCommercial-NoDerivatives 4.0 International
This page was generated automatically upon download from the ETH Zurich Research Collection. For more information please consult the Terms of use.
ETH Library
How food choices link sociodemographic and lifestyle factors with sustainability impacts
A. Frehner
a,b,*, H.H.E. Van Zanten
b, C. Schader
a, I.J.M. De Boer
b, G. Pestoni
c, S. Rohrmann
c, A. Muller
a,daDepartment of Socioeconomics, Research Institute of Organic Agriculture FiBL, Frick, Switzerland
bAnimal Production Systems group, Wageningen University&Research, Wageningen, the Netherlands
cDivision of Chronic Disease Epidemiology, Epidemiology, Biostatistics and Prevention Institute, University of Zurich, Zurich, Switzerland
dInstitute of Environmental Decisions, Federal Institutes of Technology Zurich ETHZ, Zurich, Switzerland
a r t i c l e i n f o
Article history:
Received 14 July 2020 Received in revised form 24 March 2021 Accepted 25 March 2021 Available online 30 March 2021 Handling editor: Yutao Wang
Keywords:
Food consumption Sustainability
Global warming potential Land occupation Social risks Diet quality
a b s t r a c t
While the production of food causes major environmental impacts and poses social risks, consumption of healthy and nutritious food is essential for human wellbeing. Against this background, action to make current diets more sustainable is needed, which in turn requires knowledge on possibilities for improvement. In this study, we investigated how sociodemographic and lifestyle factors relate to different sustainability impacts of diets in Switzerland using recent dietary recall data (n¼2057). Of each dietary recall, we assessed six impacts: global warming potential, cropland and grassland occupation, social risks, diet quality, and diet cost. We investigated the association between sociodemographic and lifestyle factors and food choices as well as between sociodemographic and lifestyle factors and envi- ronmental and socio-economic impacts, and combined these results in a qualitative approach. The median impacts of Swiss dietary recalls were 3.25 kg CO2eq for global warming potential, 4.92 m2for cropland occupation, and 1.43 m2for grassland occupation. Further, the median score for social risks was 1.64 eþ08 points (Social Hotspots Index), for diet quality 43.65 points (Alternate Healthy Eating Index), and 9.27 CHF for diet cost. Moreover, our results showed that any action on food groups, be it for health, social, or environmental reasons, potentially affects societal groups differently. Nationalities, language regions, age groups, and smoking status seemed particularly distinctive, while income or educational groups seemed hardly relevant. Further, reductions of some food groups, especially different types of meat, offer large potentials for synergies on multiple impact categories. Others, such as fruits and veg- etables as well asfish and seafood, result in trade-offs. On the one hand, these food groups contribute to an improved diet quality. On the other hand, these food groups are costly, and the production of fruits and vegetables additionally poses social risks. Our results contribute to target measures to support environmentally-friendly, healthy, and social diets more effectively.
©2021 The Author(s). Published by Elsevier Ltd. This is an open access article under the CC BY-NC-ND license (http://creativecommons.org/licenses/by-nc-nd/4.0/).
1. Introduction
While consuming healthy and nutritious food is essential for human wellbeing, the associated food production causes adverse impacts on the environment and poses social risks (Poore and Nemecek, 2018;Willett et al., 2019). Agriculture contributes sub- stantially to approaching or transgressing several planetary boundaries (Campbell et al., 2017; Steffen et al., 2015). In fact,
agriculture’s share of anthropogenic greenhouse gas (GHG) emis- sions is currently around 23%, including agriculturally-driven land use change (Intergovernmental Panel on Climate, 2019). Around 40% of earth’s land surface is used for croplands and pastures (Foley et al., 2011). Food production, however, not only threatens the environment in multiple ways, but also causes social risks, e.g.
related to labour conditions (Benoit-Norris et al., 2012). Moreover, diets link impacts caused by food production with food consump- tion, and thus via diet quality with impacts on human health (Tilman and Clark, 2014). Several studies found that certain dietary patterns increase the risk for non-communicable diseases, such as diabetes, cardiovascular disease, stroke, and cancer (Afshin et al.,
*Corresponding author. Department of Socioeconomics, Research Institute of Organic Agriculture FiBL, Frick, Switzerland.
E-mail address:anita.frehner@fibl.org(A. Frehner).
Contents lists available atScienceDirect
Journal of Cleaner Production
j o u rn a l h o m e p a g e : w w w . e l s e v i e r . c o m / l o c a t e / j c l e p r o
https://doi.org/10.1016/j.jclepro.2021.126896
0959-6526/©2021 The Author(s). Published by Elsevier Ltd. This is an open access article under the CC BY-NC-ND license (http://creativecommons.org/licenses/by-nc-nd/4.0/
).
Journal of Cleaner Production 300 (2021) 126896
2019;Organization, 2017). Against this background, action to make current diets more sustainable is needed, which in turn requires knowledge on possibilities for improvement.
Much recent literature has focused on dietary changes that reduce environmental pressures, and at the same time improve diet quality (Aleksandrowicz et al., 2016;Willett et al., 2019). Dietary changes are mostly assessed in scenario analysis, which range from predefined scenarios to optimised scenarios. Predefined scenarios, on the one hand, can further be divided into consumption-oriented and resource-oriented scenarios (Frehner et al., 2020). Examples for consumption-oriented predefined scenarios are assessments of dietary guidelines (Springmann et al., 2020); examples for resource-oriented predefined scenarios are scenarios that consider the suitability of resources, such as limiting animal-source foods to the extent that can be produced based on low-opportunity cost biomass (Van Zanten et al., 2018). On the other hand, diets in optimised scenarios for example minimise dietary costs or certain environmental impacts (Benvenuti et al., 2019;Ferrari et al., 2020), or the difference to current diets, while fulfilling certain environ- mental goals (Gazan et al., 2018). This form of scenarios can indicate short-term improvements of current diets, which are effective yet straightforward to implement. However, most of these studies do not reflect realistic dietary choices (Hallstr€om et al., 2015). In fact, consumers’ acceptability is substantially limiting the extent to which for example GHG emissions can be reduced through dietary change (Macdiarmid et al., 2012). Further, as dietary choices differ between population (sub)groups (Hallstr€om and B€orjesson, 2013;
Hiza et al., 2013), information on these differences can contribute to target nutritional campaigns for improving multiple sustainability impacts (Snyder, 2007). Moreover, information on typical food choices per population (sub)group can provide important infor- mation on entry points for actions towards more sustainable diets.
As an example, Vassallo et al. (2016)identified psychosocial de- terminants that influence sustainable food choices. Then, Mozaf- farian et al. (2018) mapped the different areas of influence on dietary choices, ranging from sociocultural over governmental until global level. These areas can be targeted most effectively if also the individual layer is taken into account, which consists of multiple sociodemographic and lifestyle factors. Hence, sustainability as- sessments of current diets can, if combined with information about sociodemographic and lifestyle factors, add realism to the discus- sion on sustainable diets, and thereby provide information for potential pathways for improvement.
While certain consequences of human diets, such as on the environment as well as on human health, have been thoroughly investigated, other dimensions of sustainability are less frequently investigated (Meybeck and Gitz, 2017). This differing level of attention can not only be linked to political agendas (e.g. the strong focus on climate change), but also to the degree of standardisation of impact assessments. The assessment of GHG emissions, for example, is highly standardised thanks to large efforts of the Intergovernmental Panel on Climate Change community, thereby facilitating straightforward comparison between assessments.
Other impact categories within the environmental dimension are still assessed in many different ways, such as impacts on biodi- versity. Similarly, impacts within the social dimension of sustain- ability are not yet as standardised as GHG emissions, and are not that commonly assessed. Nevertheless, the social dimension of agricultural production constitutes a highly challenging and rele- vant area. Currently, over 3 billion people live in rural areas (FAO, 2018), of which around 2.5 billion people derive their livelihood from the sector agriculture (FAO, 2013). Including the social dimension in sustainability assessments is therefore key for a profound multidisciplinary understanding of the impacts of our diets. According toHuarachi et al. (2020), social impact assessment
is currently in the phase of the search for standardisation, and is still far from scientific maturity. The currently most commonly used database for such assessments is the Social Hotspots Database (SHDB) (Huarachi et al., 2020).
Hence, we lack an integrated sustainability assessment of different actual diets, that can be linked to information on popu- lation (sub)groups. To this end, we investigated in this study how sociodemographic and lifestyle factors relate to different environ- mental and socio-economic impacts of diets. The relation between sociodemographic and lifestyle factors and impacts is clearly not a direct one, as it is mediated via the food choices and the related impacts. It nevertheless adds an important level to the analysis, since much of the debate on sustainable food consumption relates to differences between socio-demographic groups (Mohr and Schlich, 2016). We conducted an integrated assessment of indi- vidual dietary recall data from Switzerland, including multiple as- pects of environmental and socio-economic sustainability. On the production side, we assessed the environmental indicators global warming potential (GWP), cropland occupation (CLO), and grass- land occupation (GLO), as well as social risks by employing the Social Hotspots Index (SHI), based on the SHDB (Benoit-Norris et al., 2012). On the consumption side, diet quality was assessed by the Alternate Healthy Eating Index (AHEI) (Chiuve et al., 2012;Pestoni et al., 2019), and further, the cost of the diets were assessed. Then, we investigated the associations between population characteris- tics and food choices on the one hand, and between population characteristics and sustainability impacts on the other hand by means of multiple linear regression. Subsequently, we combined these results in a qualitative manner. Thereby, we gain a detailed picture on which sociodemographic groups may significantly differ in impacts and which of their food choices are determinant for this.
In order to study effects within a defined region, we employed Switzerland as a case study. Since dietary recalls are mostly carried out at national level with differing methodologies, comparisons between countries are challenging. With its three language regions, which are influenced by the respective neighbouring countries, Switzerland offers a unique opportunity to study different cultural settings within one harmonised dietary recall dataset (Pestoni et al., 2019).
2. Material and methods
2.1. Dietary recall data and sociodemographic and lifestyle variables
Thefirst, and also most recent, dietary recall in Switzerland (menuCH) was conducted between January 2014 and February 2015 (Chatelan et al., 2017). A total of 2057 participants completed two 24 h dietary recalls, reporting all food items consumed within the last 24 h. Food items were entered as detailed as possible (e.g.
tomatoes) and subsequently grouped to food categories (e.g. veg- etables). In addition to this, sociodemographic information and lifestyle variables were collected, of which the following will be used in this analysis: sex, nationality, age group, highest completed education, civil status, gross household income, smoking status, and being currently on a weight-loss diet. Further, weight and height were measured to derive the Body Mass Index (BMI). The language region was determined depending on the canton of residence.
In combination with a weighting scheme accounting for sex, age, nationality, civil status, household size, major area in Switzerland, weekdays, and seasonality, this sample became representative for inhabitants between the age of 18 and 75 and for their consumption habits over the year for most regions in Switzerland (Pasquier et al., 2017).
A. Frehner, H.H.E.V. Zanten, C. Schader et al. Journal of Cleaner Production 300 (2021) 126896
The consumed amounts of each food product in the dietary recalls had to be transformed in order to be consistent with the reference units of the environmental impact intensities employed (Supplementary Information, Section1.1). In short, we disentangled recipes to ingredients level where required. Then, we converted cooked amounts to raw amounts, thus mainly adjusting the water content of food products. Further, we added factors to account for food waste until the stage of consumption (Beretta et al., 2017), with which we obtained food demand values from food intake values. Finally, food groups used in menuCH were mapped and aggregated to commodity groups used in the impact assessment.
2.2. Environmental and socio-economic impact assessment
For each dietary recall, we assessed multiple environmental and socio-economic impacts. To represent impacts on the environment, we selected the three impact categories global warming potential (GWP), cropland occupation (CLO), and grassland occupation (GLO).
Further, for socio-economic impact categories, we assessed social risks on the production side using the Social Hotspots Index (SHI), and on the consumption side, cost of food consumption as well as the diet quality score Alternate Healthy Eating Index (AHEI).
2.2.1. Environmental impact assessment
We calculated life cycle assessments from cradle-to-farm-gate with the biophysical mass-flow model SOLm (Muller et al., 2017;
Schader et al., 2015), and from farm-gate-to-consumer (covering the stages processing and transport), we employed inventories from Ecoinvent 3 (Supplementary Information, Section2.1). SOLm depicts all mass and nutrientflows in agricultural production that are relevant for the calculation of resource use and emissions. In total, SOLm covers 192 countries, 180 primary crop and 22 primary livestock activities as defined in FAOSTAT, which are further mainly calibrated with FAOSTAT data, such as food balance sheets (FAOSTAT, 2018). For this study, we employed data for Switzerland and its importing countries.
For each crop and livestock activity, inputs and outputs are defined and comprise all processes included in the inventories. For crop activities, the following inputs are included: land area (distinguished whether occupied for crops or grass), mineral and organic fertiliser (manure, crop residues), nitrogenfixation, pesti- cides, management practices, and processing. Outputs comprise crop yields (main and by-products), and residues. GHG emissions of crop production included emissions during production, processing, and transport. For livestock activities, the inputs feed and energy use for housing and fences were included. Covered outputs are products (human-edible; meat, milk, eggs, and human-inedible;
skins, hides, bones, etc.), as well as manure excretion. Thus, GHG emissions of feed production, enteric fermentation, manure man- agement, processing, and transport were covered. Based on these inventories, we assessed GWP, CLO, and GLO per food item.
2.2.2. Social risks
We assessed social risks based on the Social Hotspots Database (SHDB) (Benoit-Norris et al., 2012). The SHDB consists of 156 social indicators per country and per sector of the following areas: labour rights and decent work, health and safety, human rights, gover- nance, and community infrastructure. The agricultural sector is divided into 22 sub-sectors, whereof 18 are directly related to food production. The social indicators were aggregated to the SHI ac- cording to a proposed weighting scheme (Benoit-Norris et al., 2012;
Norris et al., 2014) (Supplementary Information, Section2.2). In- direct social impacts were estimated using an input-output table for Switzerland (Nathani et al., 2011) that contains the interlinkages between multiple industries and between industries and final
demand of an economy. By this, also social impacts of sectors that provide inputs into agricultural sectors, such as pesticide produc- tion, could be captured. A higher score in SHI indicates a higher social risk in production and along the value chain.
2.2.3. Cost of food consumption
We collected price data of 94 commodities at one day (Sup- plementary Information, Section 2.3). Then, by multiplying food demand values with prices, we estimated total cost of food demand per dietary recall.
2.2.4. Diet quality
Impacts on human health of food consumption differ from in- dividual to individual, depending on a combination of factors, such as the prevailing gut microbiota (Clemente et al., 2012). Never- theless, indices can give helpful insights into correlations of certain food groups with improved or decreased health performance. We employed the AHEI (Chiuve et al., 2012;Pestoni et al., 2019), a diet quality score which correlates well with coronary heart disease, diabetes, and risk of stroke and cancer (Schwingshackl et al., 2018;
Waijers et al., 2007). The AHEI is derived from the consumed amounts of 11 food categories, where various intake thresholds define the amount of points that are allocated to the observed in- dividual consumption levels, leading to a maximum achievable score of 110 points. A higher AHEI indicates a higher diet quality.
To sum up, we calculated environmental and socio-economic impacts by consumed food group by person as well as for the whole diet per person. We assessed diet quality for each person for the whole diet only (not per food group), since this impact category depends on the composition of a person’s diet. Then, we dicho- tomised impact intensities (above and below median; strong and weak) for each impact category and food group, to classify the strength per food group and impact category. Since the AHEI is calculated at diet level, additional steps were required to define strong and weak contribution of single food groups to the AHEI (Supplementary Information, Section2.4).
2.3. Statistical analysis and integration
2.3.1. Sociodemographic and lifestyle factors and food choices In afirst step, we used multiple linear regression to identify typical food choices for different sociodemographic and lifestyle factors, with both the food choices (g consumed per food group) and the sociodemographic and lifestyle factors coming from the menuCH dataset (Section2.1). Individual regressions werefitted per food group, with consumption per food group as dependent variables, and the sociodemographic variables and lifestyle factors as explanatory variables (Supplementary Information, Section3). In addition, food energy intake was included as adjusting factor in each model, to correct for different levels of absolute food energy intake in the dietary recalls. The dietary recall data was weighted according to the weighting scheme described in Section2.1. Only results of the regression analysis that met our criteria for signifi- cance (p-value0.05) were used for the subsequent analysis.
2.3.2. Sociodemographic and lifestyle factors and impacts
In a second step, as for the food groups, we used multiple linear regression to investigate associations between sociodemographic and lifestyle factors and environmental and socio-economic im- pacts. While the sociodemographic and lifestyle factors were taken from the menuCH dataset, the environmental and socio-economic impacts were based on own calculations with indicated impact assessment methods (Section 2.2). For each impact category, an individual regression wasfitted, including food energy intake to correct for different levels of food energy intakes of the diets.
A. Frehner, H.H.E.V. Zanten, C. Schader et al. Journal of Cleaner Production 300 (2021) 126896
3
Dietary recalls were weighted according to the described weighting scheme in Section 2.1. Further, SHI was log transformed, which improved model-fitting performance. Also here, results were pro- cessed further for defined levels of significance only (p- value0.05).
2.3.3. Integrating sociodemographic and lifestyle factors, food choices, and impacts
In a third step, we combined results of the regression analyses for food choices and impacts (Sections2.3.1 and 2.3.2) to obtain a full picture of how food choices link sociodemographic and lifestyle factors with impact levels. To start with, we extracted sociodemo- graphic and lifestyle factors that showed statistically significant results (p-value0.05) for each impact category. Then, we took the direction of the association (positive and negative) between the extracted sociodemographic and lifestyle factors and the food groups, and combined it with the information on the dichotomised impact intensities, i.e. the strength per food group and impact category (strong and weak). By this, we identified relevant food choices among sociodemographic and lifestyle groups and their influence on the different impact categories.
3. Results and discussion
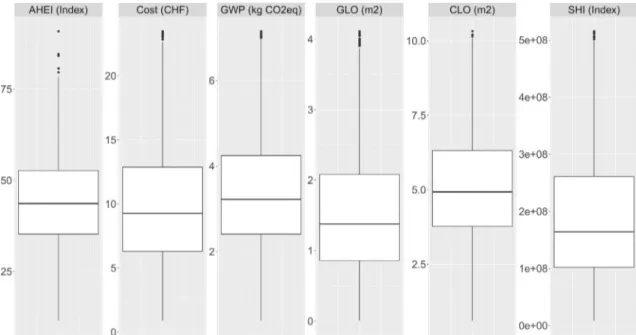
3.1. Environmental and socio-economic impacts of food groups Fig. 1presents the mean impacts for AHEI, cost, GWP, CLO, GLO, and SHI of the weighted dietary recalls from the menuCH dataset.
The scores refer to the sum of all foods consumed by an individual in the 24 h of the recalls. The median of the AHEI was 43.65 points, the median of cost amounted to 9.27 CHF, while the medians of the environmental indicators were 3.25 kg CO2eq for GWP, 4.92 m2for CLO, and 1.43 m2for GLO. Further, the median score for the SHI was 1.64 eþ08 points.
Results of the dichotomised impact intensities per food group are presented inFig. 2. We see that for the AHEI, mainly the food groupsfish and seafood, cereals (whole grains), pulses, vegetables, nuts and seeds, and fruits contributed to an increase of the score (higher score refers to higher diet quality). For cost, on the contrary, animal-source foods (ASF), and especially the different types of meat, contributed strongly to an increase, as well asfish and sea- food, vegetables, fruits, and alcoholic beverages. For GWP, mainly the ASF categories revealed above median impact intensities, accompanied by oils and fats. Impact intensities of GWP and CLO were fairly well aligned, with the exception of milk products, pul- ses, and nuts and seeds. Only ruminants were fed with grass re- sources and thus occupied land for grass, and therefore, GLO was only relevant for cattle meat and milk products. Finally, results for the SHI revealed a different picture, with, next to eggs andfish and seafood, mainly plant-source food (PSF) contributing to an increased score (a higher score refers to higher social risks along the value chain).
For the subsequent analysis, we employed results of the sus- tainability impact assessment on diets level and information on the dichotomised impact intensities. Although the different nutritional functions of each food itemebe it dairy as a source for calcium, or carrots as a source of vitamin A ewere thus not captured, this simplification is less relevant when the strength of the impact in- tensity per food group is considered in a dichotomised way only.
Supporting this decision,Van Kernebeek et al. (2014)found only small differences when relating GWP to a nutritional quality score instead of day or kg of product, and no difference for LO.
3.2. Results on statistical analysis and integration
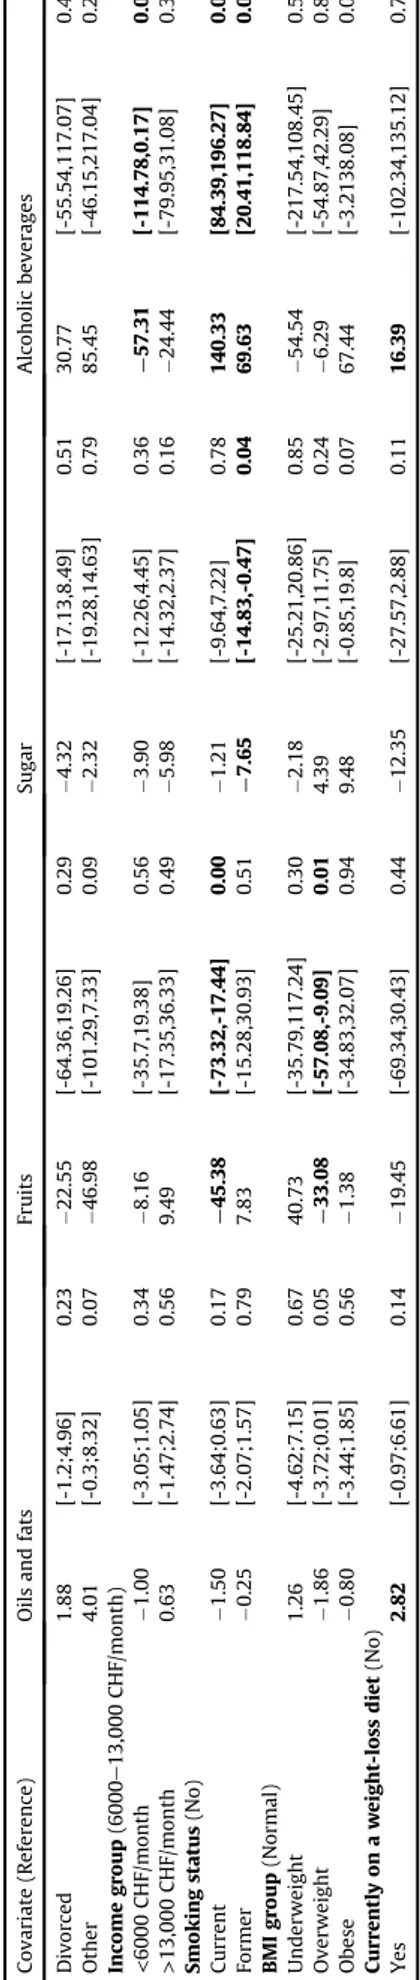
3.2.1. Sociodemographic and lifestyle factors and food choices Regression analysis revealed several relevant sociodemographic and lifestyle drivers of food choices (Tables 1 and 2). For the con- sumption of different types of meat, all drivers except income group and being currently on a diet showed significant results for at least one meat type. Further, consumption of milk products, eggs, andfish and seafood showed significant results for the drivers sex, nationality, language region, age group, civil status, as well as smoking.
While cattle meat and chicken consumption was higher among male participants (þ16.5 g andþ23.0 g), milk consumption was higher among female participants. Notably, participants originating from non-European countries had a higher meat intake (cattle meat or pork), while participants from the European region had higher egg intake (þ7.4 g) and lower milk intake (47.2 g), compared to the Swiss reference group. Interestingly, a similar pattern could be observed for Swiss language regions other than the German- speaking reference group: the French-speaking region showed higher consumption of cattle meat (þ17.0 g) and chicken (þ22.9 g), and lower consumption of milk (65.9 g)ethe latter result also holds for participants from the Italian-speaking region (56.9 g).
Between age groups, only consumption of chicken and eggs varied;
with both being consumed more by participants younger than the reference age group, and chicken being consumed less by older participants. Finally, while cattle meat consumption was lower among participants with tertiary education (13.2 g), being mar- ried or a current smoker revealed an opposite association (þ21.0 g andþ15.9 g).
For the food groups cereals and potatoes, the drivers sex, na- tionality, civil status, income group, BMI group, and being currently on a diet revealed significant results (Table 2). Moreover, the con- sumption of pulses, vegetables, and nuts and seeds revealed sig- nificant results for all drivers except smoking status. For the two food groups fruits and sugar, all drivers except civil status, income group, and being currently on a diet showed significant results.
Finally, the consumption of alcoholic beverages was significantly associated with the explanatory variables sex, nationality, age group, and smoking status.
While starchy food groups such as cereals and potatoes showed a positive association with being male (þ15.4 g and þ23.9 g), consumption of fruits was lower among male participants compared to females (32.5 g). Remarkable was also the difference in the consumption of alcoholic beverages, which was 146.3 g higher among male participants. Further, it was interesting to note the differences between language regions: while the participants from the French-speaking language region showed higher pulses (þ9.8 g) and vegetables (þ11.7 g) consumption and those of the Italian-speaking language region higher oils and fats consumption (þ8.8 g), both of these language regions had a lower sugar con- sumption (12.2 g and 17.1 g), as compared to the German- speaking language region. A similar pattern could be observed for participants older than the reference and those that completed tertiary education. Notably, participants with lower income than the reference groups revealed a negative association with the consumption of vegetables (18.4 g), nuts and seeds (8.3 g), and alcoholic beverages (57.3 g). Then, while fruits consumption was lower among current smokers (45.4 g), consumption of alcoholic beverages was substantially higher both among current (þ140.3 g) and former (þ69.6 g) smokers, as compared to non-smokers.
3.2.2. Sociodemographic and lifestyle factors and impacts
The link between sociodemographic and lifestyle factors and impacts is clearly not a direct one, but is mediated by food choices
A. Frehner, H.H.E.V. Zanten, C. Schader et al. Journal of Cleaner Production 300 (2021) 126896
and the related impacts per food groups. We also assessed this indirect linkage, to then better understand which sociodemo- graphic and lifestyle aspects correlated with significant differences in impacts and which food choices are behind these patterns. We thus investigated sociodemographic and lifestyle variables for their associations with different impact categories that we calculated per dietary recall, and then combined the different analyses of this and the previous section in Section3.2.3. Here, wefirst present results for the three environmental indicators GWP, CLO, and GLO, fol- lowed by the socio-economic indicators on social risks (SHI), diet quality (AHEI), and dietary cost. These indicators can be interpreted as follows: for GWP and LO, a higher value means higher emissions and higher land occupation respectively. For SHI, higher values
indicate higher social risks along the food production chain, and for the AHEI, higher scores mean higher diet quality. Finally, from a consumer perspective, lower dietary cost are generally preferred.
For GWP, the variables nationality, language region, age group, civil status, income group, smoking status, and being currently on a diet showed significant results, while for CLO, sex, nationality, language region, age group, and being currently on a diet showed significant results (Table 3). For CLO, the variables nationality, language region, civil status, income group, smoking status, BMI group, and being currently on a diet showed significant results.
While GWP was higher for participants from the African/Eastern Mediterranean region, French-speaking language region, older than the reference, married, with a lower income than the Fig. 1.Weighted boxplots of the impacts of the foods consumed by an individual in the 24 h of the recall. AHEI¼Alternate Healthy Eating Index, GWP¼global warming potential, GLO¼grassland occupation, CLO¼cropland occupation, SHI¼Social Hotspots Index.
Fig. 2.Dichotomised impact intensities per food group (above median: strong, below median: weak). AHEI¼Alternate Healthy Eating Index, GWP¼global warming potential, GLO¼grassland occupation, CLO¼cropland occupation, SHI¼Social Hotspots Index.
A. Frehner, H.H.E.V. Zanten, C. Schader et al. Journal of Cleaner Production 300 (2021) 126896
5
Table 1
Association between sociodemographic and lifestyle factors and animal-source food groups. Coefficient estimate; [95% CI]; p-value; bold: results with a p-value below or equal to 0.05 (n¼2057).
Covariate (Reference) Cattle meat Pork Chicken Milk products Eggs Fish and seafood
Sex (Female)
Male 16.52 [4.17;28.88] 0.01 3.03 [-18.04,11.98] 0.69 22.95 [7.94,37.95] 0.00 ¡29.68 [-49.2,-10.16] 0.00 1.39 [-2.69,5.48] 0.50 4.60 [-7.13,16.34] 0.44 Nationality(Swiss)
European 2.89 [-10.11,15.88] 0.66 6.64 [-9.33,22.61] 0.41 0.76 [-16.23,14.72] 0.92 ¡47.21 [-68.55,-25.87] 0.00 7.38 [2.9,11.86] 0.00 19.03 [7.3,30.76] 0.00 Region of the Americas 30.56 [-91.17,30.05] 0.32 115.46 [2.43,228.48] 0.05 9.37 [-35.89,54.63] 0.68 20.26 [-122.33,81.82] 0.70 16.15 [-39.93,7.62] 0.18 9.19 [-65.74,47.37] 0.75 African/Eastern Mediterranean 52.83 [6.65,99] 0.03 13.54 [-94.06,66.98] 0.74 5.69 [-53.14,64.52] 0.85 70.43 [-162.96,22.09] 0.14 8.58 [-28.01,10.85] 0.39 23.45 [-85.98,39.07] 0.46 Western Pacific/South-East Asia 47.05 [18.48,75.63] 0.00 27.94 [-1.62,57.51] 0.06 22.16 [-38.46,82.78] 0.47 9.74 [-22.04,2.57] 0.12 21.38 [-45.22,2.46] 0.08 Language region(German-speaking)
French-speaking 17.03 [5.41,28.64] 0.00 12.91 [-28.15,2.33] 0.10 22.85 [8.44,37.25] 0.00 ¡65.92 [-85.98,-45.86] 0.00 3.23 [-0.99,7.45] 0.13 4.99 [-5.89,15.87] 0.37 Italian-speaking 13.10 [-8.6,34.8] 0.24 1.12 [-34.11,36.35] 0.95 14.96 [-13.98,43.89] 0.31 ¡56.92 [-97.3,-16.55] 0.01 4.88 [-13.31,3.54] 0.26 7.97 [-12.46,28.41] 0.44 Age group(30e44 years)
18e29 years 9.86 [-11.23,30.95] 0.36 13.16 [-40.26,13.95] 0.34 26.04 [3.56,48.52] 0.02 1.51 [-32.3,29.27] 0.92 7.27 [0.78,13.76] 0.03 4.52 [-14.71,23.75] 0.65 45e59 years 5.74 [-19.22,7.75] 0.40 7.79 [-24,8.42] 0.34 ¡19.31 [-36.13,-2.48] 0.03 11.10 [-34.22,12.01] 0.35 3.10 [-1.74,7.93] 0.21 2.02 [-10.93,14.97] 0.76 60e75 years 0.73 [-16.5,17.95] 0.93 0.37 [-19.98,20.72] 0.97 ¡23.95 [-45.89,-2] 0.03 0.57 [-28.07,29.2] 0.97 2.97 [-3,8.95] 0.33 13.81 [-3.1,30.72] 0.11 Education; highest degree(Secondary)
Primary 5.34 [-33.83,44.51] 0.79 2.94 [-30.26,36.14] 0.86 4.43 [-40.48,31.62] 0.81 1.19 [-50.06,52.44] 0.96 2.58 [-8.31,13.47] 0.64 7.10 [-21.3,35.49] 0.62 Tertiary ¡13.20 [-23.89,-2.52] 0.02 2.58 [-15.96,10.79] 0.70 9.46 [-22.97,4.05] 0.17 9.14 [-9.21,27.49] 0.33 1.75 [-5.62,2.13] 0.38 4.86 [-15.62,5.89] 0.38 Civil status(Single)
Married 21.01 [2.97,39.04] 0.02 2.46 [-19.14,24.06] 0.82 0.55 [-21.25,20.14] 0.96 30.74 [1.63,59.86] 0.04 2.96 [-3.15,9.06] 0.34 2.72 [-14.84,20.27] 0.76 Divorced 3.07 [-27.23,21.09] 0.80 0.20 [-27.15,27.56] 0.99 23.84 [-0.85,48.53] 0.06 16.23 [-18.27,50.74] 0.36 5.32 [-12.62,1.97] 0.15 1.08 [-19.07,21.24] 0.92
Other 0.19 [-57.1,56.72] 1.00 9.39 [-33.2,51.98] 0.66 8.27 [-23.56,40.1] 0.61 31.98 [-78.34,14.38] 0.18 0.22 [-9.7,10.15] 0.97 7.36 [-32.13,17.42] 0.56
Income group(6000e13,000 CHF/month)
<6000 CHF/month 7.21 [-8.02,22.43] 0.35 10.28 [-7.62,28.18] 0.26 16.45 [-34.11,1.21] 0.07 16.72 [-5.76,39.21] 0.15 0.25 [-4.48,4.98] 0.92 11.50 [-25.48,2.48] 0.11
>13,000 CHF/month 6.18 [-6.87,19.23] 0.35 0.84 [-17.3,18.97] 0.93 12.76 [-3.26,28.78] 0.12 7.80 [-14.67,30.27] 0.50 1.24 [-5.98,3.5] 0.61 1.75 [-10.67,14.17] 0.78
Smoking status(No)
Current 15.85 [2.45,29.25] 0.02 5.76 [-11.4,22.92] 0.51 ¡17.03 [-33.55,-0.51] 0.04 19.18 [-41.86,3.49] 0.10 1.29 [-6.05,3.48] 0.60 4.76 [-18.14,8.63] 0.49
Former 0.50 [-12.01,13] 0.94 14.16 [-29.28,0.96] 0.07 2.44 [-16.96,12.08] 0.74 ¡24.88 [-44.2,-5.57] 0.01 1.89 [-2.15,5.94] 0.36 7.19 [-18.55,4.18] 0.21
BMI group(Normal)
Underweight 19.57 [-38.54,77.67] 0.51 ¡54.87 [-109.24,-0.5] 0.05 7.26 [-57.67,43.15] 0.78 11.42 [-73.52,50.68] 0.72 2.99 [-16.51,10.53] 0.66 9.13 [-28.75,47.02] 0.64 Overweight 5.13 [-6.49,16.75] 0.39 2.16 [-16.47,12.16] 0.77 2.85 [-11.21,16.91] 0.69 3.88 [-15.89,23.66] 0.70 2.99 [-1.17,7.14] 0.16 2.80 [-14.23,8.62] 0.63 Obese 2.63 [-19.06,13.81] 0.75 6.64 [-26.03,12.75] 0.50 4.58 [-17.49,26.66] 0.68 11.59 [-39.18,16.01] 0.41 1.42 [-7.23,4.4] 0.63 5.17 [-12.1,22.44] 0.56 Currently on a weight-loss diet(No)
Yes 8.04 [-13.72,29.8] 0.47 2.62 [-32.29,37.54] 0.88 16.11 [-9.15,41.36] 0.21 22.12 [-18.66,62.9] 0.29 3.08 [-5.9,12.07] 0.50 8.15 [-27.5,11.2] 0.41
A.Frehner,H.H.E.V.Zanten,C.Schaderetal.JournalofCleanerProduction300(2021)126896
6
Table 2
Association between sociodemographic and lifestyle factors and plant-source food groups. Coefficient estimate; [95% CI]; p-value; bold: results with a p-value below or equal to 0.05 (n¼2057).
Covariate (Reference) Cereals Potatoes Pulses Vegetables Nuts and seeds
Sex (Female)
Male 15.36 [5.47,25.26] 0.00 23.93 [11.58,36.28] 0.00 8.66 [1.65,15.67] 0.02 2.34 [-12.26,7.58] 0.64 0.87 [-3.84,5.58] 0.72
Nationality(Swiss)
European 7.75 [-18.54,3.04] 0.16 8.57 [-5.33,22.47] 0.23 2.75 [-10.03,4.53] 0.46 1.97 [-12.8,8.86] 0.72 4.60 [-1.16,10.36] 0.12
Region of the Americas 1.49 [-53.29,50.31] 0.96 48.71 [-9.69,107.11] 0.10 30.03 [-77.53,17.47] 0.21 26.59 [-33.51,86.68] 0.39 5.68 [-11.22,22.57] 0.51
African/Eastern Mediterranean 5.50 [-52.47,41.46] 0.82 79.16 [9.16,149.17] 0.03 17.62 [-13.38,48.62] 0.26 7.56 [-52.5,37.39] 0.74 6.92 [-21.19,35.03] 0.63 Western Pacific/South-East Asia 17.20 [-47.97,13.57] 0.27 19.54 [-20.41,59.5] 0.34 6.69 [-19.55,6.17] 0.31 75.50 [46.11,104.88] 0.00 4.39 [-16.03,24.81] 0.67 Language region(German-speaking)
French-speaking 7.97 [-2.21,18.14] 0.13 5.31 [-18.19,7.56] 0.42 9.81 [2.83,16.8] 0.01 11.66 [1.43,21.9] 0.03 2.55 [-2.49,7.59] 0.32
Italian-speaking 10.03 [-10.26,30.33] 0.33 9.95 [-34.24,14.33] 0.42 15.42 [-1.36,32.2] 0.07 12.03 [-32.64,8.58] 0.25 3.59 [-14.84,7.67] 0.53
Age group(30e44 years)
18e29 years 13.16 [-2.42,28.74] 0.10 13.74 [-6.11,33.6] 0.18 3.15 [-13.49,7.2] 0.55 6.53 [-9.31,22.37] 0.42 0.64 [-8.19,6.9] 0.87
45e59 years 9.62 [-21.29,2.06] 0.11 3.89 [-10.64,18.42] 0.60 1.80 [-9.77,6.17] 0.66 1.36 [-12.89,10.16] 0.82 1.50 [-4.32,7.32] 0.61
60e75 years 13.01 [-27.51,1.5] 0.08 6.58 [-11.09,24.25] 0.47 0.96 [-8.55,10.48] 0.84 15.38 [1.11,29.65] 0.04 1.63 [-8.78,5.51] 0.65
Education; highest degree(Secondary)
Primary 6.93 [-32.93,19.08] 0.60 26.08 [-9.81,61.97] 0.15 11.54 [-28.87,5.79] 0.19 22.73 [-2.9,48.36] 0.08 1.62 [-12.27,15.51] 0.82
Tertiary 4.23 [-5.06,13.53] 0.37 3.27 [-14.73,8.2] 0.58 5.92 [-12.28,0.44] 0.07 16.72 [7.44,25.99] 0.00 0.72 [-5.43,4] 0.76
Civil status(Single)
Married 2.09 [-12.6,16.78] 0.78 5.04 [-22.72,12.63] 0.58 5.37 [-14.55,3.81] 0.25 0.68 [-13.63,14.99] 0.93 1.09 [-5.92,8.11] 0.76
Divorced 6.23 [-23.71,11.26] 0.49 ¡26.97 [-48.41,-5.54] 0.01 5.79 [-5.02,16.6] 0.29 12.30 [-5,29.61] 0.16 0.87 [-7.67,9.41] 0.84
Other 2.94 [-20.25,26.13] 0.80 22.76 [-6.67,52.18] 0.13 3.48 [-15.29,22.25] 0.72 1.60 [-21.25,24.46] 0.89 16.35 [5.48,27.22] 0.00
Income group(6000e13,000 CHF/month)
<6000 CHF/month 3.69 [-7.71,15.1] 0.53 14.86 [0.31,29.4] 0.05 2.18 [-5.64,10] 0.58 ¡18.37 [-29.78,-6.96] 0.00 ¡8.31 [-13.94,-2.69] 0.00
>13,000 CHF/month 6.45 [-17.8,4.89] 0.27 5.94 [-20.18,8.29] 0.41 0.87 [-6.79,8.54] 0.82 0.72 [-10.42,11.86] 0.90 1.08 [-6.55,4.39] 0.70
Smoking status(No)
Current 2.83 [-14.29,8.63] 0.63 4.03 [-10.33,18.38] 0.58 1.88 [-6.02,9.78] 0.64 4.01 [-7.37,15.38] 0.49 0.75 [-6.83,5.33] 0.81
Former 4.72 [-14.5,5.06] 0.34 1.50 [-13.68,10.69] 0.81 0.46 [-7.15,6.23] 0.89 3.43 [-13.17,6.31] 0.49 4.23 [-8.68,0.23] 0.06
BMI group(Normal)
Underweight 15.95 [-15.57,47.47] 0.32 8.39 [-38.72,55.5] 0.73 4.49 [-14.14,23.11] 0.64 14.37 [-17.98,46.73] 0.38 29.39 [16.62,42.17] 0.00
Overweight ¡11.35 [-21.37,-1.34] 0.03 1.53 [-10.89,13.94] 0.81 1.81 [-5.22,8.85] 0.61 ¡10.41 [-20.31,-0.51] 0.04 0.59 [-4.29,5.47] 0.81
Obese 13.48 [-27.5,0.55] 0.06 16.10 [-1.65,33.86] 0.08 0.55 [-9.47,10.58] 0.91 4.50 [-9.49,18.5] 0.53 1.44 [-6.83,9.7] 0.73
Currently on a weight-loss diet(No)
Yes ¡24.35 [-45.09,-3.61] 0.02 9.29 [-39.02,20.44] 0.54 3.98 [-9.81,17.77] 0.57 29.30 [9.08,49.51] 0.01 1.69 [-7.66,11.04] 0.72
Covariate (Reference) Oils and fats Fruits Sugar Alcoholic beverages
Sex (Female)
Male 0.99 [-0.84;2.83] 0.29 ¡32.52 [-56.26,-8.77] 0.01 4.58 [-11.85,2.69] 0.22 146.25 [97.45,195.05] 0.00
Nationality(Swiss)
European 3.06 [1.07;5.05] 0.00 24.03 [-2.05,50.11] 0.07 7.32 [-15.26,0.63] 0.07 83.13 [28.74,137.52] 0.00
Region of the Americas
6.37 [-3.48;16.22] 0.20 26.63 [-92.44,145.71] 0.66 13.64 [-24.23,51.51] 0.48 19.27 [-447.01,408.46] 0.93
African/Eastern Mediterranean 0.97 [-7.18;9.12] 0.82 26.27 [-95.77,148.31] 0.67 7.86 [-26.47,42.19] 0.65 193.87 [-486.34,98.6] 0.19
Western Pacific/South-East Asia 2.45 [-7.92;3.01] 0.38 4.57 [-69.61,78.75] 0.90 52.14 [29.65,74.63] 0.00 159.13 [-27.73,346] 0.10
Language region(German-speaking)
French-speaking 0.09 [-1.78;1.95] 0.93 6.64 [-30.65,17.37] 0.59 ¡12.23 [-19.68,-4.77] 0.00 15.00 [-35.5,65.5] 0.56
Italian-speaking 8.78 [5.15;12.42] 0.00 5.61 [-44.77,55.98] 0.83 ¡17.14 [-32.26,-2.01] 0.03 55.50 [-155.56,44.57] 0.28
Age group(30e44 years)
18e29 years 0.61 [-2.08;3.3] 0.66 16.35 [-53.49,20.78] 0.39 8.84 [-20.3,2.63] 0.13 120.02 [35.73,204.31] 0.01
45e59 years 0.27 [-2.41;1.87] 0.80 54.77 [26.67,82.86] 0.00 ¡14.55 [-23.12,-5.98] 0.00 27.14 [-30.27,84.56] 0.35
60e75 years 2.36 [-0.04;4.77] 0.06 72.60 [38.35,106.84] 0.00 ¡22.64 [-33.27,-12] 0.00 31.35 [-102.5,39.8] 0.39
Education; highest degree(Secondary)
Primary 3.17 [-1.73;8.07] 0.20 3.24 [-66.46,59.97] 0.92 2.83 [-16.23,21.9] 0.77 54.63 [-98.56,207.83] 0.48
Tertiary 0.77 [-2.48;0.95] 0.38 26.81 [4.67,48.95] 0.02 ¡9.53 [-16.39,-2.67] 0.01 43.41 [-89.9,3.09] 0.07
Civil status(Single)
Married 1.77 [-3.99;0.45] 0.12 17.70 [-53.21,17.81] 0.33 8.85 [-19.63,1.94] 0.11 24.71 [-97.45,48.03] 0.51
(continued on next page)
A.Frehner,H.H.E.V.Zanten,C.Schaderetal.JournalofCleanerProduction300(2021)126896
7
reference, current smoker, and currently on a weight-loss diet, CLO was further positively associated with being male. Moreover, for GLO, participants from the European region and from the French- speaking language region showed a negative association, and be- ing married, having an income above 13,000 CHF/month, being overweight, and being currently on a weight-loss diet showed a positive association.
For the indicator SHI, the variables language region, age group, and BMI group revealed significant results, while for AHEI, all var- iables except civil status, and income were significant. For dietary cost, all variables except education, civil status, income group, and BMI group showed significant results (seeTable 3). Notably, being male was negatively associated with the AHEI (1.3 points) and positively with cost (þ1.4 CHF). Further, participants from the Eu- ropean region (þ1.6 points) and from the Western Pacific and South-East Asia region (þ8.4 points) revealed a higher AHEI, but also higher cost (þ1.7 CHF andþ5.1 CHF). The SHI of participants from the Italian-speaking region was lower compared to the German-speaking region (0.2 points), while their AHEI was higher (þ2.7 points). Aligned with this latter result, AHEI was also higher for participants from the French-speaking region (þ1.7 points), as were cost (þ1.5 CHF). Differences between age groups were remarkable for these three indicator categories. While being younger than the reference group was associated with lower social risks (0.3 points), being older than the reference group was on the one hand associated with higher social risks (45e59 years: þ0.1 points, 60e75 years:þ0.2 points) and higher cost (þ1.6 CHF), but on the other hand, also with a higher diet quality (45e59 years:þ3.6 points, 60e75 years:þ6.4 points). In contrast to this, smoking was negatively associated with diet quality (3.1 points), as was being overweight or obese (3.0 points and5.0 points).
3.2.3. Integrating sociodemographic and lifestyle factors, food choices, and impacts
In this section, we combine the patterns observed between sociodemographic and lifestyle characteristics, food groups, and impacts into an encompassing picture. We start with a reading guidance forFig. 3and then present the results.
Fig. 3 can be interpreted as follows: for GWP, eight socio- demographic and lifestyle factors showed significant results (see Table 3), and were therefore included in the subsequent integrated analysis (see rows inFig. 3). InFig. 3, the coefficient estimate for GWP for these levels of variables is given in the third column (e.g.
French-speaking language region was positively associated with GWP (þ0.12 kg CO2eq)), followed by information on the direction of association between the respective variable and food groups (e.g.
French-speaking language region was positively associated with cattle meat, chicken, pulses, and vegetables, and negatively asso- ciated with milk products and sugar, other sweeteners). Where the directions of the impact and of the food group were aligned, the squares are marked with an x. We thus see that the French- speaking language region was positively associated both with GWP and with cattle meat, chicken, pulses, and vegetables. More- over, the strength of the indicator (e.g. whether GWP of cattle meat was above or below the median of GWP, cf.Fig. 2) is indicated with strong and weak (see colour legend ofFig. 3). In summary, the in- crease in GWP of participants from the French-speaking language region was aligned with an increased consumption of cattle meat, chicken, pulses, and vegetables, where cattle meat and chicken showed higher impact intensities for GWP.
Further results for GWP showed that for married participants, consumption of cattle meat and milk products can serve as expla- nation for the higher GWP. Increased CLO was significantly asso- ciated with six levels of variables (Fig. 3). For male participants, cattle meat and chicken as well as pulses showed increased Table2(continued) Covariate(Reference)OilsandfatsFruitsSugarAlcoholicbeverages Divorced1.88[-1.2;4.96]0.2322.55[-64.36,19.26]0.294.32[-17.13,8.49]0.5130.77[-55.54,117.07]0.48 Other4.01[-0.3;8.32]0.0746.98[-101.29,7.33]0.092.32[-19.28,14.63]0.7985.45[-46.15,217.04]0.20 Incomegroup(6000e13,000CHF/month) <6000CHF/month1.00[-3.05;1.05]0.348.16[-35.7,19.38]0.563.90[-12.26,4.45]0.36¡57.31[-114.78,0.17]0.05 >13,000CHF/month0.63[-1.47;2.74]0.569.49[-17.35,36.33]0.495.98[-14.32,2.37]0.1624.44[-79.95,31.08]0.39 Smokingstatus(No) Current1.50[-3.64;0.63]0.17¡45.38[-73.32,-17.44]0.001.21[-9.64,7.22]0.78140.33[84.39,196.27]0.00 Former0.25[-2.07;1.57]0.797.83[-15.28,30.93]0.51¡7.65[-14.83,-0.47]0.0469.63[20.41,118.84]0.01 BMIgroup(Normal) Underweight1.26[-4.62;7.15]0.6740.73[-35.79,117.24]0.302.18[-25.21,20.86]0.8554.54[-217.54,108.45]0.51 Overweight1.86[-3.72;0.01]0.05¡33.08[-57.08,-9.09]0.014.39[-2.97,11.75]0.246.29[-54.87,42.29]0.80 Obese0.80[-3.44;1.85]0.561.38[-34.83,32.07]0.949.48[-0.85,19.8]0.0767.44[-3.2138.08]0.06 Currentlyonaweight-lossdiet(No) Yes2.82[-0.97;6.61]0.1419.45[-69.34,30.43]0.4412.35[-27.57,2.88]0.1116.39[-102.34,135.12]0.79
A. Frehner, H.H.E.V. Zanten, C. Schader et al. Journal of Cleaner Production 300 (2021) 126896
consumption levels and above median impact intensities. The same pattern applied for participants from the French-speaking language region. Higher consumption of cattle meat was furthermore likely to drive increased CLO levels of participants originating from the African/Eastern Mediterranean region. The two age groups above the reference group and the group of people being currently on a weight-loss diet showed higher CLO values, but no increase in food groups that have an above median impact intensity. There, increased consumption of fruits and vegetables (both with below median impact intensities) could contribute to increased CLO levels. Moreover, as grass resources are only fed to ruminants, only the two food groups cattle meat and milk products were relevant for this impact category. Reduced milk consumption was found in combination with lower GLO for European and French-speaking participants, as well as former smokers. On the contrary, being married was positively associated with cattle meat consumption, and also came along with a higher GLO.
For the SHI,five levels of variables showed significant results (Fig. 3). Notably, participants from the Italian-speaking language region performed better on the SHI score, and at the same time revealed a lower intake of sugar and other sweeteners as well as milk products. Further, also younger participants revealed a lower SHI score, and older participants a higher. The latter result coin- cided with an increased consumption of vegetables and fruits, while the reduced consumption of sugar pointed into the other direction. Then, also overweight participants showed a lower SHI, which came along with a lower fruits and vegetables consumption.
For male participants, the lower score of the AHEI compared to female was aligned with a lower consumption of fruits and milk products (Fig. 3). Further, the higher AHEI score for the European region compared to Swiss individuals was aligned with higherfish and seafood and eggs consumption, and for Western Pacific/South- East Asia region with higher vegetables, cattle meat, and sugar consumption. Both language regions French-speaking and Italian- speaking had a higher AHEI than the German-speaking reference, which coincided with an increased pulses and vegetables con- sumption (for the French-speaking language region) and a lower sugar consumption. The higher AHEI score of participants older than the reference group coincided with a higher fruits and vege- tables consumption, which was also found for people with tertiary education. Further, the lower AHEI for current smokers was asso- ciated with lower fruits consumption, and the lower AHEI of overweight participants was associated with a lower consumption of cereals (whole grain), vegetables, and fruits. Finally, the higher AHEI score of people currently on a weight-loss diet also came with a higher vegetables consumption.
Cost of consumed foods were higher among male participants, coinciding with an increased consumption (and above median impact intensity) of cattle meat, chicken, and alcoholic beverages.
Higher cost could also be observed among non-Swiss nationalities, coinciding with a higher intake offish and seafood and alcoholic beverages (European region), and cattle meat and vegetables (Western Pacific/South-East Asia region) (Fig. 3). Also for partici- pants from the French-speaking language region, cattle meat and chicken as well as vegetables consumption, and pulses with below median impact intensity, were found in combination with increased cost. Further, for participants older than the reference group, fruits and vegetables coincided with increased cost, while for current and former smokers, cattle meat and alcoholic bever- ages were found in combination with higher cost. Finally, higher vegetables consumption coincided with higher cost for people being currently on a weight-loss diet.
Interestingly, the reduced consumption of the food group sugar and other sweeteners revealed synergies only, due to the fact that its consumption does not contribute to a positive effect of any
impact category. Moreover, lower sugar consumptioneas could for example be identified for participants from the French-speaking and Italian-speaking language region, older than the reference, and with tertiary educationecould have contributed to weaken the negative impacts e.g. in form of higher GWP than the respective reference. Further, pork was an interesting case, as its consumption evidently did not differ between any sociodemographic and life- style factor that showed significant results for an impact category.
However, since pork contributes with above median impact in- tensity to multiple impact categories (GWP, LO, and cost), and moreover does not contribute to an increase of the AHEI, we can still conclude that reduced consumption thereof is desirable.
In fact, we note that levels of sociodemographic and lifestyle factors that did not reveal significant results for the sustainability impacts calculated can still improve their performance by reducing the consumption of those food groups with above median impact intensities in particular. As an example, male participants do not reveal significant differences in GWP compared to females. This came along with reduced consumption of milk products and fruits, which could offset the effect of increased consumption of cattle meat, chicken, cereals, potatoes, pulses, and alcoholic beverages (Tables 1 and 2). Thus, although no difference could be observed between the two levels of the variable sex, adverse impacts could be mitigated by reducing the consumption of the named food groups. Notably, the same logic applies to all respective reference groups per impact category.
3.3. Sustainability impacts, food choices, and population characteristics
An increasing body of literature has combined diet quality with environmental, and partly economic, impacts in integrated as- sessments of different dietse either in scenario analyses (Chen et al., 2019; Tilman and Clark, 2014), or by assessing dietary re- calls (Mertens et al., 2019;Walker et al., 2018).Mertens et al. (2019) recently attempted a comparison of GWP and LO of dietary recalls in four European countries,finding that GWP ranges from 5.1 kg CO2eq (median in Italy) to 5.9 kg CO2eq (median in France) per day, and total land use ranges from 6.6 m2(median in Italy) to 7.3 m2 (France median in) per day. Previous estimates of the GWP for these countries found lower values, with 3.4 kg CO2eq for Italy (mean;
Germani et al. (2014)), and 4.1 kg CO2eq for France (mean;Vieux et al. (2012)). According to recent estimates for Switzerland by Ernstoff et al. (2020), GWP of Swiss diets ranges between 3.0 and 7.1 kg CO2eq per capita per day. With 3.3 kg CO2eq for GWP and 6.4 m2for total land use, our estimates are at the lower end of the ranges found in previous studies, but within the same order of magnitude. This difference can be traced to regional differences as well as differences in environmental impact assessment methods, such as system boundaries and assumed management practices (Frehner et al., 2020;Notarnicola et al., 2017).
Further, in most of these studies, reduction of ASFein particular red meatewas identified to offer synergies for improvements of multiple environmental and human health impact categories, while increases of PSF, such as legumes, nuts, vegetables, and fruits, offer synergies for human health and, partly, environmental impact categories. Our results confirm these trends. Moreover, by expanding the impact categories towards including social risks and dietary cost, we show that when these two impact categories are included, PSF such as vegetables and fruits reveal trade-offs. In fact, both cost and SHI impact intensities are relatively high for these two food groups, resulting in substantial contributions to total SHI and cost. For the other impact categories, however, these food groups perform favourable, resulting in a trade-off between higher SHI and cost on the one hand, and improved AHEI and lower GWP
A. Frehner, H.H.E.V. Zanten, C. Schader et al. Journal of Cleaner Production 300 (2021) 126896
9