T. A. Ronge1, D. Nürnberg2, and R. Tiedemann1
1Alfred‐Wegener‐Institut Helmholtz‐Zentrum für Polar‐und Meeresforschung, Bremerhaven, Germany,2GEOMAR, Helmholtz‐Zentrum für Ozeanforschung, Kiel, Germany
Abstract
The transition from the Pliocene to the Pleistocene was accompanied by major tectonic reorganizations of key oceanic gateways. In particular, the gradual closure of the Panama Gateway and the constriction of the Indonesian Gateway significantly affected the structure of the Pacific thermocline. In the East Pacific, the thermocline shoaled from an early Pliocene El Niño‐like depth to its modern state, which had significant implications for global climate. Here we use Mg/Ca temperature estimates from subsurface and thermocline dwelling foraminifera to reconstruct the meridional Plio‐Pleistocene evolution of the Southeast Pacific thermocline, in relation to atmospheric circulation changes. In combination with similar reconstructions from the north‐equatorial Pacific, our data indicate a change in the thermocline, responding to the northward displacement of the Intertropical Convergence Zone/South Pacific High system between ~3.8 and 3.5 Ma. After 3.5 Ma, we record a second major phase of thermocline shoaling, which points to the Intertropical Convergence Zone/South Pacific High‐system movement toward its modern position along with the gradual cooling of the Northern Hemisphere and its associated glaciation.Thesefindings highlight that a warming globe may affect equatorial regions more intensively due to the potential temperature‐driven movement of the Intertropical Convergence Zone/South Pacific High and their associated oceanic systems.
Plain Language Summary
Over the course of the last 5 million years (Ma), two oceanic gateways experienced changes due to major tectonic reorganizations. At ~4.4 Ma, the passage connecting the Atlantic and Pacific closed when the connection between the Americas—the Panama land bridge—formed.On the western side of the Pacific, the formation of volcanic islands around Indonesia and Papua New Guinea at ~3.5–3 Ma hampered the transport of tropical water from the Pacific into the Indian Ocean. These processes significantly changed the ocean dynamics and should have altered the tropical Pacific temperature distribution from potential permanent El Niño‐like conditions (warm west, warm east) to the modern state. We present sea surface and subsurface temperature reconstructions for the tropical East Pacific off Chile covering the last 5 Ma. Our data imply that the Intertropical Convergence Zone and the South Pacific High moved toward the north along with the warming Northern Hemisphere from ~3.8 to 3.5 Ma. Parallel to the subsequent cooling and glaciation of the Northern Hemisphere, the East Pacific Intertropical
Convergence Zone/South Pacific High gradually moved toward their modern position. Ultimately, our data show how hemispherical warming/cooling can affect the position of the Intertropical Convergence Zone/South Pacific High and their associated systems of oceanic temperatures.
1. Introduction
The last 5 million years, spanning the early Pliocene to the late Pleistocene, mark a time period of radical changes in Earth's climate. During this interval, the entire globe evolved from warmer than present con- ditions toward the cooler icehouse climate of the Pleistocene (Filippelli & Flores, 2009; Haywood et al., 2009; Lisiecki & Raymo, 2007; Raymo et al., 2006). The Pliocene was marked by temperatures ~2 °C to
~3 °C warmer (Haywood et al., 2009), significantly higher CO2 levels at ~400 ppm —similar to the
~414 ppm reached due to our combustion of fossil fuels (Pagani et al., 2010; Raymo et al., 1996; Seki et al., 2010) — and global sea level 12 to 20 m higher (Miller et al., 2019) than in the preindustrial Holocene period. These factors make the Pliocene a valued (yet not identical) analogue for the predicted future climate change (Bonham et al., 2009; Dowsett & Robinson, 2009; Lunt et al., 2009). Furthermore, some studies indicate that the Pliocene might have experienced permanent El Niño‐like conditions in the Pacific Ocean (Bonham et al., 2009; Ravelo et al., 2004; Wara et al., 2005), with an altered Walker
©2020. The Authors.
This is an open access article under the terms of the Creative Commons Attribution‐NonCommercial License, which permits use, distribution and reproduction in any medium, provided the original work is properly cited and is not used for commercial purposes.
Key Points:
• Latitudinal movement of the ITCZ and South Pacific High
• Shoaling of the East Pacific thermocline
• Closure of the Central American Seaway
Correspondence to:
T. A. Ronge, thomas.ronge@awi.de
Citation:
Ronge, T. A., Nürnberg, D., &
Tiedemann, R. (2020). Plio‐Pleistocene variability of the East Pacific thermocline and atmospheric systems.
Paleoceanography and
Paleoclimatology,35, e2019PA003758.
https://doi.org/10.1029/2019PA003758
Received 17 AUG 2019 Accepted 8 JAN 2020
Accepted article online 10 JAN 2020
oceanic gateways are considered to have significantly reorganized the deep thermohaline circulation, ulti- mately resulting in the transition to the colder Pleistocene climate. The closure of the Central American Seaway (CAS; Panama) has experienced its most critical phase just during this time interval (Haug et al., 2001; Haug & Tiedemann, 1998). The constriction andfinal closure of the CAS led to the intensification of both the Gulf Stream and, in a broader perspective, the Atlantic Meridional Overturning Circulation, lead- ing to commonly higher sea surface temperatures (SSTs; Haug & Tiedemann, 1998; Haug et al., 2001; Karas et al., 2017) and salinities (Keigwin, 1982) in the Caribbean sector of the western Atlantic. At the same time, the East Pacific experienced a decline in surface temperatures, the intensification of costal upwelling (Dekens et al., 2007; Ibaraki, 1997), and the shoaling of the tropical East Pacific thermocline (Steph et al., 2006). Ultimately, the closure of the CAS is thought to have preconditioned the initiation of the Northern Hemisphere glaciation (NHG; Haug & Tiedemann, 1998; Haug et al., 2001; Karas et al., 2017; Lunt et al., 2007). The Indonesian Gateway is also considered as a major driver of the reorganization of the Plio‐ Pleistocene oceanic and climatic system (Cane & Molnar, 2001; Karas et al., 2009). The constriction of this gateway, in particular between 3.5 and 2.95 Ma, intensified the West Pacific Warm Pool, deepened the tro- pical Indian Ocean thermocline, and thereby fostered the formation of the East Pacific cold tongue (Karas et al., 2009, 2017).
By providing new Mg/Ca‐derived temperature records from surface to deep‐dwelling planktic foraminiferal species from ODP Site 1236 (~1,100 km off northern Chile), we further constrain the spatiotemporal evolu- tion of the tropical East Pacific thermocline as well as new insight into the position of the Intertropical Convergence Zone (ITCZ) and the South Pacific High (SPH). The location of Site 1236 is ideal in this respect, for further constraining the shoaling andfinally the closure of the CAS.
1.1. Regional Oceanography
Despite the fact that throughout the last 5 Ma the eastward drift of the Nazca Plate moved the location of Site 1236 about 185 km closer toward the South American continent (Meschede & Barckhausen, 2000), it is con- sidered that oceanic and sedimentary parameters remained similar to modern conditions over this time per- iod (Mix et al., 2003b).
Propelled by the perpetual force of the Southeast trade winds, deep waters shoal along the Peruvian coast (Kessler, 2006; Strub et al., 1998). Associated with the position of the ITCZ, moving toward the north during the austral winter (Strub et al., 1998), the upwelling intensity increases (Karstensen & Ulloa, 2008; Letelier et al., 2009), likewise decreasing SSTs in the TEP (Cane, 2005). Similar to the north‐south movement of the ITCZ, the position of the SPH as well is driven by a seasonal migration toward the warmer hemisphere (Schneider et al., 2017). However, due to its remote position, the costal upwelling does not directly influence Site 1236; thus, it is recording more oligotrophic subtropical gyre conditions (Mix et al., 2003b).
Subtropical Surface Water (SSW) is characterizing the surface parameters in our research area ~21° south of the equator with SSTs around 20 °C and a salinity of more than 35‰(Strub et al., 1998). The SSW is formed by increased evaporation rates in this area (Strub et al., 1998). To the east, the mixing of SSW and cold upwelled water results in Cold Coastal Water, colder than ~19 °C, which is dominating the surface waters up to the South American Coast (Ayón et al., 2008). North of the area occupied by SSW, mixing of SSW, Cold Costal Water, and North Pacific Tropical Surface Water forms Equatorial Surface Water (Strub et al.,
1998). At the location of Site 1236, South Pacific Eastern Subtropical Mode Water (SPESTMW) is occupying the depth between ~100 and 150 m right underneath SSW (Wong & Johnson, 2003). SPESTMW is defined by its potential vorticity|Q|smaller than 3 × 10⁻¹⁰m−1s−1(Wong & Johnson, 2003) and a temperature range of 13–20 °C (Fiedler & Talley, 2006). Further below, Southern Ocean Intermediate Waters (SOIW), comprising of Subantarctic Mode Water and Antarctic Intermediate Water, ventilates the water depth between about 200 and 1,400 m (Fiedler & Talley, 2006; Pena et al., 2013; Rippert et al., 2017).
Located at the Nazca Ridge, Site 1236 is close to the western edge of the northwardflowing Peru Chile Current (PCC; Figure 1), one of the globe's four major eastern boundary currents (Strub et al., 1998). The PCC is part of a larger East Pacific current system, sometimes referred to as the Humboldt or Peru Chile Current System. Besides the PCC, the current system includes the poleward directed Peru Chile Counter Current and the Peru Chile Undercurrent (Ayón et al., 2008; Strub et al., 1998). As part of the Subtropical Gyre, the PCC is a conduit for cold, nutrient‐rich Subantarctic surface waters toward the equator (Silva et al., 2009). Opposed to that, the Peru Chile Counter Current and the Peru Chile Undercurrent transport warmer equatorial and subtropical surface and subsurface waters toward the south (Silva et al., 2009).
1.2. El Niño–Southern Oscillation and Thermocline Depth
Usually, a temperature gradient prevails between a West Pacific warm pool and cold, nutrient‐rich waters in the East Pacific (Figures 2a and 2b). This pattern is accompanied by a deep thermocline off Indonesia and a shallow thermocline off Chile and Peru (Figures 2c and 2d). Typically, every two to seven years, the tempera- tures in the East Pacific alternate between unusual warm (El Niño) and cold (La Niña) conditions (e.g., McPhaden et al., 2006). Throughout an El Niño event, the equatorial trade winds weaken, resulting in a weakening of the Humboldt Current System and ultimately in reduced upwelling off South America (McPhaden et al., 2006). The decrease in wind stress allows for an eastwardflow of warm equatorial waters, relaxing the inclined Pacific thermocline, hence leading to a deepening of the thermocline in the East Pacific (Philander & Fedorov, 2003a; Sun et al., 2004). During so‐called La Niña events, stronger winds amplify the
“normal”pattern, accumulating warmth in the West Pacific and decreasing thermocline depth in the east (Philander & Fedorov, 2003a; Sun et al., 2004). While not undisputed (Watanabe et al., 2011), several Figure 1.General Pacific circulation patterns (Ayón et al., 2008; Fiedler & Talley, 2006; Mix et al., 2003a). ACC‐Antarctic Circumpolar Current, EUC‐Equatorial Undercurrent, NEC/SEC‐North/South Equatorial Current, NECC‐North Equatorial Counter Current, PCC‐Peru Chile Current, PCCC‐Peru Chile Counter Current. Core locations indicated by red dots. Map created with GeoMapApp.
studies have suggested that permanent El Niño‐like conditions, with a deep TEP thermocline, prevailed throughout the warmer than present Pliocene between ~5 and 3 Ma (e.g., Fedorov et al., 2006; Philander
& Fedorov, 2003b; Steph et al., 2010; Wara et al., 2005).
2. Material and Methods
Our study is based on new data from the tropical East Pacific ODP Site 1236 (Leg 202; 21°21.538′S, 81°26.164′ W; Mix et al., 2003a), drilled in a water depth of 1,322 m. All reconstructions follow the mean composite Figure 2.Pacific temperature pattern (Locarnini et al., 2013). (a) Sea surface temperatures. (b) Temperatures at 140‐m water depth. (c) Depth section of tempera- ture along the black line indicated in (a). Apparent calcification depth ofT. sacculifer‐1,G. tumida‐2,G. inflata‐3. (d) Depth section of temperature along the black line indicated in (b). SSW‐Subtropical Surface Water, SOIW‐Southern Ocean Intermediate Water, SPESTMW‐South Pacific Eastern Subtropical Mode Water. Core locations discussed here are indicated by red dots in (a) and (b) and vertical black lines in (c) and (d). Figure generated using ODV (Schlitzer, 2019).
Color palette‐Life Aquatic by P. Rafter.
depth scale of Site 1236 (Mix et al., 2003b). The combination of succeeding and complete sediment sequences from different holes, which forms the mean composite depth record, is given in the data set archived at www.
PANGAEA.de, supplementing this manuscript. Sediment samples were freeze‐dried and wet‐sieved using a 63‐μm sieve. Dry samples were split into <125‐, 125–250‐, 250–315‐, 315–400‐, and >400‐μm size fractions.
2.1. Foraminiferal Species
To reconstruct the temporal and vertical evolution of East Pacific surface to subsurface properties, we ana- lyzed Mg/Ca ratios as well as the stable isotope composition of three different planktic foraminiferal species (Trilobatus sacculifer (Spezzaferri et al., 2015) without saclike final chamber,Globorotalia tumida, and Globorotalia inflata), which are known to occupy different habitat depths within the upper ocean. The habi- tat occupied by these species relies on different oceanic parameters such as nutrients, light levels, and tem- perature or the concentration of chlorophyll (Curry et al., 1983; Fairbanks et al., 1980; Fairbanks & Wiebe, 1980; Steph et al., 2006; Watkins et al., 1998).
The symbiont‐bearingT. sacculiferis known to calcify within the well‐lit, nutrient‐depleted warm mixed layer (~50 m), down to the upper thermocline (Anand et al., 2003; Curry et al., 1983; Fairbanks et al., 1982; Hemleben et al., 1988; Jentzen et al., 2018; Lynch‐Stieglitz et al., 2015; Rippert et al., 2016).
Nevertheless, at least some specimens calcify within in deeper waters down to about ~100 m and might therefore record higherδ18O values (Duplessy et al., 1981; Lohmann, 1995; Lynch‐Stieglitz et al., 2015;
Spero et al., 2003). Further down the water column,G. tumidais known to live toward the bottom of the pho- tic zone (BOPZ) between ~100 and ~140 m (Lynch‐Stieglitz et al., 2015; Ravelo & Fairbanks, 1992; Ravelo &
Shackleton, 1995). This habitat depth is close to constant in tropical waters (Steph et al., 2006), making the isotopic composition and Mg/Ca ratios ofG. tumidaideal to record changes in the depth of the thermocline (today ~100–150 m; Locarnini et al., 2013), as the temperature at the tropical BOPZ is to some extent regu- lated by the vertical position of the thermocline (Steph et al., 2006). The deep‐dwellingG. inflatais known to calcify in a broader depth range than the other two species (mixed layer down to >500 m; Groeneveld &
Chiessi, 2011). Based on a core‐top study from the tropical South Atlantic, the apparent calcification depth (ACD) for theG. inflataspecimens used by us is reported to range between 350 and 400 m (Groeneveld &
Chiessi, 2011). For each species, we selected ~35 well‐preserved specimens from the narrow 315–400‐μm size fraction (e.g., Steph et al., 2006; Wara et al., 2005). To account for the broader calcification depth ofG. inflata, we followed the suggestions of Groeneveld and Chiessi (2011) according to which only specimens without a shiny calcite crust and three chambers in thefinal whorl were selected.
2.2. Mg/Ca Temperatures
For sample treatment, we followed the cleaning procedure of Schmidt and Lynch‐Stieglitz (2011), supple- mented by afinal reductive cleaning step described in Reißig et al. (2019). All samples were measured at the GEOMAR, using a Varian 720‐ES ICP OES. The Mg/Ca data were related to the ECRM752‐1 standard (Greaves et al., 2008), with a Mg/Ca reference value of 3.762 mmol/mol. Results were further drift corrected, using the ECRM752‐1 as internal consistency standard. The long‐term precision was ±0.1 mmol mol−1. We used the calibration of Anand et al. (2003) for the conversion of bothT. sacculifer(subsurface tempera- tures = subSSTT. sacculifer) andG. tumida(thermocline temperatures = TTG. tumida) Mg/Ca ratios to tempera- tures (Mg/Ca = 0.38exp(0.09 × T °C)). ForG. inflata(deep thermocline temperatures = DTTG. inflata), we applied the calibration of Groeneveld and Chiessi (2011) (Mg/Ca = 0.72exp(0.076 × T °C)). These equations were also used by Steph et al. (2006, 2010) and thus allow for a robust comparison of the East Pacific ODP site records. We are aware that the species used by us might have a different sensitivity to calcite dissolution and diagenetic affect. With a water depth of 1,322 m, Site 1236 is situated in slightly calcite unsaturated waters, below the threshold ofΔ[CO32−] of 21.3μmol kg−1(Regenberg et al., 2014), indicating that Mg2+removal might be of minor concern. However, Site 1236 sits well above the lysocline and carbonate preservation for the time interval covered by this study is excellent (Mix et al., 2003b). Thus, we consider a potential error introduced by dissolution of minor concern. Nonetheless, preferential removal of Mg2+ions might affect absolute temperature reconstructions, but the vertical gradient of our reconstructions and the comparison to similar records remains robust and thus allows for a comparison of subSST, TT, and DTT throughout the record.
2.3. Benthic Stable Isotopes
Benthic18O/16O isotope ratios (reported inδnotation versus VPDB; calibrated via NBS19 standard) were measured at the Alfred‐Wegener‐Institute (Bremerhaven, Germany) on Cibicidoides wuellerstorfi and Cibicidoides kullenbergi, using a Thermo Scientific MAT 253 mass spectrometer coupled to a Kiel IV Carbonate Device. Based on an internal laboratory standard (Solnhofen limestone) the one‐year long‐term precision was better than ±0.08‰. The sampling interval was 2 cm on average. However, we were not able tofind at least three monospecific specimens in the interval between ~8 and 9.40 m (~2–2.3 Ma).
2.4. Age Model
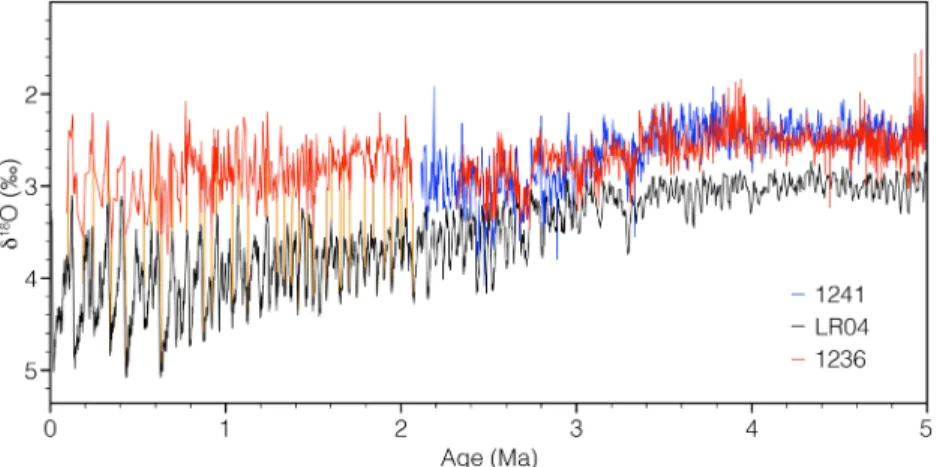
For the time interval between ~2.5 and 5 Ma, the initial age model for Site 1236 was established on magne- tostratigraphy (Tiedemann et al., 2007). Based on this initial model, benthicδ13C andδ18O records were visually correlated to the records of orbital‐tuned Site 1241 (Tiedemann et al., 2007). In order to extend the age model toward the top of the sediment record (0‐to ~8‐m composite depth), we correlated the benthic δ18O isotope record to the benthic isotope stack LR04 (Lisiecki & Raymo, 2005) using AnalySeries 2.0.4.2 (Paillard et al., 1996). The correlation and tie lines of the Site 1236 isotope record (this study; Tiedemann et al., 2007) to reference Site 1241 and the LR04 stack are displayed in Figure 3 and show a good correlation between both records. Due to the use of these independent methods (magnetostratigraphy,δ13C,δ18O, orbi- tal tuning (1241)) we have a high confidence in the age model of Site 1236, in particular for the main interval (2–5 Ma) primarily discussed in this study.
3. Results
3.1. Mg/Ca Temperatures
Over the last 5 million years Mg/Ca ratios varied between 2.19 and 4.04 mmol mol−1forT. sacculifer, show- ing consistently higher Mg/Ca ratios than the other species. ForG. tumida, Mg/Ca ratios range between 1.29 and 2.36 mmol mol−1and are close for those ofG. inflata(1.64 and 2.39 mmol mol−1; Figure 4). According to the ACD of the different planktic foraminiferal species outlined above, the Mg/Ca ratios as well depict a con- sistent depth distribution withT. sacculiferrepresenting subsea surface (subSST),G. tumidathermocline (TT), andG. inflata deep thermocline (DTT) temperatures throughout the record. Our interpretations assume that the foraminiferal species did not significantly change their habitat depth and apparent calcifica- tion depth over the time period covered in this paper.
Small changes (~3.5 °C) in subSSTs are observed throughout the entire record with an average temperature of about 21 °C, close to the modern SST of ~20 °C, as inferred from WOA13 (Locarnini et al., 2013). After about 3.8 Ma (coinciding with the closure of the CAS), temperatures gradually increase by ~1 °C. The most significant deviation from the 5‐million‐year average, reaching ~27 °C, is recorded between ~2.4 and 2.2 Ma (Figure 4).
Figure 3.Benthicδ18O records of Site 1236 (red; this study; 2.4–5 Ma; Tiedemann et al., 2007), Site 1241 (blue; Tiedemann et al., 2007), and the global benthic stack LR04 (black; Lisiecki & Raymo, 2005). Vertical orange lines indicate the tie lines between Site 1236 (~0 to 2 Ma) and the LR04 Stack.
On average, TTG. tumidaare lower than subSSTT. sacculifer(Figure 4). Before ~4.8 Ma however, TTG. tumidaand subSSTT. sacculiferare in a similar range. Between ~4.8 and ~3.8 Ma TTG. tumidagradually decrease from about 20 °C to 16 °C, parallel to the closure of the CAS. From 3.8 to 3.5 Ma, TTG. tumidarapidly increase by about 5 °C, almost reaching subSSTT. sacculifervalues that also increase by ~1 °C (Figure 4). Following this warming event, TTG. tumidaprogressively decrease toward modern values, showing a more dynamic evolution with higher amplitudes than subSSTT. sacculifervalues.
The DTTG. inflataalso shows lower amplitudes than TTG. tumidawith a 5‐million‐year average of about 13 °C, indicating that the BOPZ depth is the most dynamic depth in our study area. While TTG. tumidarapidly increase, DTTG. inflatabegin to decrease after ~3.8 Ma from 15 °C to 11 °C (Figure 4). For the rest of the DTTG. inflatarecord, values oscillate between ~11 °C and ~14 °C but show no visible trend on average.
Figure 4.Site 1236 downcore records. (a) Mg/Ca records ofT. sacculifer(broken red),G. tumida(broken green), andG. inflata(broken blue). (b) Mg/Ca‐based temperatures ofT. sacculifer—subSSTT. sacculifer, G. tumida‐TTG. tumida, andG. inflata‐DTTG. inflata. Colored dots indicate modern temperatures at Site 1236 (Locarnini et al., 2013). Red broken line‐average subSSTT. sacculifer.(c) SubSSTT. sacculiferto TTG. tumidadifference (ΔT; orange), seven‐point smoothedΔT record (green). (d) Global benthicδ18O stack (Lisiecki & Raymo, 2005). CAS‐intensification of Central American Seaway closure, ITF‐intensification of the constriction of the Indonesian Throughflow, iNHG‐intensification of Northern Hemisphere Glaciation, MPT‐Mid‐Pleistocene Transition.
The vertical temperature gradient (primarily defined by the subSSTT. sacculiferand TTG. tumidarecords) pro- gressively increases throughout the record from ~0 °C to ~7 °C (Figure 4). This trend is interrupted by an event between 3.8 and 3.5 Ma, caused by warming TTG. tumida and a second event between ~2.3 and
~1.7 Ma, as a result of rapidly warming subSSTT. sacculifer.
4. Discussion
As we show in Figure 2c, the isotherms steeply slope toward the South American continent. To assess whether or not the observed temperature patterns in our records were caused by changes in oceanic para- meters or by the tectonic drift along the backtrack of the sites, we analyzed the temperature distribution along their path. Moving Site 1236 along its backtrack results in no substantial change of subSSTs, TTs, or DTTs (Figure 5). Likewise, we discard the tectonic movement of Site 1241 (Steph et al., 2006) as the potential driver of the temperature pattern between Sites 1236 and 1241. During the time interval in question (~2.6–4 Ma; Figure 6), all changes are driven by the pattern of Site 1236 and not by 1241 temperatures. In our research area, instead, the TT might have been sensitive to a shift in the geographical position of Site 1236 (Figure 5). Nevertheless, this ~3° longitudinal shift might only have accounted for a TT change of 0.7 to 1 °C, a small fraction of the total ~7 °C decrease. Hence, we discard the tectonic effect on the observed tem- perature patterns and interpret these as changes in the water mass structure of the TEP.
4.1. Plio‐Pleistocene Zonal Temperatures
On its own, the East Pacific Site 1236 subSSTT. sacculiferrecord (Figure 4) displays no significant feature over the last 5 Ma. The comparison of Site 1236 subSSTT. sacculiferto the western Pacific record from ODP Site 806 (Wara et al., 2005) shows that Site 1236 temperatures constantly remained below Site 806 values, only inter- rupted by a warm spike at Site 1236 between ~2.4 and ~2.2 Ma, parallel to the intensification of the NHG (Figure 6). During this brief time interval subSST across the tropical Pacific converge (Figures 6a–6c;
Raddatz et al., 2017; Wara et al., 2005), before the modern east‐west gradient is fully established. Between
~2.1 and 2.4 Ma, the southwest migration of the South Pacific Convergence Zone (Raddatz et al., 2017) trig- gered a displacement of the West Pacific Warm Pool, thus reorganizing the temperature patterns across the tropical Pacific. If the additional information from ODP Site 847 (Wara et al., 2005) is considered, the Site 1236 pattern points to permanent El Niño‐like conditions between ~3 and 5 Ma. During modern non‐El Niño conditions a strong east to west temperature gradient is observed within the Pacific subSSTT. sacculifer. Propelled by the perpetual motion of the equatorial trade winds, cold deep water shoals along the coast off South America, resulting in a shallow thermocline and colder subSSTT. sacculifer in the southeast Pacific.
During an El Niño event, the trade winds weaken significantly. This mitigation results in the relaxation of Figure 5.Tectonic backtrack of Sites 1236 and 1241. (a) Sea surface temperatures. (b) Temperatures at the bottom of the photic zone (140 m). Red interval indicates the last 5 Ma. Background grey scale indicates modern temperatures (Locarnini et al., 2013) with bold numbers indicating temperatures at the modern location and the site 5 Ma ago.
the eastward sloping thermocline depth (TCD) and increased subSSTT. sacculiferin the East Pacific (Cane, 2005; Sun et al., 2004). After ~2.3 Ma the West Pacific subSSTT. sacculifer start to increase (ODP Site 806;
Wara et al., 2005), while the East Pacific temperatures decrease (Site 847; Wara et al., 2005) and/or remain the same (Site 1236; this study). Several studies have attributed this change to the end of the permanent El Niño‐like state (e.g., Fedorov et al., 2006; Wara et al., 2005) and the transition toward modern conditions (Figure 6). However, as stated in our introduction, the notion of permanent El Niño‐
like conditions is not unchallenged and the scientific discussion is far from being settled (Watanabe et al., 2011).
4.2. East Pacific Subsurface to Thermocline Temperatures
Below the surface, an increasing temperature gradient between surface and deeper waters indicates that this transition began almost 2.3 million years before it became apparent in surface temperatures of equatorial Site 847 (Wara et al., 2005) at about 2.4 Ma. We interpret the large increase in the temperature gradient between subsurface waters (T. sacculifer), the BOPZ (G. tumida), and the deeper waters (G. inflata) as the progressive decrease in the depth of the East Pacific thermocline (Figure 7). At Site 1236, the thermocline Figure 6.Plio‐Pleistocene evolution of East Pacific temperatures. (a) Surface temperatures of Sites 1236 (this study), 847/806 (Wara et al., 2005), and 1241 (Steph et al., 2006). (b) Subsurface temperatures of Sites 1236 (this study), 1239 (Steph et al., 2010), and 1241 (Steph et al., 2006). (c) Temperature gradient of subSSTT.
sacculifer(red) and TTG. tumida(blue). The black arrow indicates the northward displacement of the ITCZ/SPH. The brown arrow points to the last data point of Site 847.
Figure 7.Plio‐Pleistocene evolution of East Pacific thermocline structure. (a) Early Pliocene. Tropical Pacific thermocline begins to tilt slightly. BOPZ waters of Site 1236 and Site 1241 experience elevated temperatures. (b) Late Pliocene. Intensification of the westward directed trade winds intensifies upwelling, triggering the shoaling of the thermocline. ITCZ/SPH and associated wind and current systems displaced to the north. BOPZ waters at Site 1241 colder than at Site 1236. (c) Pleistocene. Southward movement of the ITCZ/SPH and associated wind and current systems. Thermocline bulge moves toward the south, relaxation of the temperature gradient between Sites 1236 and 1241; shoaling of thermocline at Site 1236, deepening at Site 1241. Blue arrows‐Equatorial Undercurrent, red arrows‐ South Equatorial Current, blue to red arrow‐upwelling, brown arrows‐North Equatorial Countercurrent, green arrow‐Walker Cell.
was relatively deep during the Early Pliocene from ~5 to 4.5 Ma. During this time, parallel to the closure of the CAS, a gradual cooling of the TTG. tumidamarks thefirst step of thermocline shoaling and is completed at about 4 Ma. This early modification in East Pacific TCD is also observed in the tropical Northeast Pacific record at ODP Site 1241 (Steph et al., 2006) as well as the equatorial ODP Site 1239 (Figures 6 and 7a;
Steph et al., 2010). With respect to our reconstructed subSSTT. sacculifertemperatures, it is noteworthy that South Pacific subSST were significantly warmer than equatorial temperatures at Site 847 (Figure 6; Wara et al., 2005). The modern East Pacific temperature gradient (Locarnini et al., 2013) indicates a subSST tem- perature difference of up to 2.5 °C for the calcification depth ofT. sacculifer, with lower temperatures prevail- ing at Site 847. We assume that the continuous shoaling of the East Pacific thermocline place Site 847 under the influence of colder waters after ~1.6 Ma.
An interval of warming TTG. tumidaand to a lesser extend subSSTT. sacculifertemperatures interrupted the transition to colder modern‐like conditions at Site 1236, between ~3.8 and 3.5 Ma (Figures 6 and 7b). No such pattern was registered in the deeper DTTG. inflatarecord. Hence, we assume that the temperature rise reflects a deepening of TCD to a depth between the habitats ofG. tumidaandG. inflata. Similar to the mod- ern East Pacific, the subsurface temperatures at all northerly sites are clearly higher than subSSTT. sacculiferat Site 1236, during this interval. This pattern is reversed at the habitat depth ofG. tumida, as the time period between ~3.8 and 2.6 Ma is characterized by TTG. tumida, which were up to 5 °C warmer at the southerly Site 1236, compared to the northern Sites 1239 and 1241 (Figure 6; Steph et al., 2006, 2010).
Several mechanisms might be responsible for this observed TTG. tumidawarming at Site 1236 (Figure 6): (1) shifting boundaries between SPESTMW and underlying SOIW; (2) rivaling influence of SOIW and North Pacific Intermediate Water (NPIW); or (3) latitudinal shifting of the ITCZ, the SPH, and associated upwelling systems.
As SOIW is significantly colder than overlying SPESTMW (Locarnini et al., 2013), a reduced influence of these southern‐sourced waters would result in warmer temperatures at the location of Site 1236. Parallel to the constriction of the Indonesian Gateway at ~3.5 Ma (Karas et al., 2009), SOIW became more dominant at subtropical West Pacific subsurface level and resulted in the gradual cooling of these waters (Karas et al., 2011; McClymont et al., 2016). In a similar way, the northward expansion of SOIW in the East Pacific could have contributed to the gradual cooling observed in TTG. tumidaat our site after ~3.5 Ma. Likewise, decreased SOIW influence between ~3.8 and 3.5 Ma might explain the warming TTG. tumida trend at Site 1236.
Although we cannot rule out a contribution of this process to the pattern observed by us, a second process must have acted upon TTG. tumida, as no warming trend was observed between 3.8 and 3.5 Ma by deeper dwellingG. inflata(Figure 6). As this pattern is only observed byG. tumida, we argue that the largest change in subsurface processes must have occurred between the habitat depth ofG. tumidaandG. inflata.
At ~21°S, the tongue of SOIW is about 2–3 °C colder than modern NPIW to the north of the equator (Locarnini et al., 2013). Replacing the influence of SOIW with slightly warmer NPIW would thus result in a TTG. tumidaincrease at Site 1236 similar to the pattern observed by us (Figure 6). The rivaling influence of NPIW and SOIW in the equatorial East Pacific was previously demonstrated for the last two glacial‐ interglacial cycles (Rippert et al., 2017). Reconstructed δ13C records on the subthermocline species Globorotaloides hexagonusindicate the dominant presence of NPIW during peak glacial, and SOIW during interglacial periods (Rippert et al., 2017). The ACD ofG. hexagonus(340–430 m; Rippert et al., 2016) is close to the ACD ofG. inflata(Groeneveld & Chiessi, 2011). Thus, we would expect to see this pattern in ourG.
inflatarecord, parallel to theG. tumidawarming signal. If slightly warmer NPIW would have penetrated from the north, we would also expect to observe the warming signal in both northern sites (1239/1241) and not only at our South Pacific Site.
As we discussed above, the westward directed equatorial trade winds cause upwelling along the equator.
Their motion results in a thermocline“bulge”that deepens toward the north and the south (Figures 7 and 8), resulting in elevated TTG. tumidaat modern Site 1236, when compared to Sites 1239 and 1241 (Figures 7 and 8). While previous studies primarily focused on the evolution of the zonal gradient between the East and West Pacific (e.g., Wara et al., 2005; Zhang et al., 2014), we present a new meridional perspective of ther- mocline depth and temperatures, independent from the permanent El Niño discussion. As tropical precipi- tation is intimately coupled to the location of the ITCZ, several proxy records highlight a glacial‐interglacial
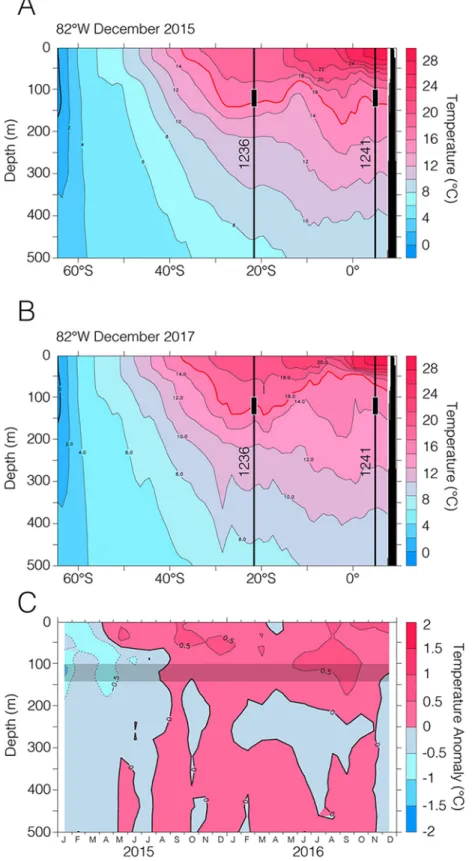
Figure 8.Temperature section along the black line indicated in Figure 1b. (a) El Niño year of 2015 versus (b) the reference year of 2017. Red lines indicate the 16 °C isotherm, which is the most dominant isotherm of the BOPZ during an El Niño event. Comparing 2015 and 2017, the development of the thermocline bulge discussed here becomes apparent. Despite its southern location, the BOPZ at 1236 is also experiencing a considerable warming during an El Niño event. Black lines indicate the water masses above Sites 1236/1241. Black boxes mark the average habitat depth ofG. tumida. (c) Time series of temperature anomalies (versus monthly average) during the 2015/2016 El Niño event at the location of Site 1236. The grey bar indicates the average habitat depth ofG. tumida(Argo Program, 2019).
displacement of rainfall patterns, hence the ITCZ, toward the warmer hemisphere (Broccoli et al., 2006;
Clark et al., 2012; Escobar et al., 2012; McGee et al., 2014; Wang et al., 2004; Wang & Rong, 2007). While the movement of the ITCZ and the SPH is by now a well‐established mechanism (Broccoli et al., 2006;
Chiang et al., 2014; Schneider et al., 2017), there is no information on the Pliocene evolution of the oceanic (upwelling) response to latitudinal changes in the ITCZ/SPH wind systems.
The BOPZ temperature (TTG. tumida) increase observed between 3.8 and 3.5 Ma indicates the northward movement of the SPH and the ITCZ, and thus of the trade winds. This process places the BOPZ of Sites 1239 and 1241 in the direct vicinity of the thermocline, while the TCD increases toward the south. As seen in Figure 2c, the ACD ofG. tumidais right at the depth of the modern thermocline. The north‐eastward movement of the SPH (and the northerly ITCZ) places this depth under the influence of warmer waters above the thermocline. At the same time subSSTT. sacculiferalso warm (Figure 4). The observed thermocline deepening (as indicated by the increasing TTG. tumida temperatures) likely also affected the calcification depth ofT. sacculifer(subSST), triggering the observed increase in temperatures. Following thisfirst forma- tion of the temperature bulge, the subsequent cooling observed in our TTG. tumidarecord suggests a gradual shoaling of East Pacific TCD into the Pleistocene. After 3 Ma, Steph et al. (2006) observed a significant tem- perature increase at the BOPZ (TTG. tumida). This increase can result from a relaxation of the meridional East Pacific temperature gradient, causing a decreased gradient of TTG. tumidaat the northern sites and South Pacific Site 1236 (Figure 7c). This relaxation argues for the southward movement of the ITCZ/SPH system, slowly establishing the modern temperature gradient between Sites 1236 and 1241. Both northern sites experienced a phase of thermocline deepening between ~3.0 and 2.4 Ma (Steph et al., 2010). Following our hypothesis, this phase points to the southward movement of the bulge and its associated TCD (Figure 7c).
Our records show that a gradual shoaling of the TCD affected the deeper waters (G. inflata) between 4 and 2.5 Ma. Following this time period, no significant trend in their respective temperatures is observed. Hence, we assume that thereafter, this water depth permanently remained below the depth of the constantly shoaling East Pacific thermocline. However, indicated by ourG. tumidarecord (Figure 4) the East Pacific thermocline continued to shoal throughout the entire time period from 3.5 to ~0.13 Ma.
The very long interval over which the shoaling of the East Pacific TCD occurred, points toward a slow and steady driving force behind these processes. The long‐term formation of the northern hemisphere ice cap (Fedorov et al., 2006) and/or tectonic processes (Karas et al., 2009; Steph et al., 2006, 2010) are likely candi- dates to have caused the perturbation in the Pliocene and Pleistocene eastern Pacific water column.
Two ocean gateways, crucial to global oceanic circulation, closed or narrowed parallel to the changes observed in the East Pacific water column. A critical threshold in the closure of the CAS was reached between 4.7 and 4.2 Ma in the East Pacific (Haug et al., 2001). The CAS closure had a significant impact on circulation patterns of the Atlantic and the Pacific and is considered to be a likely candidate for the ampli- fication of the Northern Hemisphere glaciation (Haug & Tiedemann, 1998; Hay, 1996).
Throughout the tropical Pacific, the CAS closure was accompanied by cooling equatorial Pacific SSTs, while the magnitude and evolution of the west‐east gradient and the permanent El Niño‐like conditions are still a matter of an ongoing debate (Bonham et al., 2009; Haug & Tiedemann, 1998; Ravelo et al., 2004; Steph et al., 2006; Wara et al., 2005; Watanabe et al., 2011; Zhang et al., 2014). In addition to these processes, thermocline temperature reconstructions indicate a progressive shoaling of the East Pacific thermocline during the Plio‐ Pleisotcene (Steph et al., 2010; Zhang et al., 2012; this study). However, the timing of changes in East Pacific indicates that different or additional processes affected the meridional development of TCD. Following the closure of the CAS, a strengthening of the global thermohaline circulation resulted in the intensification of the Atlantic Meridional Overturning Circulation since ~4.6 Ma (Haug & Tiedemann, 1998; Karas et al., 2017), transporting moisture and heat to the Northern Hemisphere. In turn, the ITCZ/SPH system moves toward the warmer hemisphere (Broccoli et al., 2006) and displaces the position of the Walker Circulation and the trade winds to the north. The northward displacement of the equatorial wind systems induced a similar shift in the equatorial thermocline bulge and placed the BOPZ of Site 1236 (this study) in warmer waters compared to northerly Site 1241 (Steph et al., 2006; Figure 7b). During the time interval in question (~3.8–3.5 Ma) however, North Atlantic subSSTT. sacculiferdeclined, while southern tropical Atlantic tempera- tures increased (Karas et al., 2017). This pattern most likely resulted in a weakened Atlantic Meridional
‐
west‐east SST gradient (Karas et al., 2009; Steph et al., 2006, 2010; Wara et al., 2005; Watanabe et al., 2011; Zhang et al., 2012; Zhang et al., 2014).
While the long‐term shoaling of the East Pacific TCD and the development of the zonal Pacific SST gradient was a result of the closure/constriction of oceanic gateways (CAS and IG), we argue that the meridional evo- lution of BOPZ temperatures (TTG. tumida) in the East Pacific was mostly driven by the north‐south move- ment of the ITCZ/SPH system that was in turn forced by the intensification of the Gulf Stream, the PMOC, and later on by the increased NHG.
The offset of our youngest data points at ~135 ka to modern East Pacific temperatures (Figure 4b; Locarnini et al., 2013) likely reflects the Pleistocene evolution of the East Pacific cold tongue (Liu et al., 2019).
5. Summary and Conclusions
Our reconstructions of Pliocene and Pleistocene changes in East Pacific subsurface and thermocline tem- peratures shed new light on the evolution of the Pacific thermocline depth. Based on Mg/Ca‐derived records, the subSSTT. sacculiferevolution at Site 1236 shows no distinctive trend and maintains a more or less constant offset to the tropical West Pacific (Figure 6; Wara et al., 2005). Using Mg/Ca temperatures from deeper dwell- ingG. tumida, Steph et al. (2006) were able to show that the shoaling of East Pacific TCD affected the BOPZ (TTG. tumida) already at ~4.8 Ma.
While the zonal gradient in thermocline evolution is widely examined, our data add a so far unconsidered meridional component to these reconstructions. We are able to show that the East Pacific water column was not homogenous between ~4 and 2.7 Ma. Rather it was marked by a pronounced meridional difference between the doldrums sites to the north and the South Pacific (Figure 7). While the TTG. tumidaat the dol- drums reached modern‐like values during this time period (Steph et al., 2006), our data show a pronounced increase in TTG. tumidabetween 3.8 and 3.5 Ma that was followed by a gradual decline toward the Pleistocene.
The TTG. tumidagradient—highlighted in Figures 6 and 7—points to a three‐dimensional thermocline pat- tern that began to form at ~3.8 Ma. Thefirst component of this pattern is the known zonal evolution throughout the Plio‐Pleistocene (Groeneveld et al., 2006; Steph et al., 2006; Steph et al., 2010; Wara et al., 2005; Y. G. Zhang et al., 2014). The second component is the northward movement of the ITCZ/SPH system and thus the equatorial temperature bulge that slopes toward the north and the south (Figure 7). Compared to ODP Site 1241 (Steph et al., 2006) we propose that coupled to the position of the ITCZ/SPH and their wind systems, the latitudinal dimension of this bulge might have been more variable through time. Hence, it might be more prone to local or short‐termed changes caused by a reorganization of global temperatures.
According to the IPCC, the ongoing global warming may favor more El Niño‐like conditions over the next centuries via the weakening of the equatorial Walker circulation (Vecchi & Soden, 2007). This weakening will result in a deepening of the East Pacific thermocline and diminish the eastward transport of subsurface waters from the West to the East Pacific. However, this transport is crucial for the supply of micronutrients from volcanic influenced regions in the west toward the high‐chlorophyll low‐nutrient area in the east (Behrens et al., 2018). Furthermore, a warming globe might also cause significant changes in the position of the ITCZ/SPH (Schneider et al., 2017). Our study shows that this process could affect equatorial regions
more intensively due to the potential temperature‐driven movement of the ITCZ/SPH and thus, the equator- ial thermocline bulge. To achieve a more detailed picture of the evolution of the East Pacific ITCZ, the SPH, and the associated development and meridional movement of the thermocline bulge during the Warm Pliocene, we need a better meridional resolution of sediment records, covering the modern position of the bulge (Figure 8b).
References
Anand, P., Elderfield, H., & Conte, M. H. (2003). Calibration of Mg/Ca thermometry in planktonic foraminifera from a sediment trap time series.Paleoceanography,18(2), 1050. https://doi.org/10.1029/2002PA000846
Argo Program. (2019). Argo temperature data.
Ayón, P., Criales‐Hernandez, M. I., Schwamborn, R., & Hirche, H.‐J. (2008). Zooplankton research off Peru: A review.Progress in Oceanography,79(2‐4), 238–255. https://doi.org/10.1016/j.pocean.2008.10.020
Behrens, M. K., Pahnke, K., Schnetger, B., & Brumsack, H.‐J. (2018). Sources and processes affecting the distribution of dissolved Nd iso- topes and concentrations in the West Pacific.Geochimica et Cosmochimica Acta,222, 508–534. https://doi.org/10.1016/j.gca.2017.11.008 Bonham, S. G., Haywood, A., Lunt, D. J., Collins, M., & Salzmann, U. (2009). El Niño–Southern Oscillation, Pliocene climate and equi-
finality.Philosophical Transactions of the Royal Society,367(1886), 127–156. https://doi.org/10.1098/rsta.2008.0212
Broccoli, A. J., Dahl, K. A., & Stouffer, R. J. (2006). Response of the ITCZ to Northern Hemisphere cooling.Geophysical Research Letters,33, L01702. https://doi.org/10.1029/2005GL024546
Burls, N. J., Fedorov, A. V., Sigman, D. M., Jaccard, S. L., Tiedemann, R., & Haug, G. H. (2017). Active Pacific meridional overturning circulation (PMOC) during the warm Pliocene.Science Advances,3, e1700156. https://doi.org/10.1126/sciadv.1700156
Cai, W., Borlace, S., Lengaigne, M., van Rensch, P., Collins, M., Vecchi, G. A., et al. (2014). Increasing frequency of extreme El Niño events due to greenhouse warming.Nature Climate Change,4(2), 111–116. https://doi.org/10.1038/nclimate2100
Cane, M. A. (2005). The evolution of El Niño, past and future.Earth and Planetary Science Letters,230(3‐4), 227–240. https://doi.org/
10.1016/j.epsl.2004.12.003
Cane, M. A., & Molnar, P. (2001). Closing of the Indonesian seaway as a precursor to east African aridification around 3–4 million years ago.Nature,411(6834), 157–162. https://doi.org/10.1038/35075500
Chiang, J. C. H., Lee, S.‐Y., Putnam, A. E., & Wang, X. (2014). South Pacific Split Jet, ITCZ shifts, and atmospheric North–South linkages during abrupt climate changes of the last glacial period.Earth and Planetary Science Letters,406, 233–246. https://doi.org/10.1016/j.
epsl.2014.09.012
Clark, P. U., Shakun, J. D., Baker, P. A., Bartlein, P. J., Brewer, S., Brook, E., et al. (2012). Global climate evolution during the last degla- ciation.PNAS,109(19), E1134–E1142. https://doi.org/10.1073/pnas.1116619109
Curry, W. B., Thunell, R. C., & Honjo, S. (1983). Seasonal changes in the isotopic composition of planktonic foraminifera collected in Panama Basin sediment traps.Earth and Planetary Science Letters,64(1), 33–43. https://doi.org/10.1016/0012‐821X(83)90050‐X Dekens, P. S., Ravelo, A. C., & McCarthy, M. D. (2007). Warm upwelling regions in the Pliocene warm period.Paleoceanography,22,
PA3211. https://doi.org/10.1029/2006PA001394
Dowsett, H. J., & Robinson, M. M. (2009). Mid‐Pliocene equatorial Pacific sea surface temperature reconstruction: A multi‐proxy per- spective.Philosophical Transactions of the Royal Society,367(1886), 109–125. https://doi.org/10.1098/rsta.2008.0206
Duplessy, J.‐C., Bé, A. W. H., & Blanc, P. L. (1981). Oxygen and carbon isotopic composition and biogeographic distribution of planktonic foraminifera in the Indian Ocean.Palaeogeography, Palaeoclimatology, Palaeoecology,33(1‐3), 9–46. https://doi.org/10.1016/0031‐0182 (81)90031‐6
Escobar, J., Hodell, D. A., Brenner, M., Curtis, J. H., Gilli, A., Mueller, A. D., et al. (2012). A ~43‐ka record of paleoenvironmental change in the Central American lowlands inferred from stable isotopes of lacustrine ostracods.Quaternary Science Reviews,37, 92–104. https://doi.
org/10.1016/j.quascirev.2012.01.020
Etourneau, J., Schneider, R., Blanz, T., & Martinez, P. (2010). Intensification of the Walker and Hadley atmospheric circulations during the Pliocene–Pleistocene climate transition.Earth and Planetary Science Letters,297(1‐2), 103–110. https://doi.org/10.1016/j.
epsl.2010.06.010
Fairbanks, R. G., Sverdlove, M., Free, R., Wiebe, P. H., & Bé, A. W. H. (1982). Vertical distribution and isotopic fractionation of living planktonic foraminifera from the Panama Basin.Nature,298(5877), 841–844. https://doi.org/10.1038/298841a0
Fairbanks, R. G., & Wiebe, P. H. (1980). Foraminifera and chlorophyll maximum: Vertical distribution, seasonal succession, and paleo- ceanographic significance.Science,209(4464), 1524–1526. https://doi.org/10.1126/science.209.4464.1524
Fairbanks, R. G., Wiebe, P. H., & Be, A. W. (1980). Vertical distribution and isotopic composition of living planktonic foraminifera in the western North Atlantic.Science,207(4426), 61–63. https://doi.org/10.1126/science.207.4426.61
Fedorov, A. V., Dekens, P. S., McCarthy, M. D., Ravelo, A. C., deMenocal, P. B., Barreiro, M., et al. (2006). The Pliocene paradox (mechanisms for a permanent El Niño).Science,312(5779), 1485–1489. https://doi.org/10.1126/science.1122666
Fiedler, P. C., & Talley, L. D. (2006). Hydrography of the eastern tropical Pacific: A review.Progress in Oceanography,69(2‐4), 143–180.
https://doi.org/10.1016/j.pocean.2006.03.008
Filippelli, G. M., & Flores, J.‐A. (2009). From the warm Pliocene to the cold Pleistocene: A tale of two oceans.Geology,37(10), 959–960.
https://doi.org/10.1130/focus102009.1
Greaves, M., Caillon, N., Rebaubier, H., Bartoli, G., Cacho, I., Clarke, L., et al. (2008). Interlaboratory comparison study of calibration standards for foraminiferal Mg/Ca thermometry.Geochemistry, Geophysics, Geosystems,9, Q08010. https://doi.org/10.1029/
2008GC001974
Groeneveld, J., & Chiessi, C. M. (2011). Mg/Ca ofGloborotalia inflataas a recorder of permanent thermocline temperatures in the South Atlantic.Paleoceanography,26, PA2203. https://doi.org/10.1029/2010PA001940
Groeneveld, J., Steph, S., Tiedemann, R., Garbe‐Schönberg, D., Nürnberg, D., & Sturm, A. (2006). Pliocene development of east‐Pacific hydrology as revealed by Mg/Ca analyses on the planktic foraminiferGlobigerinoides sacculifer. InODP Scientific Results, Leg 202(Chap.
209). College Station, TX.
Haug, G. H., & Tiedemann, R. (1998). Effect of the formation of the Isthmus of Panama on Atlantic Ocean thermohaline circulation.
Nature,393(6686), 673–676. https://doi.org/10.1038/31447 Acknowledgments
This work was funded by the Federal Ministry of Education and Research (BMBF; Germany) project 03G0213A– SOPATRA and DFG SPP‐1158 project RO5057/1‐2. We thank the crew and shipboard party of R/VJOIDES ResolutionLeg 202, A. Mackensen, S.
Steph for the data, and S. Fessler, R.
Fröhlking‐Teichert, N. Gehre, G.
Meyer, L. Schönborn, S. Schumacher, M. Seebeck, and S. Wiebe for the tech- nical support. Thanks to P. Rafter for providingthe Life AquaticODV palette.
Data are accessible at https://doi.pan- gaea.de/10.1594/PANGAEA.896166.
Karstensen, J., & Ulloa, O. (2008). The Peru‐Chile Current System. In J. H. Steele, S. A. Thorpe, & K. K. Turekian (Eds.),Encyclopedia of Ocean Sciences(Vol. 2e, pp. 385–392). London: Academic Press.
Keigwin, L. D. (1982). Isotopic paleoceanography of the Caribbean and East Pacific: Role of Panama uplift in late Neogene time.Science, 217(4557), 350–353. https://doi.org/10.1126/science.217.4557.350
Kessler, W. S. (2006). The circulation of the eastern tropical Pacific: A review.Progress in Oceanography,69(2‐4), 181–217. https://doi.org/
10.1016/j.pocean.2006.03.009
Latif, M., Semenov, V. A., & Park, W. (2015). Super El Niños in response to global warming in a climate model.Climatic Change,132(4), 489–500. https://doi.org/10.1007/s10584‐015‐1439‐6
Lenton, T. M., Held, H., Kriegler, E., Hall, J. W., Lucht, W., Rahmstorf, S., & Schnellnhuber, H. J. (2008). Tipping elements in the Earth's climate system.PNAS,105(6), 1786–1793. https://doi.org/10.1073/pnas.0705414105
Letelier, J., Pizarro, O., & Nuñez, S. (2009). Seasonal variability of coastal upwelling and the upwelling front off central Chile.Journal of Geophysical Research,114, C12009. https://doi.org/10.1029/2008JC005171
Lisiecki, L. E., & Raymo, M. E. (2005). A Pliocene‐Pleistocene stack of 57 globally distributed benthic d18O records.Paleoceanography,20, PA1003. https://doi.org/10.1029/2004PA001071
Lisiecki, L. E., & Raymo, M. E. (2007). Plio–Pleistocene climate evolution: Trends and transitions in glacial cycle dynamics.Quaternary Science Reviews,26(1‐2), 56–69. https://doi.org/10.1016/j.quascirev.2006.09.005
Liu, J., Tian, J., Liu, Z., Herbert, T. D., Fedorov, A. V., & Leyle, M. (2019). Eastern equatorial Pacific cold tongue evolution since the late Miocene linked to extratropical climate.Science Advances,5, eaau6060. https://doi.org/10.1126/sciadv.aau6060
Locarnini, R. A., Mishonov, A. V., Antonov, J. I., Boyer, T. P., Garcia, H. E., Baranova, O. K., et al. (2013). Temperature. In S. Levitus & A. V.
Mishonov (Eds.),World Ocean Atlas 2013(Vol.1, pp. 1–27). Silver Spring, MD: NOAA.
Lohmann, G. P. (1995). A model for variation in the chemistry of planktonic foraminifera due to secondary calcification and selective dissolution.Paleoceanography,10(3), 445–457. https://doi.org/10.1029/95PA00059
Lunt, D. J., Haywood, A., Foster, G. L., & Stone, E. J. (2009). The Arctic cryosphere in the Mid‐Pliocene and the future.Philosophical Transactions of the Royal Society,367(1886), 49–67. https://doi.org/10.1098/rsta.2008.0218
Lunt, D. J., Valdes, P. J., Haywood, A., & Rutt, I. C. (2007). Closure of the Panama Seaway during the Pliocene: Implications for climate and Northern Hemisphere glaciation.Climate Dynamics,30(1), 1–18. https://doi.org/10.1007/s00382‐007‐0265‐6
Lynch‐Stieglitz, J., Polissar, P. J., Jacobel, A. W., Hovan, S. A., Pockalny, R. A., Lyle, M., et al. (2015). Glacial‐interglacial changes in central tropical Pacific surface seawater property gradients.Paleoceanography,30, 423–438. https://doi.org/10.1002/2014PA002746 McClymont, E. L., Elmore, A. C., Kender, S., Leng, M. J., Greaves, M., & Elderfield, H. (2016). Pliocene‐Pleistocene evolution of sea surface
and intermediate water temperatures from the southwest Pacific.Paleoceanography,31, 895–913. https://doi.org/10.1002/2016PA002954 McGee, D., Donohoe, A., Marshall, J., & Ferreira, D. (2014). Changes in ITCZ location and cross‐equatorial heat transport at the Last
Glacial Maximum, Heinrich Stadial 1, and the mid‐Holocene.Earth and Planetary Science Letters,390, 69–79. https://doi.org/10.1016/j.
epsl.2013.12.043
McPhaden, M. J., Zebiak, S. E., & Glantz, M. H. (2006). ENSO as an integrating concept in Earth science.Science,314(5806), 1740–1745.
https://doi.org/10.1126/science.1132588
Meschede, M., & Barckhausen, U. (2000). Plate tectonic evolution of the Cocos‐Nazca spreading center.Proceeding of the Ocean Drilling Program, Scientific Results,170, 1–10. https://doi.org/10.2973/odp.proc.sr.170.009
Miller, K. G., Raymo, M. E., Browning, J. V., Rosenthal, Y., & Wright, J. D. (2019). Peak sea level during the warm Pliocene: Errors, lim- itations, and constraints.PAGES Magazine,27(1), 1–2.
Mix, A. C., Tiedemann, R., & Blum, P. (2003a). Leg 202 summary.Proceedings of the Ocean Drilling Program, Initial Reports,202, 1–145.
Mix, A. C., Tiedemann, R., & Blum, P. (2003b). Site 1236.Proceedings of the Ocean Drilling Program, Initial Reports,202, 1–74.
Pagani, M., Liu, Z., LaRiviere, J., & Ravelo, A. C. (2010). High Earth‐system climate sensitivity determined from Pliocene carbon dioxide concentrations.Nature Geoscience,3(1), 27–30. https://doi.org/10.1038/ngeo724
Paillard, D., Labeyrie, L., & Yiou, P. (1996). Macintosh program performs time‐series analysis.Eos, Transactions of the American Geophysical Union,77(39), 379. https://doi.org/10.1029/96EO00259
Pena, L. D., Goldstein, S. L., Hemming, S. R., Jones, K. M., Calvo, E., Pelejero, C., & Cacho, I. (2013). Rapid changes in meridional advection of Southern Ocean intermediate waters to the tropical Pacific during the last 30 kyr.Earth and Planetary Science Letters,368, 20–32.
https://doi.org/10.1016/j.epsl.2013.02.028
Philander, S. G., & Fedorov, A. V. (2003a). Is El Niño sporadic or cyclic?Annual Review of Earth and Planetary Sciences,31(1), 579–594.
https://doi.org/10.1146/annurev.earth.31.100901.141255
Philander, S. G., & Fedorov, A. V. (2003b). Role of tropics in changing the response to Milankovich forcing some three million years ago.
Paleoceanography,18(2), 1045. https://doi.org/10.1029/2002PA000837
Raddatz, J., Nürnberg, D., Tiedemann, R., & Rippert, N. (2017). Southeastern marginal West Pacific Warm Pool sea‐surface and thermo- cline dynamics during the Pleistocene (2.5–0.5 Ma).Palaeogeography, Palaeoclimatology, Palaeoecology,471, 144–156. https://doi.org/
10.1016/j.palaeo.2017.01.024