https://doi.org/10.5194/se-10-725-2019
© Author(s) 2019. This work is distributed under the Creative Commons Attribution 4.0 License.
On the link between Earth tides and volcanic degassing
Florian Dinger1,2, Stefan Bredemeyer3,4, Santiago Arellano5, Nicole Bobrowski1,2, Ulrich Platt1,2, and Thomas Wagner1
1Max Planck Institute for Chemistry, Mainz, Germany
2Institute of Environmental Physics, University of Heidelberg, Heidelberg, Germany
3GEOMAR, Kiel, Germany
4GFZ, Potsdam, Germany
5Department of Space, Earth and Environment, Chalmers University of Technology, Gothenburg, Sweden Correspondence:Florian Dinger (fdinger@iup.uni-heidelberg.de)
Received: 21 January 2019 – Discussion started: 12 February 2019
Revised: 15 April 2019 – Accepted: 27 April 2019 – Published: 29 May 2019
Abstract. Long-term measurements of volcanic gas emis- sions conducted during the last decade suggest that under certain conditions the magnitude or chemical composition of volcanic emissions exhibits periodic variations with a period of about 2 weeks. A possible cause of such a periodicity can be attributed to the Earth tidal potential. The phenomenol- ogy of such a link has been debated for long, but no quanti- tative model has yet been proposed. The aim of this paper is to elucidate whether a causal link between tidal forcing and variations in volcanic degassing can be traced analytically.
We model the response of a simplified magmatic system to the local tidal gravity variations and derive a periodical verti- cal magma displacement in the conduit with an amplitude of 0.1–1 m, depending on the geometry and physical state of the magmatic system. We find that while the tide-induced verti- cal magma displacement presumably has no significant direct effect on the volatile solubility, the differential magma flow across the radial conduit profile may result in a significant increase in the bubble coalescence rate at a depth of several kilometres by up to several multiples of 10 %. Because bub- ble coalescence facilitates separation of gas from magma and thus enhances volatile degassing, we argue that the derived tidal variation may propagate to a manifestation of varying volcanic degassing behaviour. The presented model provides a first basic framework which establishes an analytical un- derstanding of the link between the Earth tides and volcanic degassing.
1 Introduction
Residual gravitational forces of the Moon and the Sun de- form the Earth’s surface and interior periodically and thus lead to the so-called Earth tides. The tidal potential can be modelled as the result of the interference of an infinite num- ber of sinusoidal tidal harmonics with precisely known fre- quencies and amplitudes (Darwin, 1883; Doodson, 1921). At the Equator, the tidal potential varies predominantly with a semi-diurnal periodicity. The amplitude of the semi-diurnal cycle is modulated within the so-called spring–neap tide cy- cle with a periodicity of 14.8 d caused by the interference of the lunar semi-diurnal tide and the solar semi-diurnal tide.
The peak-to-peak amplitude of the associated semi-diurnal gravity variations is aastrost =2.4 µm s−2 during spring tide andaastront =0.9 µm s−2 during neap tide and is at an inter- mediate level at other times of the cycle. At midlatitudes, the tidal potential varies predominantly with diurnal periodicity, and at other latitudes both periodicities mix. The spring–neap tide cycle is, however, manifested everywhere and has max- imum variability at the Equator (Agnew, 2007). The tidal potential firstly gives rise to a periodical elevation of the Earth’s crust with a semi-diurnal peak-to-peak variation of up to about 50 cm (maximum at the Equator), and secondly all crustal compartments exhibit an additional semi-diurnal gravity variation by up to 1.16·astastro(Harrison et al., 1963;
Baker, 1984). This gravity variation typically has no effect on the rigid solid crust but can cause fluid movement, e.g.
prominently manifested in the form of ocean tides (Ponchaut et al., 2001).
Evidence for tidal impacts on volcanism has been gath- ered by numerous empirical studies, which detected a tem- poral proximity between tidal extrema and volcanic erup- tions (Johnston and Mauk, 1972; Hamilton, 1973; Dzurisin, 1980) or seismic events (McNutt and Beavan, 1981, 1984;
Ide et al., 2016; Petrosino et al., 2018) or found a correlation between the spring–neap tide cycle and variations in volcanic deformation (De Mendoca Dias, 1962; Berrino and Corrado, 1991) or variations in the volcanic gas emissions.
The tide-induced stress variations (∼0.1–10 kPa) appear to be negligibly small in comparison to tectonic stresses (∼1–100 MPa) or stresses caused by pressure and tempera- ture gradients within a shallow magmatic system(∼1 MPa).
The rate of tidal stress change can, however, be around 1 kPa h−1 and thus potentially exceeds stress rates of the other processes by 1 to 2 orders of magnitude (Sparks, 1981;
Emter, 1997; Sottili et al., 2007). Furthermore, these subtle stress variations may cause an amplified volcanic reaction, when, for example, the tidal variations cause a widening of tectonic structures (Patanè et al., 1994), a periodic decom- pression of the host rock (Sottili et al., 2007; Sottili and Palladino, 2012), a variation in the host rock permeability (Bower, 1983; Elkhoury et al., 2006; Manga et al., 2012), self-sealing of hydrothermal fractures (Cigolini et al., 2009), or a mechanical excitation of the uppermost magmatic gas phase (Girona et al., 2018).
First studies on the covariations in tidal patterns and vol- canic gas emissions hypothesised a possible tidal impact on the observed sulfur dioxide (SO2) emission fluxes at Masaya (Stoiber et al., 1986) and Kilauea (Connor et al., 1988). Since the 2000s, automatic scanning networks based on UV spec- trometers (e.g. Galle et al., 2010) have provided multi-year time series of volcanic gas emissions of SO2 and bromine monoxide (BrO). The availability of such data sets enabled extensive investigation of long-term degassing variations.
Correlation with the long-term tidal patterns has been re- ported for the SO2emission fluxes of Villarrica and Llaima (Bredemeyer and Hansteen, 2014) and the BrO/SO2molar ratios in the gas plume of Cotopaxi (Dinger et al., 2018).
Another possible but less significant correlation has been re- ported for the SO2emission fluxes of Turrialba (with a pe- riodicity somewhere between 9.1 and 16.7 d; Conde et al., 2014). Furthermore, Lopez et al. (2013) reported a period- icity of roughly 16 d in the SO2emission fluxes of Redoubt retrieved from the satellite-based Ozone Monitoring Instru- ment (OMI) – the authors proposed that this periodicity was, however, an artefact of the satellite orbit rather than a tidal signal. In addition, correlation with the long-term tidal pat- terns have been reported for the diffuse radon degassing of Terceira (Aumento, 2002) and Stromboli (Cigolini et al., 2009).
Cycles in volcanic degassing patterns are not unique to periodicities which match the tidal potential. Many studies reported periodic volcanic degassing patterns with periods of minutes (e.g. Fischer et al., 2002; Boichu et al., 2010;
Campion et al., 2012, 2018; Tamburello et al., 2013; Pering et al., 2014; Ilanko et al., 2015; Moussallam et al., 2017; Bani et al., 2017). In contrast, observations of long-term periodici- ties are rare. Besides the above-mentioned, roughly biweekly periodicities, periodic long-term pattern with periodicities of 50 and 55 d have been observed in the SO2emission flux of Soufrière Hills (Nicholson et al., 2013) and Plosky Tolbachik (Telling et al., 2015), respectively.
In view of the growing number of studies revealing simi- lar biweekly patterns in volcanic activity, this paper investi- gates whether causality between the tidal potential and vari- ations in the volcanic degassing is analytically traceable in a comprehensible way. High-temperature gas emissions of persistently strong, passively degassing volcanic systems are commonly thought to be fed by sustained magma convec- tion reaching the uppermost portions of the volcanic conduit, where volatile-rich low-viscosity magma ascends through essentially degassed magma of higher viscosity, which in turn descends at the outer annulus of the conduit (Kazahaya et al., 1994; Palma et al., 2011; Beckett et al., 2014). Magma ascent rates associated with such convective flow typically vary roughly between 1 and 100 m h−1(Cassidy et al., 2015, 2018) and thus are orders of magnitudes larger than what we can derive for potentially tide-induced vertical magma dis- placement rates of at most 0.6 m within 6 h (if not further amplified). A comprehensive model of the tidal impact on the magma motion thus requires a coupling of the convective and the tide-induced transport mechanisms.
Our conceptual model aims to provide the first step by investigating the purely tide-induced transport mechanism acting on the low-viscosity inner magma column, neglect- ing any interference between the magma ascent and the tidal mechanism, i.e. the model ignores the magma convection in the column. We model the response of such a quasi-static magmatic system (volcanic conduit connected to a later- ally more extended deeper magma reservoir) to tide-induced gravity variations analogously to the response of a classi- cal mercury thermometer to temperature variations: the tide drives a periodical expansion of the magma in the reservoir, which leads to a periodical vertical displacement of the low- viscosity magma column in the conduit.
We derive the temporal evolution and amplitude of the vertical magma displacement across the radial conduit pro- file and examine its impact on the bubble coalescence rate.
In order to introduce our novel approach comprehensibly, the modelled processes and conditions are as simplified as suitable; the major simplifications are listed in Appendix A.
All findings in this paper are derived analytically. The quan- titative model estimates are presented for two exemplary magmatic systems. These examples are intended to match simplified versions of the Villarrica (39.5◦S) and Cotopaxi (0.7◦S) volcanoes, where covariation between outgassing ac- tivity and Earth tidal movements has been observed previ- ously (Bredemeyer and Hansteen, 2014; Dinger et al., 2018).
The associated model parameter sets are listed in Table 1.
Further, all quantitative estimates are presented for the spring tide, and the consequences of the contrast between spring tide and neap tide are discussed in the last part of this paper.
2 Tide-induced magma displacement in the conduit 2.1 Model set-up
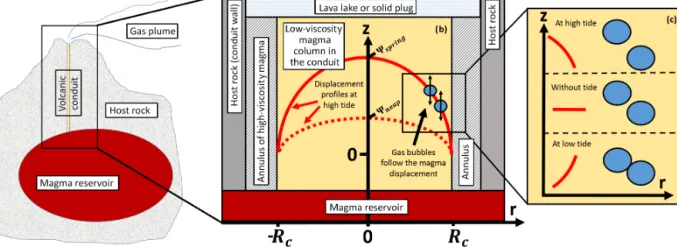
We model the magmatic system analogously to established convection models (Kazahaya et al., 1994; Palma et al., 2011;
Beckett et al., 2014), with the exception that the descending high-viscosity magma annulus is assumed to be not affected by the tide-induced dynamics and therefore is considered as an effective part of the host rock, while “conduit” refers in our model exclusively to the ascending low-viscosity magma column. We assume the conduit to be a vertically oriented cylinder with lengthLc, radiusRc, and cross-sectional area Ac=π·R2c, which is confined by the penetrated host rock (and high-viscosity magma annulus), connected to a deeper, laterally more extended magma reservoir with volumeVrand centre of mass at a depth Dr, and either exhibiting an open vent or capped by a gas-permeable solid plug (Fig. 1). The magmatic melt in the conduit is modelled as a mixture of a liquid phase and a gas phase having a mean density ρmelt, which varies with pressure and thus depth, a constant kine- matic bulk viscosityν, and homogeneous local flow proper- ties. The magma compressibilityβ(φ)strongly depends on the gas volume fractionφand lies between the compressibil- ityβ(0)=2·10−10Pa−1of volatile-rich rock and the com- pressibility β0(1)≈p−1 of an ideal gas (see, e.g., Tripoli et al., 2016). The magmatic melt in the reservoir is modelled to be volatile-rich but hosting no gas phase of significant vol- ume and thus having a constant compressibility βr≈β(0).
Further, the quasi-static condition implies a steady-state den- sity stratification within the magma and also with respect to the host rock (no neutral buoyancy; Parfitt et al., 1993). In this equilibrium, we assume a constant hydrostatic pressure gradient(∇p)vert.
2.2 Response of the host rock on tidal stresses
Magma pathways are often located at intersection points of large-scale fault systems (Nakamura, 1977; Takada, 1994) or in fault transfer zones (e.g. Gibbs, 1990), where the sur- rounding host rock geometry is relatively sensitive to direc- tional changes in pressure. The vertical and horizontal com- ponents of the tidal force exert additive shear tension on the host rock, potentially causing a compression of the host rock (Sottili et al., 2007) or a differential slip between both sides of the fault system (Ide et al., 2016). Both mechanisms can cause an increase in the areal conduit cross section. Con- nected to the magma reservoir, such an increasing conduit volume is accompanied by decompression and thus causes magma to flow from the reservoir to the conduit, which pushes the initial magma column in the conduit upwards un-
til the initial hydrostatic pressure gradient is re-established.
Vice versa a relative decrease in the areal conduit cross sec- tion leads to an effective descent of the initial magma col- umn in the conduit. For a given periodic area increase1Ac, the amplitude1zhrof this additive elevation-descent cycle of the centre of mass of the initial magma column is given by
1zhr=Lc
2 · 1Ac
Ac+1Ac ≈Lc 2 ·1Ac
Ac . (1)
The quantitative scale of tide-induced conduit cross section variations is presumably hardly accessible. The theoretical horizontal components of the tide-induced ground surface displacement are up to about ±7 cm (Baker, 1984). Slip- induced dilation of faults with widths in the sub-centimetre range thus appear to be plausible. For illustration, a con- duit radius increase by1Rc=1 mm would result in an ad- ditive vertical centre of mass displacement by1zhr=0.33 m for Villarrica and1zhr=0.13 m for Cotopaxi. As a remark, these mechanisms do not require a cylindrical conduit and fault–slip mechanisms would lead to an unidirectional area increase rather than a homogeneous radial increase. Further- more, the tide could also cause a variation in the host rock permeability (Bower, 1983; Elkhoury et al., 2006; Manga et al., 2012). This mechanism and its possible interference with the concept presented here are ignored in our model.
2.3 Tide-induced magma expansion in the reservoir The semi-diurnal tide causes a sinusoidal variation in the gravitational acceleration with angular frequency ωsd=1.5·10−4rad s−1and amplitude (equals the half peak- to-peak amplitude) a0st=1.4 µm s−2 during spring tide and a0nt=0.5 µm s−2 during neap tide. Besides those host rock mechanisms triggered by the tidal stresses, these tide- induced gravity variations may also cause a periodical ele- vation of the magma in the inner conduit.
The compressible magma in the reservoir is pressurised by the hydrostatic load whose weight is proportional to the local gravitational acceleration g. A reduction in the local gravitational acceleration bya0leads to a decompression and thus expansion of the magma in the reservoir by1Vr=a0
g · (∇p)vert·Dr·βr·Vr. The tidal force can accordingly lead to a periodical magma expansion–shrinkage cycle in the reservoir with a semi-diurnal periodicity and an amplitude modulation within the spring–neap tidal cycle of up to1Vr∼O(100–
1000 m3).
The realisation of this additional magma volume implies a displacement and thus compression of the host rock at the location of maximum host rock compressibility. This is typ- ically true for the conduit. Assuming that the magma expan- sion in the reservoir ultimately and exclusively causes an in- crease in the conduit volume, the volume increase causes an elevation of the centre of mass of the initial magma column
Figure 1.Panels(a)and(b): sketch of the model set-up. The model compartments are indicated by white boxes but not depicted to scale.
(b)The semi-diurnal tide causes a radial magma displacement profile in the conduit with different amplitudes during spring tide and neap tide.(c)Concept of the tide-enhanced bubble coalescence: two bubbles which are initially close to each other (see “without tide”) exhibit differential vertical tide-induced displacements, which enhances the chance for bubble coalescence (here “at low tide”).
in the conduit by 1zdec=1Vr
Ac
=a0
g ·(∇p)vert·Dr·βr· Vr
π·Rc2. (2) In the general case, the additional volume could be realised by a slight increase in the conduit radius by 1Rdec≈Rc
2 ·
1zdec
Lc ∼O(1 mm)caused, for example, by the tidal stresses.
If the magmatic system has an open vent, the additional vol- ume can alternatively be realised by an elevation of the lava lake level and thus without a host rock compression.
Analogously, the tide-induced gravity variations result in an expansion of the initial magma column in the conduit.
This effect is, however, typically negligible compared to the reservoir effect for sufficiently large reservoirs (volume con- trast between reservoir and conduit of more than 1000; see Table 1); thus, for simplicity we neglect the effect of the ex- pansion of the initial magma column in the conduit.
The responses of the overall magmatic system on the tidal stresses and tide-induced gravity variations act simul- taneously and in phase with the tidal force. The overall vertical tide-induced magma displacement in the conduit 1zmax can thus be larger then the individual mechanisms;
i.e.{1zhr, 1zdec} ≤1zmax< 1zhr+1zdec. In the following we focus on the reservoir expansion mechanism only in or- der to keep the derivation of the model parameters strictly analytical. The host rock mechanism is therefore reduced to establishing the required areal conduit cross section increase of1Rdec.
2.4 Radial flow profile in the conduit
The tide-induced vertical magma displacement in the conduit is delayed and extenuated by a viscosity-induced drag force.
We access the temporal evolution and amplitude of the tide- induced displacement via the force (per unit mass) balance
acting on the centre of mass of the magma column in the conduit:
inner force
z }| { γ· ˙z(t )
| {z }
drag force
=
external force
z }| {
a0·sin(ωsd·t )
| {z }
tidal force
− ω20·z(t )
| {z }
restoring force
− z(t )¨
|{z}
inertial force
, (3)
where the two model parameters are the bulk damping rate γ and the eigenfrequency ω0 of the magma column. The restoring force ensures that the centre of mass displace- ment tends towards the current “equilibrium” displacement associated with the current strength of the tidal force, i.e.
a0=ω20·1zmax. We further assume a Newtonian bulk drag force proportional to the flow velocity.
The continuity condition implies that the magma flows faster in the conduit centre than close to the boundary be- tween the low-viscosity and high-viscosity magma or host rock. Accordingly, we assume a no-slip condition at the con- duit boundaryr=Rcand derive the analytical solution of the tide-induced parabolic vertical displacement profilez(r, t )in the conduit:
z(r, t ) =9·
"
1− r
Rc
2#
·sin(ωsd·t−ϕ0)
9 = 2·a0
q
(ω20−ω2sd)2+(γ·ωsd)2 ϕ0 =arctan γ·ωsd
ω02−ω2sd
!
γ =8·ν Rc2 ω20 = a0
1zdec= g·π·Rc2 βr·Vr·Dr·(∇p)vert,
(4)
with the radial coordinate 0≤r≤Rc, the maximum vertical magma displacement amplitude9 (which equals twice the
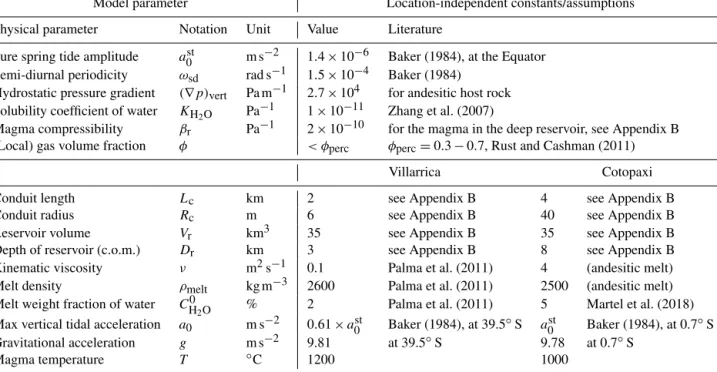
Table 1.Choice of model parameters, motivated by conditions at (1) Villarrica volcano located at 39.5◦S hosting a persistent lava lake of basaltic composition and (2) Cotopaxi volcano located at 0.7◦S, which preferentially erupts andesitic magma and intermittently is capped by a solid plug. If not stated otherwise, all numerical values in this paper are calculated with these parameters.
Model parameter Location-independent constants/assumptions
Physical parameter Notation Unit Value Literature
Pure spring tide amplitude a0st m s−2 1.4×10⁻⁶ Baker (1984), at the Equator Semi-diurnal periodicity ωsd rad s−1 1.5×10⁻⁴ Baker (1984)
Hydrostatic pressure gradient (∇p)vert Pa m−1 2.7×10⁴ for andesitic host rock Solubility coefficient of water KH2O Pa−1 1×10⁻¹¹ Zhang et al. (2007)
Magma compressibility βr Pa−1 2×10⁻¹⁰ for the magma in the deep reservoir, see Appendix B (Local) gas volume fraction φ < φperc φperc=0.3−0.7, Rust and Cashman (2011)
Villarrica Cotopaxi
Conduit length Lc km 2 see Appendix B 4 see Appendix B
Conduit radius Rc m 6 see Appendix B 40 see Appendix B
Reservoir volume Vr km3 35 see Appendix B 35 see Appendix B
Depth of reservoir (c.o.m.) Dr km 3 see Appendix B 8 see Appendix B
Kinematic viscosity ν m2s−1 0.1 Palma et al. (2011) 4 (andesitic melt)
Melt density ρmelt kg m−3 2600 Palma et al. (2011) 2500 (andesitic melt)
Melt weight fraction of water CH0
2O % 2 Palma et al. (2011) 5 Martel et al. (2018)
Max vertical tidal acceleration a0 m s−2 0.61×a0st Baker (1984), at 39.5◦S a0st Baker (1984), at 0.7◦S
Gravitational acceleration g m s−2 9.81 at 39.5◦S 9.78 at 0.7◦S
Magma temperature T ◦C 1200 1000
centre of mass displacement) and the phase shiftϕ0between tidal force and magma displacement in the conduit (see Ap- pendix C).
For Villarrica, the model implies a tidal displacement am- plitude of 9villst =0.45 m, which lags behind the tide by ϕ0,vill·ω−1sd =2.0 h, where the displacement is predominantly limited by drag force. For Cotopaxi, the tidal displacement amplitude is9cotost =0.09 m and lags byϕ0,coto·ω−1sd =0.2 h, where the displacement is predominantly limited by the restoring force. In comparison, the direct tide-induced grav- ity variations leads to a variation in the hydrostatic pressure of 10–100 Pa. In the context of the hydrostatic pressure gra- dient, this pressure variation has a similar effect as a vertical magma displacement by about 1 mm, thus rendering the di- rect tidal impact negligible compared to the indirect mecha- nism derived here.
3 Tide-enhanced bubble coalescence
Integrated over a semi-diurnal cycle, the tides do not re- sult in a net magma displacement. A link from tides to de- gassing thus requires tide-enhanced mechanisms which irre- versibly change the state of the magmatic gas phase. Bub- ble growth constitutes a predominantly exergonic and thus irreversible mechanism because the bubble surface tension inhibits or at least damps bubble shrinkage and dissolution (Prousevitch et al., 1993). Within a tide-induced radial dis-
placement profile, neighbouring gas bubbles can exhibit dif- ferential tide-induced vertical displacements potentially en- hancing the bubble coalescence rate (see Fig. 1c and Ap- pendix D). The variation in the bubble coalescence rate leads to bigger bubbles and thus the tide can indeed modify an ir- reversible mechanism.
In this section, we set up a simplified formalisation of the magmatic gas phase and the typically predominant mecha- nisms which govern the bubble coalescence rate and estimate the relative tide-induced enhancement of the bubble coales- cence by a comparison with these classical mechanisms. We consider a magma layer in the conduit at a particular depth;
accordingly, the parameters discussed in the following de- scribe the local conditions within a small volume of magma and should not be confused with the integrated bulk values for the total magma column. The variation in the tide-induced enhancement at different magma depths is discussed in the subsequent section.
3.1 Gas bubbles in magmatic melt
The dominant part of the magmatic volatile content is typi- cally water, followed by carbon dioxide, sulfur compounds, and minor contributions from a large number of trace gases such as halogen compounds (Oppenheimer et al., 2014). For simplicity, we assume that all macroscopic properties of the gas phase are dominated by the degassing of water, in par- ticular that the gas volume fractionφ exclusively consists
of water vapour. The volatile solubility of magmatic melts is primarily pressure dependent, with secondary dependen- cies on temperature, melt composition, and volatile specia- tion (Gonnermann and Manga, 2013). The pressure depen- dency of the water solubilityCH2Oin magmatic melt is given in a first approximation by CH2O(p)=p
KH2O·p with the corresponding solubility coefficientsKH2O(find an empirical formulation in Zhang et al., 2007). For the local gas volume fraction φ (p)at a depth associated with the pressurep, we obtain
φ (p)=ρmelt(p) ρgas(p) ·
CH0
2O−p
KH2O·p
(5) with the total water weight fraction CH0
2O of the magmatic melt and the mass densities of the gas phaseρgasand of the overall melt (liquid+gas)ρmelt.
The gas phase consists of separated bubbles as long as the gas volume fraction is below the percolation threshold ofφperc=0.3−0.7 (the variation is due to the range of dif- ferent magmatic conditions; Rust and Cashman, 2011). Bub- bles typically vary in size following a power law (Cashman and Marsh, 1988; Blower et al., 2003) or a mixed power-law exponential distribution (Le Gall and Pichavant, 2016) and in shape from spherical to ellipsoidal (Rust et al., 2003; Moitra et al., 2013). While models based on polydisperse bubble size distributions are available (Sahagian and Proussevitch, 1998;
Huber et al., 2013; Mancini et al., 2016), a common starting point to analyse the temporal evolution of the bubbles is nev- ertheless the assumption of a monodisperse size distribution of spherical bubbles (Prousevitch et al., 1993; Lensky et al., 2004).
We note the bubble size distribution δbsize(f ∈R+)with respect to the bubble radius (rather than the volume); i.e. the bubble radius is given by rb=f·Rb with the hypothetical bubble radius Rb(p)of a monodisperse bubble size distri- bution. An estimate of a power-law bubble size distribution would require three parameters: the exponent and the lower and upper truncation cut-off (Lovejoy et al., 2004). An esti- mate of a mixed power-law exponential bubble size distribu- tion would require at least two further parameters. The fol- lowing analysis is conducted for an arbitrary bubble size dis- tribution; nevertheless, for a basic quantitative estimate, we mimic a proper polydisperse bubble size distribution by the simpler single-parametric
eδbsize(f;q)=
1−q : f =1
q : f = 3
√
2, (6)
with 0≤q <12, which represents a monodisperse distribu- tion except for a fraction ofqbubbles which emerged from a past coalescence of two bubbles withf =1.
3.2 Bubble motion and bubble coalescence
Diffusion-driven volatile degassing can only take place in the immediate vicinity of a bubble and when the supersaturation
pressure is larger than the bubble surface tension (Prousse- vitch and Sahagian, 2005). The volatile degassing rate is thus controlled by the spatial bubble distribution as well as the bubble size distribution (Lensky et al., 2004). Both distribu- tions change during bubble rise, which is caused by a vertical ascent of the overall magma column or parcel with velocity vmelt and a superimposed bubble buoyancy with a velocity vbuoywhich reads for a bubble with radiusrb(Stoke’s law):
vbuoy(rb)=2·g·rb2 9·ν ·
1− ρgas ρmelt
≈2·g·rb2
9·ν . (7)
If the buoyancy velocity is negligible compared to the magma ascent, the bubble flow is called “dispersed”; if the bubble buoyancy velocity contributes significantly to the overall bubble ascent, the bubble flow is called “separated”
(Gonnermann and Manga, 2013). Rising bubbles grow con- tinuously because of (1) decompression and (2) the increas- ing volatile degassing rate due to the associated decreases in the magmatic volatile solubility and of the bubble surface tension. Bubble coalescence accelerates the bubble growth.
Bubble coalescence requires two bubble walls to touch and ultimately to merge. Once two bubbles are sufficiently close to each other, near-field processes such as capillary and grav- itational drainage cause a continuous reduction in the film thickness between the bubble walls until the bubbles merge after drainage times ranging from seconds to hours depend- ing on the magmatic conditions (Herd and Pinkerton, 1997;
Castro et al., 2012; Nguyen et al., 2013).
For small gas volume fractions, however, the initial dis- tance between bubbles is large compared to the bubble di- mensions and the coalescence rate is dominated by bubble transport mechanisms acting on longer length scales. Be- cause bubble diffusion is typically negligibly small, bubble walls can only approach when a particular mechanism leads to differential bubble rise velocities or by bubble growth. In magmas with a sufficiently separated bubble flow, two neigh- bouring bubbles of different size can approach each other vertically due to the differential buoyancy velocities (Manga and Stone, 1994; Lovejoy et al., 2004). In magmas with a dis- persed bubble flow, in contrast, the relative position of bubble centres remains fixed; thus, bubble coalescence is controlled by the bubble expansion rate caused by the ascent of the over- all magma column (or affected magma parcel).
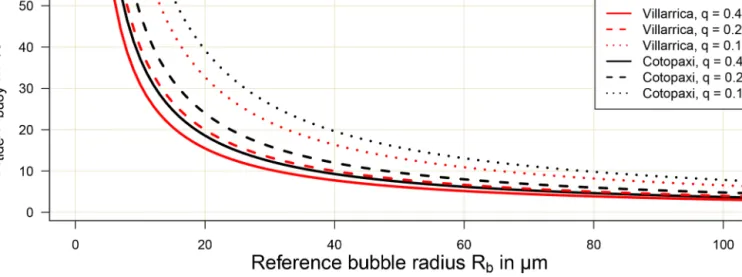
3.3 Comparison of bubble coalescence mechanism The proposed tide-induced bubble transport mechanism is compared in the following with the classically predominant bubble transport or approaching mechanisms in order to esti- mate the relative contribution of the tidal mechanism on the overall coalescence rate. We access the (absolute) strength of a particular transport mechanism by its “collision vol- ume”Hi(see Appendix D). The tidal mechanism is noted by Htide. For comprehensibility, we focus on a comparison of the tidal mechanisms with the two “end-member” scenarios
Figure 2.Relative contribution of the tidal mechanism (magnitude given byHtide) on the bubble coalescence rate for a purely separated bubble flow (magnitude given byHbuoy) depending on the reference bubble radiusRband the degree of polydispersityq. The reference bubble radius is reciprocally linked to the depth of the particular magma layer.
of a purely separated (Hbuoy) and a purely dispersed (Hdisp) bubble flow, respectively. A more comprehensive formula- tion of the classically predominant bubble transport or ap- proaching mechanisms has been proposed, e.g. by Mancini et al. (2016).
For a separated bubble flow, the relative tidal contribution on the bubble coalescence rate depends reciprocally on the reference bubble radiusRband on the degree of polydisper- sityq (Fig. 2). Forq=0.1−0.4, the tidal mechanism con- tributes at least 10 % to the overall bubble coalescence rate for a range of reference bubble radii ofRb=32–65 µm for Villarrica andRb=37–78 µm for Cotopaxi. For comparison, Le Gall and Pichavant (2016) obtained from basalt decom- pression experiments mean bubble radii of (at most, depend- ing on the volatile content) 23 µm for a pressure of 100 MPa (∼depth of 3.7 km) and of 80 µm for a pressure of 50 MPa (∼ depth of 1.9 km) and concluded an extensive bubble coales- cence rate at depth associated with 50–100 MPa. Similarly, Castro et al. (2012) obtained from rhyolite decompression experiments mean bubble radii of 15 µm for a pressure of 100 MPa (∼depth of 3.7 km) and of 30 µm for a pressure of 40 MPa (∼depth of 1.5 km). For andesitic magma, the de- pendency of the bubble size on the pressure is presumably between the values for the basaltic and the rhyolitic magma.
We conclude that the tidal mechanism can significantly con- tribute to the bubble coalescence rate in magma layers at a depth greater than 1 km, associated with bubble radii of 30–
80 µm. In contrast, the tidal contribution becomes negligible at shallow levels once the bubble radii are in the millimetre- range which corresponds to the bubble size range at which bubbles efficiently start to segregate from the surrounding melt.
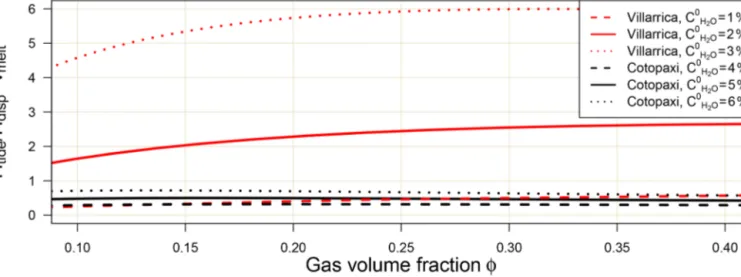
For a dispersed bubble flow, the relative tidal contribu- tion on the bubble coalescence rate depends reciprocally on
the magma ascent rate, hardly on the gas volume fractionφ, but it depends approximately linearly on the volatile content CH0
2O of the magma (Fig. 3). The tidal contribution causes an enhancement of the bubble coalescence rate equivalent to the enhancement caused by an increase in the magma as- cent velocity by about 0.5 m h−1for Cotopaxi and 2.5 m h−1 for Villarrica for theCH0
2O listed in Table 1. For compari- son, the magma ascent velocities in passively degassing vol- canic systems vary roughly between 1 and 100 m h−1(Cas- sidy et al., 2015, 2018). The tidal mechanism can accord- ingly contribute by at least several percent but potentially up to several multiples of 10% to the overall bubble coalescence rate. For gas volume fractions exceeding the minimum per- colation threshold of φperc≈0.3, the model assumption of independent spherical bubbles increasingly loses its validity.
4 Discussion and conclusions
Our model implies a tide-induced periodical vertical magma displacement in the conduit within every semi-diurnal cy- cle in the order of 0.1–1 m due to magma expansion in the reservoir. At Villarrica, the modelled vertical magma dis- placement of 0.45 m implies a periodic variation in the lava lake level (whose areal cross section is about 10 times larger than for the conduit; Goto and Johnson, 2011) of about 5 cm.
At Cotopaxi, the modelled vertical magma displacement of 0.09 m may apply additive stress on the solid plug.
We linked this magma displacement to bubble coalescence and compared the relative strength of the tide-induced bub- ble transport mechanism with respect to the classically pre- dominant bubble transport mechanisms in magmas hosting a purely separated or a purely dispersed bubble flow. For both scenarios, we found that the tidal contributions to the overall
Figure 3.Relative contribution of the tidal mechanism (magnitude given byHtide) on the bubble coalescence rate for a purely dispersed bubble flow (magnitude given byHdisp) depending on the gas volume fraction and the initial water weight fraction of the magmatic melt.
The corresponding values forφare calculated with Eq. (5) assuming an ideal gas and magma temperatures of 1200◦C for Villarrica and 1000◦C for Cotopaxi. The relative tidal contribution is displayed as the equivalent to an enhancement of the magma ascent rate, which would have the same effect on the bubble coalescence rate. The model increasingly loses validity above the percolation threshold ofφperc≈0.3.
bubble coalescence rate can be in the order of at least several percent up to several multiples of 10 % at a depth of several kilometres. At shallower depth, the direct tide-induced con- tribution to the overall bubble coalescence rate is rather neg- ligible because the classical transport mechanisms become more efficient.
The tide-enhanced bubble coalescence rate at greater depth can nevertheless affect the gas phase in the overlying shallower layer because the additionally coalesced bubbles have a larger buoyancy velocity as well as a reduced surface tension and can thus stimulate on the one hand enhanced volatile degassing from the melt phase to the gas phase and on the other hand enhanced bubble coalescence rates in overlying layers (Prousevitch et al., 1993). These enhance- ments can ultimately cause the percolation of the gas phase at a somewhat greater depth compared to the tide-free sce- nario. In consequence, the magma becomes gas-permeable at this greater depth potentially causing enhanced volcanic gas emissions (Rust and Cashman, 2011; Gonnermann et al., 2017). The additional contributions from this greater depth to the volcanic gas emissions may also slightly shift the chem- ical composition of the overall gas emissions towards the chemical composition of the gas phase at this greater depth when compared to the tide-free scenario (Burton et al., 2007).
The quantitative results have been derived for the tidal forcing during spring tide. In contrast, the amplitude of the tide-induced mechanism is smaller by a factor of 3 during neap tide. Accordingly, the amplitude of the additional tide- induced contributions to the coalescence rate varies within a spring–neap tide cycle entailing a periodical signal with a period of about 14.8 d superimposed on the (nevertheless po-
tentially much stronger) tide-independent coalescence rate.
For a dispersed bubble flow scenario with rather fast magma ascent, a propagation of this superimposed signal from the enhanced coalescence rate via a variation in the percolation depth to the volcanic gas emissions is comprehensible. For a separated bubble flow scenario, however, the gas bubbles may need much more time than one spring–neap tide cycle to rise from a depth of several kilometres to the percolation depth. Magmatic systems can, however, become permeable already at a depth of 1–3 km (Edmonds and Gerlach, 2007;
Burton et al., 2007), i.e. where the derived tidal effects are the strongest. In such a scenario, the tide-enhanced bubble co- alescence rate could accordingly cause enhanced degassing without a significant delay.
In a scenario with a shallower percolation depth, the pe- riodic pattern could nevertheless propagate to the degassing signal because several crucial parameters such as the mean bubble radiusRband the gas volume fractionφtypically vary rather monotonously with pressure and thus depth (Gonner- mann and Manga, 2013), implying a depth dependency of the relative tidal contributions to the bubble coalescence rate.
Convolved along the vertical conduit axis, the tide-enhanced coalescence rate may accordingly preserve an overall period- icity driven by the dominant contributions from those magma layers which are particularly sensitive to the tidal mecha- nism. Moreover, this pressure dependency implies that gas contributions originating from the particularly tide-sensitive depths are more pronounced in the subsequent volcanic gas emissions during spring tide. Therefore, tide-induced vari- ations in the chemical composition within the volcanic gas plumes may be particularly manifested in the relative mo-
lar degassing ratios (e.g. Burton et al., 2007; Bobrowski and Giuffrida, 2012; Balcone-Boissard et al., 2016) associated with these depths.
In conclusion, we traced a possible tidal impact from the tidal potential to a magma expansion in the reservoir, to a vertical magma displacement profile in the conduit, and to an enhanced bubble collision rate (and thus an enhanced co- alescence rate), and this ultimately motivated a link between the tide-enhanced bubble coalescence rate and the periodical signal in the observed volcanic gas emissions. Furthermore, illustrative quantitative calculations indicated that the pro- posed tide-induced mechanism could lead to an enhancement of the bubble coalescence rate by up to several multiples of 10%. If propagated from enhanced bubble coalescence to a variation in the magnitude or chemical composition of the volcanic gas emissions, a periodical spring tide signal would be large enough to explain the observed about 2-weekly vari- ations in volcanic gas emissions.
Nevertheless, our conceptual model only aimed at a proof of concept. Future studies may increase the complexity of the model by, e.g., (1) lifting several of our numerous simpli- fications (Appendix A), (2) incorporating macroscopic tidal mechanisms affecting the host rock explicitly, (3) adding sev- eral further microscopic mechanisms such as a tide-induced loosening of bubbles attached to the conduit walls or the tidal impact on crystal orientation, and (4) investigating possible non-linear interferences between the tide-induced dynamics and the tide-independent magma convection flow.
Data availability. No unpublished data are presented or used.
Appendix A: List of applied mayor simplifications In our model we applied several simplifications regarding the shape and physical properties of the magma plumbing system. This we did for the sake of clarity and, even more importantly, in order to isolate the tide-induced effect on magma flow and degassing. To achieve this, we (1) modelled the tide-induced magma flow in the conduit neglecting any tide-independent magma dynamics such as magma convec- tion, which implies an initial mechanical and thermodynamic equilibrium between magma and adjacent host rock. The only exception is the discussion of the impact of a constant magma ascent on the bubble coalescence rate. (2) The expan- sion of the initial conduit magma is neglected. We assume (3) a gas-tight host rock, (4) a cylindrical volcanic conduit, (5) a no-slip condition between conduit wall and magma, and (6) homogeneous magma flow properties. (7) The vis- cosity of the magma in the conduit is assessed by the effec- tive bulk viscosity. (8) The radial tide-induced magma dis- placement is neglected. Moreover, (9) bubble coalescence is modelled by bubble collision, neglecting near-field drainage processes, bubble deformation processes, and post-collision coalescence processes. (10) Simple bubble size distributions are chosen, and (11) it is assumed that the volcanic gas phase exclusively consists of water vapour.
Appendix B: Quantitative estimates for the geometrical model parameters
The conduit radius is a crucial model parameter. The upper- most 200 m of Villarrica’s conduit have frequently been ex- posed during the decades prior to the 2015 eruption due to pronounced oscillations of the lava lake level (Moussallam et al., 2016; Johnson et al., 2018b). The cross-sectional area of the conduit has a radius of about 30 m (Goto and Johnson, 2011), which at greater depths, however, narrows down to a mean radius of the order ofRc=6 m as is implied by stud- ies based on gas emission magnitudes (Palma et al., 2011) and seismoacoustic properties (Richardson et al., 2014). The active vent of Cotopaxi was capped by an area of hot ma- terial with a diameter of 116–120 m during the eruption in 2015 (Johnson et al., 2018a). Although missing an empiri- cal evidence, it is plausible that the mean conduit radius is somewhat narrower, and therefore we assume a (rather con- servative) value ofRc=40 m.
Depth and volume of the magma reservoir constitute fur- ther crucial model parameters whose empirical estimates come with an even larger uncertainty. Seismic observations conducted at Villarrica imply the existence of a shallow magma reservoir with a lateral diameter of at least 5 km and a vertical extent of about 2.5 km whose centre of mass is located at a depth of around Dr=3 km below the sum- mit (Mora-Stock, 2015), implying a conduit length of about Lc=2 km. Assuming an ellipsoidal magma reservoir, this
implies a magma reservoir volume of Vr=35 km3 at Vil- larrica. The magmatic system of Cotopaxi in contrast seems to be more complex and hosts a rather small magma pocket (2 km3) beneath the SW flank at a depth of about 4 km be- low the summit (Hickey et al., 2015). Furthermore, seis- mic observations revealed fluid movements (magma and/or hydrothermal fluids) within a centrally located 85 km3 col- umn spanning 2 to 14 km depth below the summit (Ruiz et al., 1998). This fluid column is assumed to connect the laterally offset shallow pocket with two much larger deeper magma reservoirs, which are situated between 7 and 11 km and somewhere at a depth greater than 16 km below the sum- mit (Arias et al., 2015; Mothes et al., 2017; Martel et al., 2018). For heating 85 km3of rock, these deep-seated magma reservoirs may be rather large. Missing any accurate volume estimate, we estimate that the upper of the two deep-seated reservoirs hosts a magma volume ofVr=35 km3with a cen- tre of mass depth ofDr=8 km. The choice of equal reservoir volumes for both Villarrica and Cotopaxi allows for a bet- ter comparison of the impact of varying the other volcanic parameters. Further, we assume the small magma pocket as the lower end of the conduit, i.e. with a conduit length of Lc=4 km.
Appendix C: Calculation of tide-induced conduit flow Oscillating centre of mass displacement. After a negligible settling time, the driven oscillator described by Eq. (3) oscil- lates with semi-diurnal periodicity, and we obtain the general long-term solution
z(t ) =z0·sin(ωsd·t−ϕ0)
z0 = a0
q
(ω20−ω2sd)2+(γ·ωsd)2 ϕ0 =arctan γ·ωsd
ω02−ω2sd
!
. (C1)
Navier–Stokes equation for periodical pipe flow. When ex- posed to a constant force (per unit mass)fext0, a viscous fluid in a cylindrical pipe with radiusRc flows with a parabolic velocity profilev0(r), 0≤r≤Rc:
v0(r)=R2c·fext0 4·ν
"
1− r
Rc 2#
. (C2)
When exposed to a periodically varying and thus time- dependent external force fext(t )=fext0 ·eiωt, the analytical solution of the flow profile is more complicated (Spurk, 1997):
v(r, t )=v0(r)· <
"
−i· 8 N2
·eiωt· 1−J0(
√
−i NRr
c) J0(
√
−i N )
!#
, (C3)
with the centre of mass velocity v0(r) of a constant forc- ing (see Eq. C2), the real part <[..], the imaginary unit i, the Bessel function J0(..), and the dimensionless parameter N =q
ω
ν·Rc. In the limitN→0, the velocity profile asymp- totically adopts the time dependency as well as the magni- tude of the external force. For N=1 the exact magnitude is already 0.98·fext0 , and the radial profile shows hardly any deviation from a parabolic profile. For the chosen model pa- rameters (Table 1) andω=ωsd, we obtainN≈0.2 and thus Eq. (C3) reduces in very good approximation to the familiar v(r, t )≈R2c·fext(t )
4·ν
"
1− r
Rc 2#
. (C4)
Derivation of the equation of motion (Eq. 4). The ver- tical velocity of the centre of mass can be obtained as z(t )˙ =z0·ωsd·cos(ωsd·t−ϕ0)from Eq. (C1) and asv(t )= (π·R2c)−1·RRc
0 v(r, t )·2π rdr=Rc2
8·ν·fext(t )from Eq. (C4).
Further, we know fext(t )=fint(t )=γ· ˙z(t ) from Eq. (3).
Applyingfext(t )to Eq. (C4) revealsγ=8·ν
R2c and ultimately the fully parameterised equation of motion in Eq. (4).
Appendix D: Calculation of the collision volumes As is common for most coalescence models (including those cited above), we consider spherical bubbles only. Two spher- ical bubbles with radiif1·Rbandf2·Rb(f1andf2drawn fromδsizeb (f )) collide as soon as the distance between their bubble centres isrcoal=(f1+f2)·Rb. We introduce the col- lision volume H (f1, f2;1t )associated with a bubble with radiusf1·Rbas the volume enclosing all possible initial lo- cations of the bubble centre of another bubble with radius f2·Rbsuch that both bubbles collide (and thus coalesce) at the latest after a time interval1t. All bubble collision mech- anisms are derived as enhancements of the initial static colli- sion volume
H0(f1, f2)=4π
3 ·Rb3·(f1+f2)3, (D1) and we consider only those bubble pairs which have not col- lided already in the initial state. The absolute enhancement of the collision volume due to a particular bubble collision mechanism divided by 1t thus gives the enhancement of the bubble collision rate contributed by the particular mech- anism. Because the tide-induced mechanisms are derived for a semi-diurnal cycle, the relative strengths of all coalescence mechanisms are compared with respect to this time interval 1tsd.
The collision volumes of the different collision mecha- nisms are all derived with the same approach: we fix the position of a bubble with arbitrary radiusf1·Rband derive H (f1, f2;1t )with respect to the relative motion of another bubble with arbitrary radius f2·Rb. In each case the initial
collision volumeH0(f1, f2)is subtracted either already tac- itly in the motivation or explicitly mathematically. Higher- order details such as the influence of a third bubble on the numeric results are ignored.
Tide-enhanced bubble collision volume. We fix the hori- zontal coordinates(r, ϕ)bubble1=(r0,0), 0≤r0≤Rc, of the first bubble, where the cylindrical symmetry of the conduit allows us to pick the azimuth angle without loss of general- ity and vary the horizontal coordinates(r, ϕ)bubble2=(r, ϕ) of a second bubbles. The horizontal distancehbetween the two bubbles is thus given byr2=r02−2·r0·h·cos(ϕ)+h2. Within a semi-diurnal cycle, the peak-to-peak differential tide-induced vertical displacement of two bubbles at the radial coordinates r and r0 is given by 1 ztide(r, r0)=2·
|z0(r)−z0(r0)| (see Eq. 4). The tide-induced collision vol- ume is then the integral of1ztide(r, r0)integrated over a cir- cle with radiusrcoal:
Htide(r0)=
rcoal
Z
0
dh h
2π
Z
0
dϕ 1ztide(r, r0) (D2)
=4·9·r0
R2c
rcoal
Z
0
dh h2
2π
Z
0
dϕ
cos(ϕ)− h 2r0
. (D3) This integral has to be split into two integrals at the angles where the sign of the absolute function changes, which is the case at±ϕ0= ±arccos(2hr
0)≈ ±π
2: Htide(r0)=16·9·r0
Rc2
rcoal
Z
0
dh h2
sin(ϕ0)−cos(ϕ0)·ϕ0
| {z }
≈1 forhr0
(D4)
≈16·9·r0
Rc2 ·rcoal3
3 (D5)
=4·9·r0
π·Rc2 ·H0(f1, f2). (D6) We integrateHtide(r0)over the local spatial bubble distribu- tion in the conduit in order to obtain the average effect. We parameterise the (isotropic) spatial bubble distribution by the depth-independentδbspatial(r0)=(1+α)·1
R·(rR0)α, which is a homogeneous distribution for α=1 but with all bubbles at the conduit wall ifα→ ∞, respectively. For the averaged tide-induced collision volume, we obtain
Htide=
R
Z
0
σtide(r0)·δbspatial(r0)·dr0 (D7)
= 1+α
2+α
| {z }
distribution
· 4·9
π·Rc
| {z }
tidal
·H0(f1, f2)
| {z }
scale
. (D8)
The “distribution term” is 23 for an isotropic bubble distri- bution and approaches unity if all bubbles are close to the
host rock. Arguably, the conditions for crystal nucleation and thus bubble nucleation are better close to the host rock where the magma is cooler and more crystals and thus nucleation possibilities are available. Following this reasoning but also because we want to examine the maximum possible tidal im- pact, we set the distribution term to unity. The “tidal term”
contains the information on the scale of the effective tide- induced impact. The “scale term” contains the information on the actual bubble size distribution, highlighting that the relative tidal enhancement is identical for any bubble size distribution, at least in our simple model.
Buoyancy-induced bubble collision volume. Two bubbles with radii f1·Rb6=f2·Rbhave a differential rise velocity 1vbuoy= |f22−f12| ·vbuoy(Rb), and thus their relative dis- tance changes during the rise. The two bubbles will collide if the larger bubble is below the smaller and if the horizontal distance between their bubble centres is at most rcoal. Ac- cordingly, the buoyancy-induced collision volumeHbuoyis a cylindrical volume with base areaπ·rcoal2 and cylinder length 1vbuoy·1tsd:
Hbuoy(f1, f2)=π·rcoal2 · |f22−f12| ·vbuoy(Rb)·1tsd (D9)
=3· |f2−f1|
4·Rb ·vbuoy(Rb)·1tsd·H0(f1, f2). (D10) For a given pair of bubbles with radii f1·Rb6=f2·Rb,f1
andf2drawn fromδbsize(f ), the ratio of the contribution from the tide-induced and the buoyancy-induced collision mecha- nisms is
Htide
Hbuoy
= 24·9·ν
π·Rc· |f1−f2| ·g·Rb·1tsd
. (D11)
The bulk ratio (with respect to the local magma layer) can be obtained by a previous and separate integration of Htide
andHbuoy overf1andf2 with respect to the actual bubble size distribution δsizeb (f )(rather than integrating Eq. D11).
For the explicit bubble size distributioneδsizeb from Eq. (6), we obtain the bulk collision volumesHetideandHebuoy,
Hetide(q)
H0(1,1)=(1+0.89·q+0.11·q2)· 4·9
π·Rc, (D12) Hebuoy(q)
H0(1,1) =(q−q2)· 9 16·Rb
·vbuoy(Rb)·1tsd, (D13) and thus the bulk ratio (used for the calculation of Fig. 2):
Hetide
Hebuoy
=60·
0.9+1+q2 q−q2
·ν[m2s−1] ·9[m]
Rc[m] ·Rb[µm] . (D14) Growth-induced bubble collision volume. In magma with a dispersed bubble flow (vbuoyvmelt), a rising bubble ex- hibits a pressure decrease rate of
1p
1t =vmelt·(∇p)vert. (D15)
Ignoring accompanying changes in secondary parameters such as melt temperature and magma composition and as- suming for simplicity a monodisperse bubble size distribu- tion (thusR3b∝φ), for the enhancement of the collision vol- ume due to a rise-driven pressure decrease by1pp0(ap- ply Eq. 5 on Eq. D1), we obtain
Hdisp(1p;p0)=H0(Rb(p0−1p))−H0(Rb(p0))
=H0(1,1)·CH0
2O−1
2
pKH2O·p0 CH0
2O−p
KH2O·p0
·1p p0
+O 1p
p0 2
, (D16)
where we assume thatρmeltis constant andρgasfollows the ideal gas law. Inserting Eq. (D15) in Eq. (D16), we obtain Hdisp(p0)
H0(1,1) =CH0
2O−1
2
pKH2O·p0
CH0
2O−p
KH2O·p0
·vmelt·1tsd·(∇p)vert
p0
. (D17)
The ratio of the contribution from the tide-induced and the growth-induced collision mechanism (used for the calcula- tion of Fig. 3) is
Htide Hdisp = C0H
2O−p
KH2O·p0
CH0
2O−1
2
pKH2O·p0
| {z }
≈0.25−0.5
· 4·9[m] ·p0[MPa] Rc[m] ·vmelt[m h−1].
(D18)