Practical at Sea: M. Sc. Advanced Course in Biological Oceanography
AL523.2
(GPF 19-1_127)
01.07. – 03.07.2019
Kiel (Germany) – Kiel (Germany) BiolOcPrac
Authors:
Theresa Barthelmeß,
Dr. Alexandra Loginova, Dr. Julia Grosse and Prof. Dr. Anja Engel
Chief Scientist:
Prof. Dr. Anja Engel
GEOMAR | Helmholtz Centre for Ocean Research Kiel Düsternbrooker Weg 20
24105 Kiel Tel.: (0431) 600 1510 Fax: (0431) 600 4446 E-Mail: aengel@geomar.de
2019
Table of Content
1.1 Summary in English ... 3
1.2 Zusammenfassung ... 3
2 Participants ... 4
2.1 Principal Investigators ... 4
2.2 Scientific Party ... 4
2.3 Participating Institutions ... 4
2.4 Crew ... 4
3 Report ... 5
3.1 Description of the Work Area ... 5
3.2 Aims of the Cruise ... 6
4 Narrative of the Cruise ... 7
5 Preliminary Results... 8
5.1 Water column profiles (data provided by Anja Engel) ... 8
5.2 Particle distribution (data provided by Anabel von Jackowski) ... 8
5.3 CDOM and FDOM (data provided by Alexandra Loginova) ... 10
5.5 Oxygen and nutrients (data provided by Julia Grosse and Helmke Hepach) ... 12
5.4 Surface activity (data provided by Theresa Barthelmeß) ... 14
5.4 Incubation experiments on community traits ... 16
6 Station List AL523.2 ... 18
6.1 Overall Station List... 18
6.2 Sampling list ... 19
7 Data, Sample Storage and Availability ... 20
8 Acknowledgements... 20
9 References ... 20
10 Appendices ... 22
10.1 Selected Pictures of Shipboard Operations ... 22
1 Cruise Summary
1.1 Summary in English
The aim of the three-days long AL523.2 cruise was the training of the Master students of the course Biological Oceanography at cruise preparation and field work on board a research vessel.
A diverse station plan should provide the opportunity to test the influence of terrestrial versus marine derived organic natter on several parameters. The focus was set on the sea surface microlayer (SML) and the influence of the further propagating eutrophication in coastal regions.
The analysis of organic matter (OM) cycling included the distribution and abiotic formation pattern of gel particles, optical properties of the samples and measurements of surface activity.
Moreover, community activity was assessed as the living sink for accumulated OM. For example, oxygen production and respiration was monitored during incubation. Water column profiling visualized intense stratification, as anticipated for this season. Conclusively, a rather diverse picture emerged showing not only the terrestrial versus marine influence and thus possible linkages of OM cycling to coastal eutrophication but further day/night variability in assessed parameters.
1.2 Zusammenfassung
Das Ziel der drei tägigen Ausfahrt AL523.2 war das Training von Master Studierenden des Kurses „Biologische Ozeanographie“ in der Vorbereitung einer Ausfahrt und der Arbeit an Bord unter realen Expeditionsbedingungen. Ein möglichst diverser Stationsplan von Boknis Eck bis in die Geltinger Birk sollte den Einfluss organischen Materials (OM) sowohl marinen als auch terrestrischen Ursprungs auf verschiedene Parameter untersuchen. Der Fokus der Ausfahrt richtete sich auf den Oberflächenfilm (SML) und den Einfluss der immer weiter fortschreitenden Eutrophierung küstennaher Gebiete. Die Analyse des OM Kreislaufes beinhaltete sowohl die Verteilung als auch die abiotische Formation von Gel-Partikeln, optische Eigenschaften des Materials und Oberflächenaktivität der Proben. Des Weiteren wurden Bakterio- und Phytoplankton Proben genommen, um die Aktivität der Gemeinschaft z.B. hinsichtlich der Sauerstoffproduktion und des Verbrauchs auf zu zeigen. Die Profile der Wassersäule gaben Aufschluss über die Schichtung verschiedener Wassermassen, welche wie erwartet im Sommer besonders ausgeprägt war. Abschließend zeichnete sich ein relativ diverses Bild ab, welches den terrestrischen und marinen Einfluss als auch eine gewisse tagesabhängige Variabilität des OM Kreislaufes widerspiegelte.
2 Participants
2.1 Principal Investigators
Name Institution
Prof. Dr. Engel, Anja GEOMAR
2.2 Scientific Party
Name Discipline Institution
Prof. Dr. Engel, Anja Biological Oceanography GEOMAR
Dr. Grosse, Julia Biological Oceanography GEOMAR
Dr. Loginova, Alexandra Biological Oceanography GEOMAR
Dr. Hepach, Helmke Biological Oceanography GEOMAR
M.Sc. Barthelmeß, Theresa Biological Oceanography GEOMAR M.Sc. von Jackowski, Anabel Biological Oceanography GEOMAR
Houvener, Jacob Student CAU
Shad, Hakeem Student CAU
Rohlfer, Eva Student CAU
Wallace, Alistair Student CAU
Chukwudi, Nwafor Student CAU
2.3 Participating Institutions
GEOMAR Helmholtz-Zentrum für Ozeanforschung Kiel CAU Christian-Albrechts-Universität zu Kiel
2.4 Crew
Name Rank
Petrikowski, Marc Captain
And Crew
3 Report
3.1 Description of the Work Area
Station 1 and 2
The Time Series Station Boknis Eck/Knoten (BE) (six standard depths: 1; 5, 10, 15, 20; 25 m) is located in a deep narrow channel in the southwestern Baltic Sea at the entrance of the Eckernförde Bay (54°31.2' N and 10°02.5'E). The hydrographic setting at BE is dominated by the seasonal in of saline North Sea water through the Kattegat and the Great Belt, where riverine input is of only minor importance (Weigelt 1990). Water masses are stratified in summer. During the autumn month, BE is often characterized by hypoxia at a depth of 15-25 m. The hydrographical settings of the station make it representative for large parts of the South-Western Baltic Sea (Lennartz et al. 2014).
In December 2016 a cabled underwater observatory was successfully deployed close to the BE Time Series site. The observatory sits in 14.5 m water depth and is equipped with several sensors to monitor the enviornmental setting at BE. The continuous in-situ data from the observatory complement the monthly sampling at BE and allow the detection of short-term trends and events.
Station 3 and 4
Schlei is a narrow fjord-like bay connected to the Baltic Sea by a narrow pathway. The water is brackish, as the area of terrestrial runoff is rather large, including e.g. the Füsinger Au. Schlei was shown to be largerly eutrophic, as agriculture and fabrics surround it (Nausch et al. 2011).
Station 5
To the south, Geltinger Bay (GB) borders to a protected natural area. This protected area includes salt-water inner lagoon-like structures (in German “Noor”). The Geltinger Noor has an opening to the Geltinger Bay, where water exchange may occur. Accumulated DOM in the lagoon due to leaching from “untouched” soils and forest, may thus serve an important source of DOM in the Geltinger Bay and, therefore, to the Baltic Sea.
Station 6
Western Baltic Sea station is located in the open sea, South of the North Sea sink. The station should represent the most open waters, where anthropogenic or terrestrial influence is marginal.
Therefore, one may expect the dominance of autochthonous processes, and typical characteristics of open Western Baltic Sea (WB).
3.2 Aims of the Cruise
The aim of the cruise was to train Master students in the program ‘M.Sc. Biological Oceanography’ in cruise preparation, including packing and the preparation and calculation of chemical solutions needed for the station work. The cruise should give them the opportunity to train advanced methods of sampling and measurements under the circumstances of on-board working. Apart from the didactical purpose, we aimed to conduct several pilot studies as elucidated in the following paragraphs.
The scientific goal was to explore the variability of organic matter cycling in a coastal to marginal ocean regime under the threat of anthropogenic pollution and the loom of climate change, manifested in e.g. eutrophication and increasing temperatures. The coastal Baltic Sea is especially influenced by freshwater inflow from the surrounding agricultural lands, carrying along high loads of nutrients and organic matter, leading ultimately to eutrophication of the marine environment although common efforts have considerably reduced pollution since the 70’ies (Lennarzt et al. 2014). Terrestrial influence should become visible when comparing estuaries and marine stations. Eutrophication provokes high primary production and consequently nurtures bacterial biomass causing hypoxia especially under summer stratification.
Organic matter production and reworking not only depends on the trophic prerequisites but also on the day/night cycle.
The separation of water bodies is governed by their salinity and temperature profile. Steep pycnoclines demark stratification of the water column where oxygen cannot be ventilated into subsurface waters, although the coastal areas of the Baltic Sea are very shallow. The light penetration depth further characterizes hydrological regimes. Abiotic conditions were carefully monitored to be able to interpret biogeochemical composition and plankton community structure.
The focus of research was directed on the comparison between organic matter cycling in the SML and the water column. Often, variations in the biochemical composition of seawater can be related to plankton composition and the physiological state of phytoplankton cells, which are the main source of organic matter. Coastal regimes, however, differ since terrestrial inflow of refractory DOM including humic substances contributes also a substantial part to the overall DOM pool.
The work on organic matter cycling included monitoring of substance distribution and formation e.g. gel particles or the abiotic DOM flocculation induced by a sudden change in salinity.
Therefore, two pilot studies were conducted. By bubbling, gel particles were expected to form by coagulation of precursors. Subsequently, the goal was to isolate the gel particles by magnetic interaction. The second study explored the possible abiotic effect of salinity gradients on substrate flocculation. These aggregates may rise towards the surface and accumulate in the SML, form colonies of intense bacterial reworking or ultimately transport organic matter into the deeper ocean and thus sequester carbon when burdened.
Quantifying the physicochemical effects of surface films and identifying compounds involved, remains a challenge and thus the linkages between SML biochemical composition and
physicochemical properties, such as surface activity, are hardly understood (Salter et al., 2011, Cuscov and Muller 2015). Therefore, the third pilot study assessed the influence of algal exudates and humic substances on surface activity. In the light of organic matter cycling these substances represent the labile, predominantly marine against the refractory, supposedly terrestrial derived pool of organic matter.
Little is known about organic matter processing in the SML and also in the marine system in general with regards to a changing ecosystem. Living organisms contribute actively to the cycling of the DOM pool by transporting fixed carbon up the ladder of trophic interaction by biomass built up, transforming it into refractory compounds or depleting it by net respiration.
The effectiveness and direction is shaped by the community structure. The notion that primary can be easily separated from secondary producers becomes more and more blurred, since phagotrophy is often supplemented by autotrophy and vice versa (Flynn et al. 2013). When considering future climate scenarios e.g. eutrophication, high bacterial biomass may be an advantage for nano-sized heterotrophic and mixotrophic organisms especially in coastal regimes and in the SML, where bacterial biomass can be high (Anderson et al. 2017). Therefore, the fourth pilot study aimed to assess mixotrophic consumption rates by a novel technique. The goal of the fifth study was to compare net community respiration within the SML and the water column. To our knowledge, studies in the SML on community respiration and grazing rates of mixotrophs are very rare if not lacking and are of special interest due to its properties as a surrogate between the ocean and atmosphere.
4 Narrative of the Cruise
The standard station program included a CTD profile and the collection of water samples at five to six different depths with the help of a rosette sampler. The SML was sampled by means of a screen sampler from board of a rubber boat.
01.07.2019
Starting at GEOMAR in Kiel (54.3°N, 10.1°E), the cruise track continued to the BE Time Series Station (54.5°N, 10.0°E), where a full water profile was taken, to be incorporated into the continuous time series. Moreover, the SML was sampled. To evaluate the newly installed sensor knot at the time series station (responsible person Dr. Hepach), specific further samples were taken of a full water profile in the afternoon of the first day.
02.07.2019
On the second day, full water profiles were conducted close to the entrance of the Schlei in the morning and the evening respectively. SML sampling was conducted in the Schlei estuary during CTD profiling. The SM stations were investigated to analyse day night cycling of organic matter and the discharge of nutrients due to intense terrestrial runoff and agriculture.
03.07.2019
On the third day, we sampled two stations in the Geltinger Bight (GB and WB), one in the morning and one at noon. Full water profiles were assessed at both stations while the SML was sampled in the morning only. These stations should help to get an idea of rather open ocean conditions.
5 Preliminary Results
5.1 Water column profiles (data provided by Anja Engel)
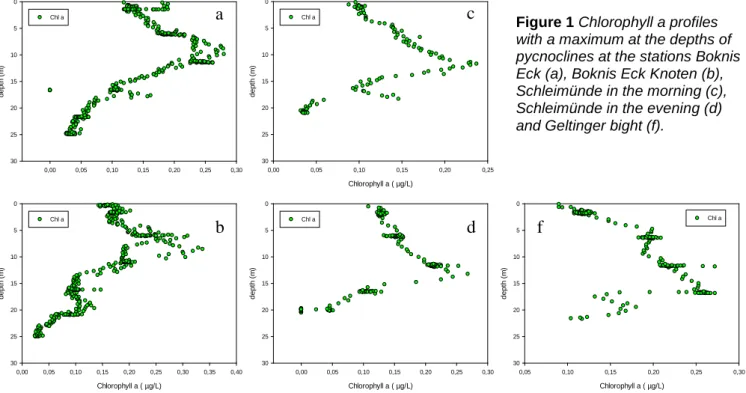
At all stations, water column profiles exhibited a steep decline respectively increase in temperature and salinity (Figure 1). At BE and Knoten with a maximal water depths of 28 m, pycnoclines evolved around 10 m. At SM, profiles looked rather similar throughout the day and established at an approximate depth of 12.5 m. The biggest difference was visible between the stations GB located inside of the bay and the rather open Baltic Sea off the coast since pycnoclines evolved at 10 m respectively 17 m depth although water depth increased only from 22 m to 24 m. Chlorophyll a maxima matched with the depths of pycnoclines and reached highest concentration at Boknis Eck Knoten with up to 0.35µg/L, while 1% of the incoming PAR light intensity was reached uniformly at around 10 m depth (station BE to SM PM). As expected, summer stratification was clearly visible within the water column profiles.
5.2 Particle distribution (data provided by Anabel von Jackowski)
Particle size distribution was assessed via Coulter Counter and is exemplarily discussed at Boknis Eck station only. Particles could be grouped into two dominating classes characterized by a size range between 0 and 10µm respectively 10 and 20µm while the second class contributed volume vice the most. These two classes were found in the SML and the water column similarly.
Particle volume declined with increasing depths (1 to 23m) from 0.02 to 0.002ppm. Especially high volumes were encountered within the SML with up to 0.032ppm.
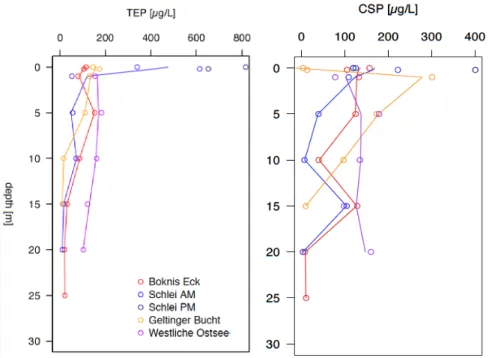
Polysaccharidic (TEP) and proteinoucious (CSP) gel particles differed considerably in their profiles. At the stations BE and GB TEP concentration was highest at 1m depth while at station BE and the rather open sea station WB, TEP maxima were reached at 5 m depth. The latest reached maximal TEP concentrations of 183±2µg/L. SM station was an exception since TEP maxima were located at 10m, coinciding with the pycnocline. In general, TEP concentrations
T (°C), S (psu)
6 8 10 12 14 16 18 20 22
depth (m)
0
5
10
15
20
25
30
Temperature Salinity
Station 3 (Knoten)
T (°C), S (psu)
6 8 10 12 14 16 18 20 22
depth (m)
0
5
10
15
20
25
30
Temperature Salinity
T (°C), S (psu)
6 8 10 12 14 16 18 20 22
depth (m)
0
5
10
15
20
25
30
Temperature Salinity
Station 6 (Schleimünde 4pm)
T (°C), S (psu)
6 8 10 12 14 16 18 20 22
depth (m)
0
5
10
15
20
25
30
Temperature Salinity
T (°C), S (psu)
6 8 10 12 14 16 18 20 22
depth (m)
0
5
10
15
20
25
30
Temperature Salinity
Station 10 (Tonne 2)
T (°C), S (psu)
10 12 14 16 18 20 22 24
depth (m)
0
5
10
15
20
25
30
Temperature Salinity
Figure 2 Temperature and salinity profiles of the water column varied in depths between the different stations Boknis Eck (a), Boknis Eck Knoten (b), Schleimünde in the morning (c), Schleimünde in the evening (d), Geltinger Birk (e) and Geltinger bight (f). The seasonal stratification of the water column is rather pronounced i.e. pycnoclines are clearly visible.
a
b
c
d
e
f
Chlorophyll a ( µg/L)
0,00 0,05 0,10 0,15 0,20 0,25 0,30
depth (m)
0
5
10
15
20
25
30 Chl a
Chlorophyll a ( µg/L)
0,00 0,05 0,10 0,15 0,20 0,25
depth (m)
0
5
10
15
20
25
30 Chl a
Chlorophyll a ( µg/L)
0,00 0,05 0,10 0,15 0,20 0,25 0,30
depth (m)
0
5
10
15
20
25
30 Chl a
Chlorophyll a ( µg/L)
0,00 0,05 0,10 0,15 0,20 0,25 0,30 0,35 0,40
depth (m)
0
5
10
15
20
25
30 Chl a
Chlorophyll a ( µg/L)
0,05 0,10 0,15 0,20 0,25 0,30
depth (m)
0
5
10
15
20
25
30
Chl a
a
b
c
d f
Figure 1 Chlorophyll a profiles with a maximum at the depths of pycnoclines at the stations Boknis Eck (a), Boknis Eck Knoten (b), Schleimünde in the morning (c), Schleimünde in the evening (d) and Geltinger bight (f).
reached its minima at bottom waters (BE 22±6µg/L) (Figure 3). For CSP, two concentration peaks existed, one above and one below the pycnocline. At BE and SM AM maximal concentration of the water column were reached at 1m depth and at GB this trend was maximized (301±12µg/L). GB CSP concentration declined steadily while SM AM and BE again reched a maximum at 15m depth. WB exhibited increased particle concentration at 5m and within bottom waters (20m) (Figure 3).
At four stations, gel particle concentrations were also assessed within the SML. At BE, TEP was slightly enriched (EF 1.1) while at GB, it was depleted (EF: 0.8). At SM, TEP concentration in the ULW stayed rather constant throughout the day (∼630±150µg/L) but within the SML, particle concentration more than doubled from 340±274 to 817±228µg/L. Therefore, gel particles in the SML were depleted in the morning (EF: 0.55) while being enriched in the evening (EF: 1.3). The opposite was true for CSP, the SML was depleted especially at SM PM (CSP AM EF: 0.6, PM EF: 0.3). Further, GB (EF: 0.3) was depleted, while at BE (EF 1.5) enrichment was high.
Conclusively, TEP seems to be produced or distributed in surface waters while separated CSP pools established above and below the pycnocline. This underlines the hypothesis that TEP is mainly derived from phytoplankton production (Cisternas-Nova et al. 2015) while CSP may origin from bacterial production or processing and therefor the segregation into two different water masses became apparent. For TEP, surface compression and dilatation could enhance gel particle formation as, especially during daytime (SM stations), TEP increased considerably within the SML (Wurl et al. 2011).
5.3 CDOM and FDOM (data provided by Alexandra Loginova)
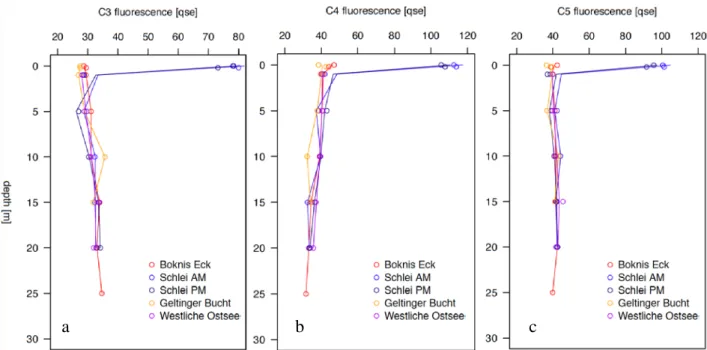
CDOM and FDOM was analysed by a spectrophometer at different wavelengths. The here discusses characteristics of the organic matter are based on fluorescence properties. Within the humik-like fraction of FDOM, component 3 is most likely of terrestrial origin (Coble 1996).
When excluding the SML samples of SM stations, humic-like substances increase slightly towards depth (Figure 4a). For both SM stations, there was a sudden increase in C3 above 1m
Figure 3 Gel particle distribution over the water column and in the SML (0 m depth) and ULW (0.02 m depth) at the different stations.
For the station Schlei in the afternoon only SML data are available.
depth, the signal more than doubled. At the stations BE, SM AM and WB the humic-like substances were equally distributed. However, at the evening station SM, the SML was slightly enriched in C3 (EF 1.1).
Component 4 was identified to belong to be the pool of protein-like, autochtonous material and consist of a tryptophan-like structure (Coble 1996). In contrast to C3, the signal of C4 declines slightly with depth and again is highly abundant in the SML at the Schlei stations (Figure 4b). In BE, the SML was slightly enriched (EF 1.1), at Schlei stations distribution was equal and at GB the SML was depleted (EF 0.9). The base of the euphotic zone should restrict autochtonous production and therefore higher concentration of labile, protein-like, organic matter should be encountered within surface waters.
Component 5 is classically attributed to microbial processing of organic matter within the marine environment (Coble 1996). For C5, contribution over the water column was monotonous (Figure 5). Again, a higher signal was observed for the SML in the Schlei. In BE, the SML was slightly enriched (EF 1.1), at Schlei stations distribution was equal and at GB the SML was depleted (EF 0.9). It was stated before, that this component was found within coastal waters and could be as well of terrestrial origin. It was argued that C5 should rather not serve as a marine marker (Murphy et al. 2008). This is also suggested in the limited scope of this study.
In general, at Schlei stations, SML concentrations of FDOM components were higher in the morning than in the evening, suggesting photo-bleaching after day-long exposure to sun light (Zhang et al 2009). The large difference between the signal in the SML and the water column is most likely due to the fact that the SML samples were collected from within the mouth of the fjord, were water depth was very shallow and the marine influence of the Baltic Sea reduced.
The Schlei is surrounded by agricultural land and its freshwater drainage is rather large, thus waters were expected to be enriched in terrestrial derived humic-like substances.
Figure 4 Distribution of FDOM over the water column. Three out of six components were exemplarily choosen. Components were determined by PARAFAC analysis. C3 is classically thought to be derived from terrestrial origin only (annotation “C”) and presents the humic fraction, while C4 represents the one of the protein-like, autochtonous produced classes (annotation “T”) and C5 is attributed to marine microbial organic matter cycling (annotation “M”) (after Coble 1996).
a b c
5.5 Oxygen and nutrients (data provided by Julia Grosse and Helmke Hepach)
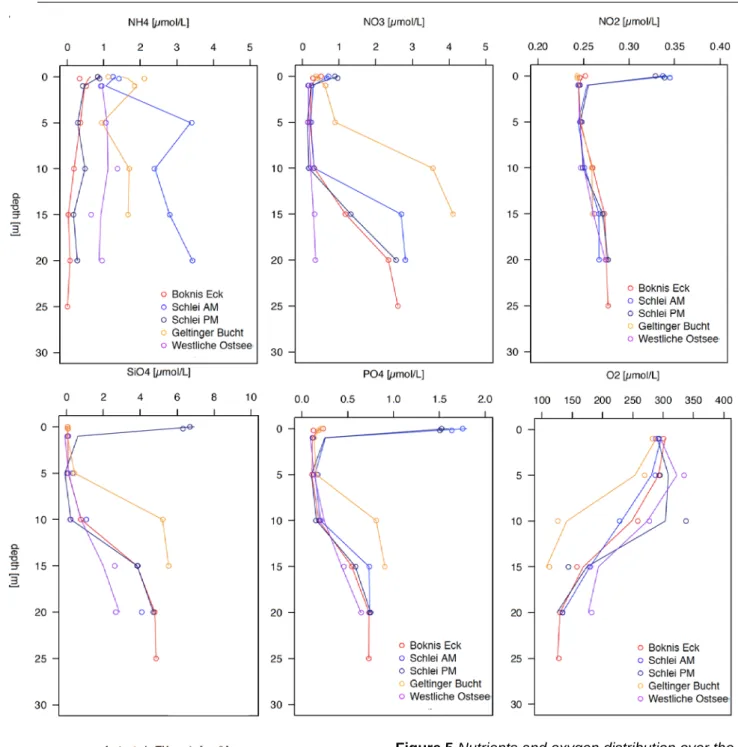
Nutrients and oxygen concentration were analysed by chemical conversion of the species and absorption or titration, respectively. Stations differed the most in ammonium concentrations. BE and SM PM exhibited constant low concentrations throughout the whole water column in the range of 0 to 1µM while the stations GB and WB showed somewhat higher variability and concentration profiles in the range of approximately 1 to 2µM. Interestingly, SM AM exhibited highest concentrations in ammonium although it was depleted during evening sampling (SM PM). The morning profile exhibited two maxima, one above and one below the pycnocline. The same differences were visible as well in the SML at SM. The day-night shift in concentration might depend on net bacterial mineralization of organic matter (ammonification) during night and assimilation during day.
For nitrate, WB exhibited the lowest concentration with no considerable change over the water column. Below 10m depth, at the stations BE, SM AM and PM the concentration increased by a factor of more than 10 to 2.5±0.1µM at 20m depth. The highest relative concentration was exhibited at the GB station, reaching its maxima in bottom waters (4.1±0.3µM) but concentration already increased considerably below 5m depth. For SM stations, nitrate concentrations were slightly elevated within the SML. At depth, increased net nitrification coincides with the end of the euphotic zone while stratification prevents the filled pool of nutrients to mix with surface waters to be used up.
Nitrite profiles increase slightly over depths (from app. 0.25 to 0.27µM) but overall did not exhibit considerable variability over stations. However, nitrite considerably differs in the uppermost surface waters at SM with mean concentrations around 0.34±0.003µM. This is surprising, since within nutrient cycling nitrite is further oxidized to nitrate. This process seems inhibited in the SML and ULW at SM stations. Within the pool of nitrogenous species, nitrite is the only component, which was considerably elevated in the SML at SM.
Silicate and phosphate profiles behave in a similar way and resemble the above described nitrate profiles. For the stations BE, SM and WB concentration increase below 10m depth while at GB, silicate and phosphate increased already below 5m depth. SM stations exhibited in relation to the other stations extremely high concentrations within the SML and ULW owing to terrestrial inflow at least in the case of phosphate (as reviewed by Lennartz et al. 2014). Below the euphotic layer, nutrients can accumulate after remineralisation and during summer stratification.
While nutrients increase with depths, oxygen concentrations mirrored nutrient profiles and decreased with depth. At surface waters, all stations were saturated in oxygen (even oversaturated when compared to atmospheric oxygen concentration as the calculation of apparent oxygen utilization has proposed) and exhibited a concentration of app. 290µM.
Variability increased with depth between stations and a sudden drop could be observed already below 5m depth at GB, while BE, SM and WB fell below surface values bat a depth of 10m. The end of the euphotic zone and intense stratification explains again the profiles. Notably, SM stations differed in their profiles as SM PM exhibited higher oxygen concentrations within the euphotic zone (10m: 292±1µM) than the morning station (SM AM 10m: 228±8µM) and thus matched the difference in nutrient concentrations in the course of day-long photosynthetic production. Photosynthetic production was further reflected in elevated TEP concentration at the evening station.
Figure 5 Nutrients and oxygen distribution over the water column at five different stations.
Figure 6 Surfactant concentration over the water column at Boknis Eck.
5.4 Surface activity (data provided by Theresa Barthelmeß)
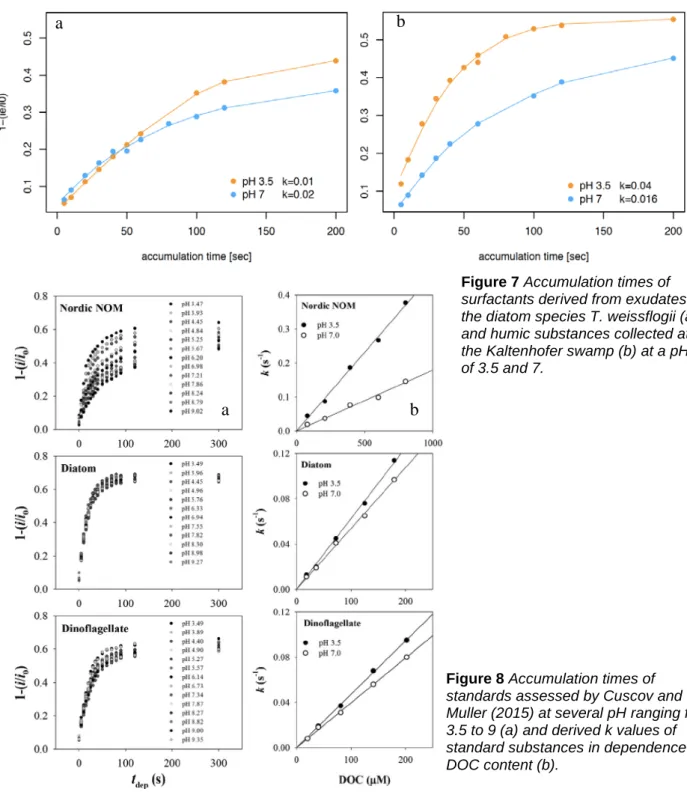
Surface activity of the SML and ULW was assessed at four stations by phase sensitive alternating voltammetry (Cosović and Vojvodić 1998). At BE, two CTD samples were further analysed to get an idea of the water column distribution. Moreover, a new method was tested to explore the sources of surfactants by measuring surface activity at 3.5 and 7pH (Cuscov and Muller 2015). As a proxy one can use the following rule: the smaller the difference between k’s, the higher the contribution of exudates to surface activity is, and vice versa, the larger the difference between k’s, the more humic substances are involved.
With regards to the water column, surfactant concentration increased from 0.34 to 0.37±0.02mg/L TX-100 equivalents in the ULW and SML (EF 1.1). At 10m depth, surfactant concentration was 0.3 while at 25m depth surfactant concentration measured 0.26±0.01mg/L mg/L TX-100 equivalents. The steepest decline in concentration could thus be observed near the
a b
Figure 7 Accumulation times of surfactants derived from exudates of the diatom species T. weissflogii (a) and humic substances collected at the Kaltenhofer swamp (b) at a pH of 3.5 and 7.
a b
Figure 8 Accumulation times of standards assessed by Cuscov and Muller (2015) at several pH ranging from 3.5 to 9 (a) and derived k values of standard substances in dependence of DOC content (b).
surface, as anticipated (Figure 6). Overall, surface activity in the ULW ranged from 0.34 at BE to 0.37mg/L TX-100 equiv. at SM PM. Surface activity in the SML exhibited stable values ranging from 0.37 (BE and SM AM) to 0.38mg/L TX-100 equiv. (GB). The SML at station SM PM, however, displayed the highest concentration measured during the cruise with 0.46mg/L TX-100 equiv. (EF 1.2). Calculated enrichment factors of stations not mentioned so far were 1.
To evaluate the new method, two standards were measured. An exudate standard was derived from a Thallassiosira weissflogii culture media, which has been diluted to a 60% dilution (surface activity: 0.22mg/L TX-100 equivalents). The humic substance standard has been collected in the Kaltenhofer swamp and, as pre-measurements had shown, exhibited extremely high surface activity. Therefor, a 3% dilution served as a first standard (surface activity:
0.32mg/L TX-100 equivalents). For the exudates, fluorescence measurements revealed a clear peak in the protein-like fraction, while the humic standard was very rich in humic-like peaks.
Both standards were assessed for accumulation properties (Figure 8) and in accordance with the authors Cuscov and Muller (2015), the differences at a pH of 3.5 and 7 of accumulation times were characteristic for exudates and humic substances (compare to figure 8a). The difference between k[3.5pH] and k[7pH] for humic substances and exudates in dependence of DOC has been shown to be divergent versus quite similar in its trend, respectively (Figure 8b). The following comparison of differences is not the quantitative approach suggested but since the organic carbon content of samples has not been analysed so far, a relative comparison of differences might reveal the potential of the method in categorizing the sources of surfactants. In general, the obtained half saturation constants k is in line with the values suggested by Cuscov and Muller (2015) (Figure 8b). When subtracting k [3.5pH] from k [7pH], the value obtained for the exudate standard is slightly negative (-0.010), while for humic substances it is positive (0.024).
In BE, the difference between k increased towards the surface, suggesting a relative higher contribution of humic substances to surface activity within the SML matching increasing surface activity (Table 1). In the morning, at the SM station, surface activity seems more likely dominated by humic substances but in the evening the differences in k slightly decreased suggesting a higher contribution of exudates to surface activity. This would match with the observed accumulation of polysaccharidic gel particles in the SML and also coincides with the highest surface activity measured during the cruise. ULW samples at SM suggested a constant higher contribution of humic substances. At GB, the difference in k’s was the smallest among assessed samples and suggested a higher contribution of exudates to surface activity. This time, however, it was not supported by the trend observed in the particulate gel fraction. The potentially higher contribution of marine derived exudates to the surfactant pool of GB station would be in accordance to the increased coastal distance.
The river water of the Schwentine (RW) has been assessed in its accumulation properties before the cruise in the morning and evening, respectively (RW d and RW n). As expected, high differences implied highest contribution of humic substances to surface activity in this terrestrial derived freshwater system. Conclusivley, and in accordance especially to RW samples, the comparison of k’s was variable among different stations and suggests that the method potentially reveals the influence of exudates and humic substances on surface activity. However, no convenient similarities were found between surfactant activity and optical properties of marine samples so far.
Table 1 Half saturation constant k of two different milieus (3.5 and 7 pH) derived from accumulation time properties of surface active substances at different stations. The difference between k’s suggest varying sources of surfactants i.e. small values suggest rather a marine, exudate origin while larger values suggest terrestrial, humic substance like origin.
5.4 Incubation experiments on community traits (data provided by Julia Grosse and Helmke Hepach)
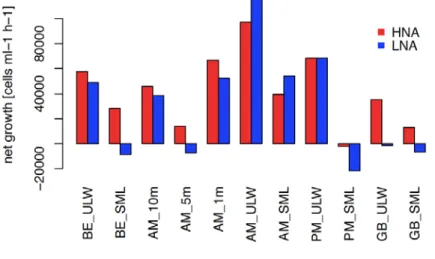
Prokaryotic and eukaryotic cell abundances were assessed by flow cytometry including a novel approach to quantify mixotrophic grazing of nano-sized cells (Gasol and Giorgio 2000, Anderson et al. 2017). Samples were taken preliminary within the SML and ULW but several depth of the water column of SM AM was further analysed. While stations within the Baltic Sea ranged in counts from 1502±220 x10^3 cells/ml (1m depth SM AM) to 2875±95 x10^3 cells/ml (SML GB), surface stations within the SM exhibited considerably higher numbers especially at the end of the day (SM PM; SML: 6659±135, ULW: 5263±802 x10^3 cells/ml). In accordance to the distribution of TEP particles, FDOM and several inorganic nutrients, this might reflect the eutrophic character of waters originating directly from rural, agricultural land.
Low nucleic acid content cells (LNA) dominated over the high nucleic acid content cells (HNA) in numbers by a factor of 1.2 to 2.9. Relatively, HNA contribution was always higher within the SML than the ULW implying higher activity of cells i.e. investment in repeated growth cycles (Servais et al. 2003). Strongest growth at SM AM corresponded to highest oxygen consumption rates during incubation experiments.
sample k 3.5pH [sec-1] k 7pH [sec-1] difference
EX_60 0,010 0,020 -0,010
HS_03 0,040 0,016 0,024
HS_01 0,007 0,007 0,001
BE_10m 0,046 0,020 0,026
BE_25m 0,041 0,020 0,021
BE_SML 0,066 0,027 0,039
BE_ULW 0,059 0,028 0,031
AM_SML 0,075 0,038 0,037
AM_ULW 0,078 0,033 0,045
PM_SML 0,086 0,054 0,032
PM_ULW 0,083 0,037 0,046
GB_SML 0,055 0,037 0,019
GB_ULW 0,051 0,034 0,017
RW_d 0,185 0,070 0,115
RW_n 0,167 0,061 0,105
Figure 9 Net bacterial growth after six hours of incubation divided into high and low nucleic acid content of cells (HNA and LNA).
Total bacterial enrichment in the SML was the highest in BE with 1.6 and the lowest at GB with 1.2. SM AM exhibited higher enrichment in the morning (EF 1.4) than in the evening (1.3) suggesting optimal growth conditions within the SML especially in late summer (Dreshinskii and Engel 2017).
However, bacterial growth was assessed after six hours of incubation and was remarkably lower within SML than ULW waters despite the proposed higher activity and benefits within the SML (compare figure 9). At BE, SM PM and GB, even a net loss in LNA cells was observed. A possible explanation could be the cut-off during incubation of an open, dynamic system (SML) from its underlying grounds (ULW) as bubble transport of nutritious particles and attached debris towards the surface would have been eliminated (Engel et al. 2017). Further, oxygen concentration might have decreased considerably faster in the SML than the ULW due to higher total abundances.
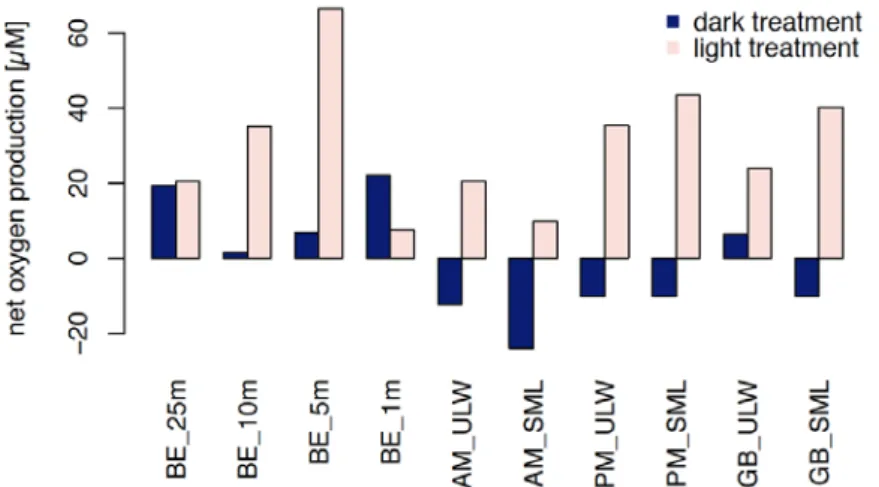
Oxygen production versus respiration of plankton community was monitored in the water column of BE and at the stations SM and GB in the SML and ULW. To restrict oxygen production by phytoplankton and monitor as well consumption, six hours of incubation were carried out not only in the light but in the dark. The net production of oxygen within the water column profile of BE followed roughly Chlorophyll a concentration, which was the lowest at depth and in the surface but concentrated its maxima around 10m depth. Curiously, the dark treatment triggered higher net oxygen production where Chl a concentration was lower (BE 1m:
22.1±25µM and BE 25m: 19.4±2µM). At 1m depth for the dark treatment, SD was larger than the actually measured change in oxygen as was the SD in the light treatment at 5m depth.
Striking was the increased net consumption rate in surface waters (dark treatment) in comparison to the water column profile (BE). Especially within the SML, respiration appeared elevated (SM AM and GB) in comparison to the ULW, fitting well the proposed higher activity of HNA cells and elevated bacterial abundances within the SML. Moreover, light treatment triggered elevated oxygen production at the stations SM PM and GB within the SML. However, the morning station of SM differed and exhibited comparably low oxygen production. Caution needs to be taken when interpreting the dark treatment of GB ULW, since SD was again higher as the actual effect. Organic matter quality and quantity as well as community structure and inorganic nutrients influence respiration (Robinson 2019). Higher respiration rates in the SML have been observed before (Reinthaler et al. 2008).
Phytoplankton community was differentiated according to size and the phytopigments Chlorophyll a and Pycoerythrin. The SML was dominated by Synechoccocus at BE and GB, while at SM stations pico-eukaryothes prevailed. Cryptophytes occurred only at BE and GB. The same trend was mirrored in the ULW although not that pronounced. Abundances were rather
Figure 10 Community oxygen production after six hours of incubation during light and dark treatment.
equally distributed. Class distribution reflected clearly a different community structure within SM than at the marine stations BE and GB, where the terrestrial influence was limited. Within the BE water column, the dominant fraction of Synechoccocus decreased at 25m along with the smaller fractions of Cryptophytes and nano-eukaryotes while in turn Cryptophytes increased in number (data not shown).
Mixotrophic grazing activity did not show any specific trend with regards to the SML and ULW nor the water column after a six-hour incubation period. In total, Cryptophytes and nano- eukaryote activity raised after incubation while Synechoccous grazing activity decreased (Figure 11). SM stations did not exhibit any changes in activity except for one: in the ULW nano- eukaryotes lost their grazing ability after six hours of incubation within the evening sample.
6 Station List AL523.2 6.1 Overall Station List
Station No. ID . Date Time Latitude Longitude Water Depth Device
ALKOR [ddmmyy] [h] [°N] [°W] [m]
AL523/2_9-2 WO 03.07.19 10:14:02 54° 42,221' N 010° 14,690' E 23.9 Lightmeter AL523/2_9-2 WO 03.07.19 10:07:19 54° 42,231' N 010° 14,705' E 23.8 Lightmeter AL523/2_9-1 WO 03.07.19 10:03:14 54° 42,242' N 010° 14,718' E 24.0 CTD AL523/2_9-1 WO 03.07.19 09:58:28 54° 42,249' N 010° 14,723' E 24.0 CTD AL523/2_8-3 GB 03.07.19 07:13:00 54° 47,395' N 009° 50,143' E 22.0 Lightmeter AL523/2_8-3 GB 03.07.19 07:04:33 54° 47,384' N 009° 50,245' E 22.0 Lightmeter AL523/2_8-2 GB 03.07.19 07:00:01 54° 47,369' N 009° 50,197' E 21.9 CTD AL523/2_8-2 GB 03.07.19 06:52:02 54° 47,359' N 009° 50,229' E 21.9 CTD AL523/2_8-1 GB 03.07.19 07:56:56 54° 46,318' N 009° 50,122' E 6.5 Boat AL523/2_8-1 GB 03.07.19 06:00:10 54° 46,788' N 009° 50,036' E 13.6 Boat AL523/2_7-1 SM PM 02.07.19 17:46:14 54° 40,024' N 010° 02,802' E 5.6 Boat AL523/2_7-1 SM PM 02.07.19 15:31:43 54° 40,027' N 010° 03,448' E 6.6 Boat AL523/2_6-2 SM PM 02.07.19 14:15:50 54° 39,766' N 010° 08,163' E 22.3 Lightmeter AL523/2_6-2 SM PM 02.07.19 14:06:04 54° 39,766' N 010° 08,176' E 22.5 Lightmeter AL523/2_6-1 SM PM 02.07.19 14:02:57 54° 39,761' N 010° 08,189' E 22.5 CTD AL523/2_6-1 SM PM 02.07.19 13:57:11 54° 39,782' N 010° 08,207' E 22.5 CTD AL523/2_5-1 SM AM 02.07.19 10:23:11 54° 39,800' N 010° 03,520' E 7.3 Boat
Figure 11 Mixotrophic grazing activity after six hours of incubation divided into four identified groups of
phytoplankton.
AL523/2_5-1 SM AM 02.07.19 07:59:59 54° 39,955' N 010° 03,144' E 6.4 Boat AL523/2_4-2 SM AM 02.07.19 06:22:44 54° 39,654' N 010° 08,330' E 21.8 Lightmeter AL523/2_4-2 SM AM 02.07.19 06:11:56 54° 39,715' N 010° 08,353' E 22.0 Lightmeter AL523/2_4-1 SM AM 02.07.19 06:07:48 54° 39,742' N 010° 08,406' E 20.3 CTD AL523/2_4-1 SM AM 02.07.19 06:00:06 54° 39,809' N 010° 08,360' E 23.8 CTD AL523/2_3-2 BE KN 01.07.19 14:23:15 54° 31,842' N 010° 02,915' E 27.8 Lightmeter AL523/2_3-2 BE KN 01.07.19 14:13:13 54° 31,894' N 010° 02,937' E 27.8 Lightmeter AL523/2_3-1 BE KN 01.07.19 14:07:46 54° 31,934' N 010° 02,955' E 27.8 CTD AL523/2_3-1 BE KN 01.07.19 14:00:33 54° 31,974' N 010° 02,985' E 27.6 CTD AL523/2_2-1 BE 01.07.19 12:42:35 54° 36,478' N 010° 03,264' E 9.5 Boat AL523/2_2-1 BE 01.07.19 11:05:21 54° 35,742' N 010° 03,435' E 11.8 Boat AL523/2_1-2 BE 01.07.19 09:22:03 54° 32,091' N 010° 03,039' E 27.0 Lightmeter AL523/2_1-2 BE 01.07.19 09:14:04 54° 32,004' N 010° 02,936' E 27.4 Lightmeter AL523/2_1-1 BE 01.07.19 09:00:16 54° 32,077' N 010° 02,963' E 26.7 CTD AL523/2_1-1 BE 01.07.19 08:53:43 54° 32,099' N 010° 02,988' E 26.6 CTD
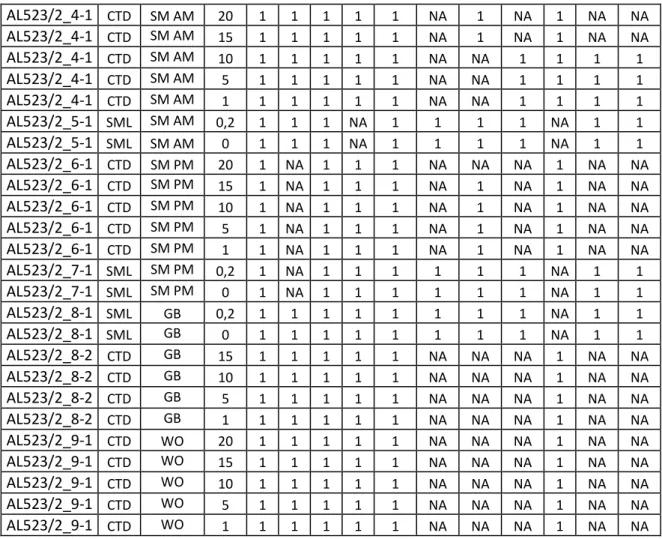
6.2 Sampling List
Hydrographical measurements included conductivity, chlorophyll a, oxygen and temperature data. Profiles were conducted at every CTD station. Biochemical samples were collected from the CTD rosette-water-sampler and from the rubber boat of the SML and the underlying water.
Samples were analysed for their particulate fraction, optical properties and nutrients within all CTD and SML samples with little exceptions for SiO2 and gel particles. SiO2 samples were lost for the SML at station SM AM while gel particles were not assessed at the station SM PM.
Surface properties were assessed in 25 and 10m depth of BE and at all SML stations. Oxygen production was monitored at 25, 10, 5 and 1m depth of BE, 15 and 1m depth of BE Knoten and SM PM and the SML at stations SM and GB. Oxygen Winkler titration was conducted in every water column profile but not within the SML. Bacterial growth and plankton abundances were assessed within the SML of all stations and the water column of SM AM including 10, 5, and 1m depth.
Station no. Type Identification Depth [m] Particles TEP/CSP Nutrients SiO4 Optical properties Surfactants O2 incubation Bacterial growth O2 titration Planktonic abundances Mixotrophic grazing
AL523/2_1-1 CTD BE 25 1 1 1 1 1 1 1 NA 1 NA NA
AL523/2_1-1 CTD BE 20 1 1 1 1 1 NA NA NA 1 NA NA AL523/2_1-1 CTD BE 15 1 1 1 1 1 NA NA NA 1 NA NA
AL523/2_1-1 CTD BE 10 1 1 1 1 1 1 1 NA 1 NA NA
AL523/2_1-1 CTD BE 5 1 1 1 1 1 NA 1 NA 1 NA NA
AL523/2_1-1 CTD BE 1 1 1 1 1 1 NA 1 NA 1 NA NA
AL523/2_2-1 SML BE 0,2 1 1 1 1 1 1 NA 1 NA 1 1
AL523/2_2-1 SML BE 0 1 1 1 1 1 1 NA 1 NA 1 1
AL523/2_3-1 CTD BE KN 25 1 1 1 1 1 NA NA NA 1 NA NA AL523/2_3-1 CTD BE KN 20 1 1 1 1 1 NA NA NA 1 NA NA AL523/2_3-1 CTD BE KN 15 1 1 1 1 1 NA 1 NA 1 NA NA AL523/2_3-1 CTD BE KN 10 1 1 1 1 1 NA NA NA 1 NA NA AL523/2_3-1 CTD BE KN 5 1 1 1 1 1 NA NA NA 1 NA NA AL523/2_3-1 CTD BE KN 1 1 1 1 1 1 NA 1 NA 1 NA NA
AL523/2_4-1 CTD SM AM 20 1 1 1 1 1 NA 1 NA 1 NA NA AL523/2_4-1 CTD SM AM 15 1 1 1 1 1 NA 1 NA 1 NA NA AL523/2_4-1 CTD SM AM 10 1 1 1 1 1 NA NA 1 1 1 1 AL523/2_4-1 CTD SM AM 5 1 1 1 1 1 NA NA 1 1 1 1 AL523/2_4-1 CTD SM AM 1 1 1 1 1 1 NA NA 1 1 1 1 AL523/2_5-1 SML SM AM 0,2 1 1 1 NA 1 1 1 1 NA 1 1 AL523/2_5-1 SML SM AM 0 1 1 1 NA 1 1 1 1 NA 1 1 AL523/2_6-1 CTD SM PM 20 1 NA 1 1 1 NA NA NA 1 NA NA AL523/2_6-1 CTD SM PM 15 1 NA 1 1 1 NA 1 NA 1 NA NA AL523/2_6-1 CTD SM PM 10 1 NA 1 1 1 NA 1 NA 1 NA NA AL523/2_6-1 CTD SM PM 5 1 NA 1 1 1 NA 1 NA 1 NA NA AL523/2_6-1 CTD SM PM 1 1 NA 1 1 1 NA 1 NA 1 NA NA AL523/2_7-1 SML SM PM 0,2 1 NA 1 1 1 1 1 1 NA 1 1 AL523/2_7-1 SML SM PM 0 1 NA 1 1 1 1 1 1 NA 1 1
AL523/2_8-1 SML GB 0,2 1 1 1 1 1 1 1 1 NA 1 1
AL523/2_8-1 SML GB 0 1 1 1 1 1 1 1 1 NA 1 1
AL523/2_8-2 CTD GB 15 1 1 1 1 1 NA NA NA 1 NA NA AL523/2_8-2 CTD GB 10 1 1 1 1 1 NA NA NA 1 NA NA AL523/2_8-2 CTD GB 5 1 1 1 1 1 NA NA NA 1 NA NA AL523/2_8-2 CTD GB 1 1 1 1 1 1 NA NA NA 1 NA NA AL523/2_9-1 CTD WO 20 1 1 1 1 1 NA NA NA 1 NA NA AL523/2_9-1 CTD WO 15 1 1 1 1 1 NA NA NA 1 NA NA AL523/2_9-1 CTD WO 10 1 1 1 1 1 NA NA NA 1 NA NA AL523/2_9-1 CTD WO 5 1 1 1 1 1 NA NA NA 1 NA NA AL523/2_9-1 CTD WO 1 1 1 1 1 1 NA NA NA 1 NA NA
7 Data, Sample Storage and Availability
The raw data was processed by the students with the help of all supervisors. All data collected were derived from either the water column at a discrete depth or the SML in case of biochemical data or, in case of hydrographic data, from CTD profiling. Data will be available on OSIS. In case of further questions, Dr. Helmke Hepach may be contacted (Table 2).
Table 2 Overview of data availability
Type Database Available Free
Access
Contact
biochemical Date Date E-Mail
Processed data OSIS Sept. 30 Sept. 30 hhepach@geomar.de
hydrographical
Raw data OSIS Sept. 30 Sept. 30 hhepach@geomar.de
8 Acknowledgements
We are very thankful for the commitment of the captain and crew of Alkor for their commendable support of the research on board.
9 References
Anderson R, Jürgens K and Hansen PJ (2017) Mixotrophic Phytoflagellate Bacterivory Field Measurements Strongly Biased by Standard Approaches: A Case Study. Front. Microbiol.
Chemistry 174, pp. 35–45. DOI: 10.1016/j.marchem.2015.05.002
Coble, P.G. (1996), Characterisation of marine and terrestrial DOM in seawater using excitation-emission matrix spectroscopy. In: Marine Chemistry 51, pp. 325-346
Cosović, B.; Vojvodić, V. (1998): Voltammetric Analysis of Surface Active Substances in Natural Seawater. In:
Electroanalysis 10(6), pp. 429-434
Cuscov, M.; Muller, F. L. L. (2015): Differentiating humic and algal surface active substances in coastal waters by their pH-dependent adsorption behaviour. In: Marine
Dreshchinskii, A. and Engel, A., Seasonal variations of the sea surface microlayer at the Boknis Eck Times Series Station (Baltic Sea), Journal of Plankton Research, Volume 39, Issue 6, November/December 2017, Pages 943–961, https://doi.org/10.1093/plankt/fbx055
Engel, A. (2009). Determination of Marine Gel Particles. Practical Guidelines for the Analysis of Seawater, CRC Press. p. 125-142
Engel, A.; Bange, H. W.; Cunliffe, M.; Burrows, S. M.; Friedrichs, G.; Galgani, L. et al. (2017): The Ocean's Vital Skin. Toward an Integrated Understanding of the Sea Surface Microlayer. In: Frontiers in Marine Science. 4, pp.
269. DOI: 10.3389/fmars.2017.00165
Flynn, K. J., D. K. Stoecker, A. Mitra, J. A. Raven, P. M. Glibert, P. J. Hansen, E. Graneli, and J. M. Burkholder.
2013. Misuse of the phytoplankton-zooplankton dichotomy: the need to assign organisms as mixotrophs within plankton functional types. J. Plankton Res. 35: 3–11. doi: 10.1093/plankt/fbs062
Gasol, J.M. & del Giorgio, P.A. Using flow cytometry for counting natural planktonic bacteria and understanding the structure of planktonic bacterial communities. Scientia Marina, 64, 197-224, 2000.
Lennartz, S. T. ; Lehmann, A.; Herrford, J.; Malien, F.; Hansen, H. P.; Biester, H.; Bange, H. W. (2014) Long-term trends at the Time Series Station Boknis Eck (Baltic Sea), 1957–2013: does climate change counteract the decline in eutrophication? In: Biogeosciences (BG), 11, pp. 6323-6339, doi:10.5194/bg-11-6323-2014.
Murphy, K.R., Stedmon, C.A., Waite, T.D., Ruiz, M.R. (2008): Distinguishing between terrestrial and
autochthonous organic matter sources in marine environments using fluorescence spectroscopy, Marine Chemistry, 108, pp. 40-58
Reinthaler, T., Sintes, E., and Herndl, G. J.: Dissolved organic matter and bacterial production and respiration in the sea‐surface microlayer of the open Atlantic and the western Mediterranean Sea, Limnology and Oceanography, 53, doi: 10.4319/lo.2008.53.1.0122, 2008
Robinson, C.: Microbial respiration, the engine of ocean deoxygenation, Frontiers in Marine Science, 5, https://doi.org/10.3389/fmars.2018.00533, 2019
Salter, M. E., Upstill-Goddard, R. C., Nightingale, P. D., Archer, S. D., Blomquist, B., Ho, D.T., et al. (2011).
Impact of an artificial surfactant release on air-sea gas fluxes during Deep Ocean Gas Exchange Experiment II. J.
Geophys. Res. Ocean. 116. doi:10.1029/2011JC007023.
Servais, P.; Casamayor, E. O.; Courties, C.; Catala, P.; Parthuisot, N.; Lebaron, P. (2003): Activity and diversity of bacterial cells with high and low nucleic acid content. In Aquatic Microbial Ecology 33, pp. 41–51. DOI:
10.3354/ame033041
Wurl, O.; Miller, L.; Vagle, S. (2011b): Production and fate of transparent exopolymer particles in the ocean. In:
Journal of Geophysical Research: Oceans 116 (C7). DOI: 10.1029/2011JC007342
Zhang, Y., Liu, M., Qin, B., Feng, S. (2009) Photochemical degradation of chromophoric-dissolved organic matter exposed to simulated UV-B and natural solar radioation, Hydrobiologia 627, pp. 159-168. DOI 10.1007/s10750- 009-9722-z
10 Appendices
10.1 Selected Pictures of Shipboard Operations