The Observed Stellar Mass
Distribution and Gas Velocity Fields
C . HAPTER III
Basedon: \K-bandPhotometryandHKinematicsforSpiralGalaxies"
Kranz&Rix,tobesubmittedtoA&A(2002)
Many aspects of galactic research are closely related to thestudy of the galaxies' stellar
mass distributions and kinematics. The appearance of galaxies is rather dependent on
theobserved wavelength, andfordierent scientic purposesdierent spectralrangesare
preferred to yieldthe desiredinformation. To estimate thestellar masscontent ingalax-
ies,near infrared (NIR)wavebands arebest suitedsincein theNIR dust absorptionand
populationeects have theleast eect on the surfacebrightness(e.g., Rix &Rieke 1993,
Frogel et al. 1996). With the development of new infrared detector arrays that became
operationalmainlyinthe90's,objects can nowbeobserved intheNIR witha resolution
thatcompares to theone of CCD's invisiblewavelengths.
3.1. The galaxy sample
The need for obtaining a new data sample came from the specic requirements for this
project. Since for the sample photometric as well as kinematic data are needed, there
weresome constraintswhichappliedtotheselectionofcandidates. Firstofall,thegalax-
ies should be closeby and large enough to allow a fairly detailedsampling of their mass
distribution. This requirement was met by considering only galaxies with an apparent
diameter of >2 0
. To reasonablyresolve a their morphologies and to avoid extensive self
absorptionbygas and dust in the disk, forobtaining the photometry data galaxies with
lowinclinations withrespectto theline-of-sight (LOS)would bepreferred. However, the
LOS component of the circular motion increases with inclination i, thus galaxies with
low inclinations would be preferred. Due to the fact that the projection of the galaxy
scales with cos(i) and the LOS fraction of the velocityscales with sin(i),galaxies in the
inclinationrangebetween 30 Æ
and 60 Æ
yieldthemostfavorableconditionsand were
includedinthesample.
Inlightofmodellingtheglobalgasdynamicsinthegalaxies,strongbarsshouldbeavoided
becauseoftheirdistinctlydierentdynamicsfrom therestof thedisk. Still,strongspiral
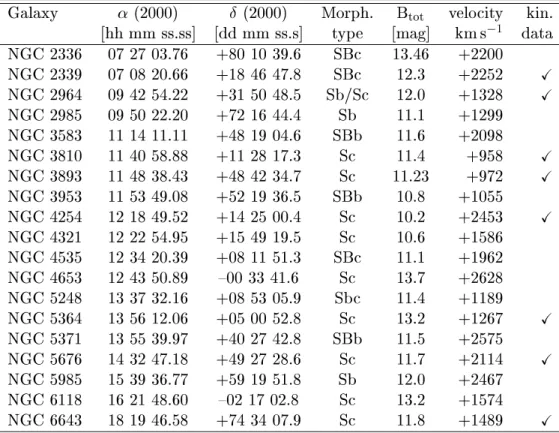
Table 3.1 Sampleofgalaxies observedinthisproject. Forallgalaxies NIRphotometry
isavailable. Kinematicdataisavailablefora subsampleof8galaxies.
Galaxy (2000) Æ (2000) Morph. B
tot
velocity kin.
[hhmm ss.ss] [ddmm ss.s] type [mag] kms 1
data
NGC2336 07 27 03.76 +8010 39.6 SBc 13.46 +2200
NGC2339 07 08 20.66 +1846 47.8 SBc 12.3 +2252 X
NGC2964 09 42 54.22 +3150 48.5 Sb/Sc 12.0 +1328 X
NGC2985 09 50 22.20 +7216 44.4 Sb 11.1 +1299
NGC3583 11 14 11.11 +4819 04.6 SBb 11.6 +2098
NGC3810 11 40 58.88 +1128 17.3 Sc 11.4 +958 X
NGC3893 11 48 38.43 +4842 34.7 Sc 11.23 +972 X
NGC3953 11 53 49.08 +5219 36.5 SBb 10.8 +1055
NGC4254 12 18 49.52 +1425 00.4 Sc 10.2 +2453 X
NGC4321 12 22 54.95 +1549 19.5 Sc 10.6 +1586
NGC4535 12 34 20.39 +0811 51.3 SBc 11.1 +1962
NGC4653 12 43 50.89 {00 33 41.6 Sc 13.7 +2628
NGC5248 13 37 32.16 +0853 05.9 Sbc 11.4 +1189
NGC5364 13 56 12.06 +0500 52.8 Sc 13.2 +1267 X
NGC5371 13 55 39.97 +4027 42.8 SBb 11.5 +2575
NGC5676 14 32 47.18 +4927 28.6 Sc 11.7 +2114 X
NGC5985 15 39 36.77 +5919 51.8 Sb 12.0 +2467
NGC6118 16 21 48.60 {02 17 02.8 Sc 13.2 +1574
NGC6643 18 19 46.58 +7434 07.9 Sc 11.8 +1489 X
Note: ThedataforthecompilationofthisTablearetakenfromtheSIMBAD database,
operatedatCDS,Strasbourg,France
features areneeded asthe basisfor theanalysis. Thus, thesample was chosen to consist
mainly of closeby, non-barred high luminositygalaxies with spiralarmsthat also appear
strongintheNIR regime. Since alldatawereacquiredat theCalarAlto observatorythe
lastrequirement is thevisibilityfromsouthern Spain.
3.2. The data
First of all the NIR photometry was taken to determine, whether a galaxy was suited
for this project, i.e. if its morphology shows strong and well dened spiral arms also in
the NIR. The requirement for thekinematic measurements wasto trace thegas velocity
perturbationscaused bythe spiralarms, ideallyacross thewhole disk. The two classical
methodsforobtaining2DgasvelocityeldsareHI orCOradioobservationsand Fabry-
Perotinterferometry. Alternatively,longslit spectrataken at dierentpositionanglescan
beused to mapthedisk.
SingledishHIorCOobservationsarenotsuitedforthisprojectbecausethey suerfrom
relativelybadangularresolutionandpoorsensitivitytofaintemissionbetweenspiralarms
of a sample of spiralgalaxies. In thevelocity maps the signatureof the spiralarmsis in
the majority of cases not or only barely visible. This most likely results from blurring
thealreadyweak velocityperturbationsbybeamsmearing. 2DFabry-Perotvelocityelds
providetherequiredangularresolutionbutusuallygiveonlyaverypatchyrepresentation
of the disk: Mainly the HII regions show up inthe map (e.g., Weineret al. 2001b). Be-
cause thecoverage thatcan be achieved bytaking eight longslit spectraacross agalaxy's
disk is reasonably high it was decided to collect the kinematic information by using a
longslitspectrograph. Furthermore, thismethodyields good angularresolution and high
sensitivityto faint H-emission.
All observations were done with the 3.5m telescope of the Calar Alto observatory in
southernSpain. TheOmegaPrimecamerawiththeK 0
-lterwasusedto acquiretheNIR
photometry and the TWIN longslit spectrograph was used to obtain the gas kinematics
from theHemission line.
3.2.1. NIR photometryobservations
TheOmegaPrimeinfraredcamera (Bizenberger etal. 1998)islocated attheprimefocus
of the 3.5m telescope. The detector is a 1024 1024 pixel HgCdTe (1{2.5 m) array
made by Rockwell. The image scale is 0:
00
3961 per pixel, resulting in a eld-of-view of
6:
0
766:
0
76. Withthis relatively largeeld-of-view, almost all galaxies tted well on the
detector, supersedingtheneedformosaicking.
TheNIRphotometricobservationswerecarriedoutin5nightsduringtwoobservingruns:
25. { 26. May 1999 and 16. { 18. March 2000. The weather conditions during the rst
run were only moderate, thus only a small part of the collected data was actually used
lateron. The March 2000 run had good conditions,althoughthe seeingwasnotoptimal
(1: 00
4inK 0
). Thenalsampleconsistedof19galaxieswithgoodphotometrythatcould
beusedto chosethecandidatesforthekinematicmeasurements. Thesample isdisplayed
inFigure 3.1.
Attherst runthe\DoubleCorrelatedRead"(dcr) readoutmode wasusedforthearray.
Thearrayisreadimmediatelyaftertheinitialresetandagainjustbeforethenalresetat
theend of theintegration. While one readouttakesabout 0.8s forOmega-Prime, it has
anenormous fractionof thetelescopetime, ifone considersthatasingle integration time
takes 2to 3s, and two readoutsare neededperframe. For thesecond runanew readout
modewasavailable,the\FullMPIAMode"(rrr-fmpia). ThenewFullMPIAmodeis\line
oriented". It reads out single lines whilethewhole array isintegrating, leaving virtually
no overhead time for the readout. This reduces the telescope time needed to eectively
integrate 20minutes on target by about 15minutes to lie in the order of 80minutes,
includingskybackgroundobservationsand telescopeslewing. Theuseof the\FullMPIA
Mode" is highly encouraged!
Since the objects ll the complete array, a separate closeby background position was
observedalternatelywiththegalaxytoallowforskybackgroundcorrection. Theobserving
sequencewaschosentolooklike: GG{BB{GG{BB{...(G=galaxy,B=background
position),takingtwo exposuresof 30sat each position. Anyofthese exposuresis astack
of either 15 2-second exposuresor 10 3-second exposures, dependingon the atmospheric
Figure 3.1K 0
-band (2.2m)imagesofall observedgalaxies.Fortheimagestheentireeldofview
oftheOmegaPrimecamera(6:
0
766:
0
76)isdisplayed. Bright foregroundstarsaremasked outin all
frames.
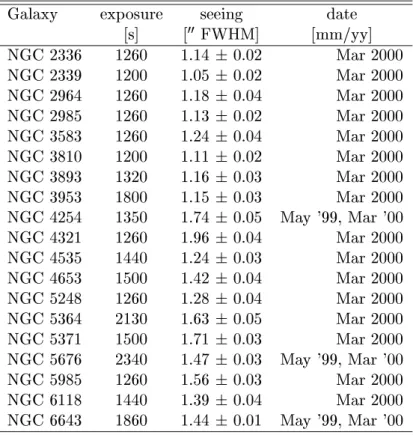
Table 3.2 ObservinglogfortheNIR photometry.
Galaxy exposure seeing date
[s] [
00
FWHM] [mm/yy]
NGC 2336 1260 1.14 0.02 Mar2000
NGC 2339 1200 1.05 0.02 Mar2000
NGC 2964 1260 1.18 0.04 Mar2000
NGC 2985 1260 1.13 0.02 Mar2000
NGC 3583 1260 1.24 0.04 Mar2000
NGC 3810 1200 1.11 0.02 Mar2000
NGC 3893 1320 1.16 0.03 Mar2000
NGC 3953 1800 1.15 0.03 Mar2000
NGC 4254 1350 1.74 0.05 May '99,Mar'00
NGC 4321 1260 1.96 0.04 Mar2000
NGC 4535 1440 1.24 0.03 Mar2000
NGC 4653 1500 1.42 0.04 Mar2000
NGC 5248 1260 1.28 0.04 Mar2000
NGC 5364 2130 1.63 0.05 Mar2000
NGC 5371 1500 1.71 0.03 Mar2000
NGC 5676 2340 1.47 0.03 May '99,Mar'00
NGC 5985 1260 1.56 0.03 Mar2000
NGC 6118 1440 1.39 0.04 Mar2000
NGC 6643 1860 1.44 0.01 May '99,Mar'00
conditions. Toperformtwoexposuresof30seachinsteadofonewithoneminuteexposure
timewasmotivatedtoallowexibilityduringshorttimeweather changes. Toaccount for
starsatthebackgroundposition,someditheringwasintroducedtoenablealaterremoval
ofthestars. Forcalibrationpurposes,severalstandardstarsfromthePerssonetal.(1998)
samplewereobservedduringthenight. The nalsampleofthe19 galaxieswithgoodK 0
-
bandphotometryis given inTable 3.2.
3.2.2. H spectroscopy observations
ThegaskinematicsweremeasuredfromtheHemissionline. Thedataweretakenduring
three observingruns witha total of about10 nightsat the3.5mtelescope: 7. {10. June
1999 (4 nights), 5. { 8. May 2000 (4 0.8 nights) and 2. { 7. December 2000 (6 0.5
nights). OnemoreobservingrunwasgrantedinFebruary/March2001,butnodatacould
beattained dueto bad weather. Finally,kinematicdata foreight galaxieswascollected,
whilefor threeof them thedataset could notbe completed.
The TWIN isa two channel longslitspectrograph,located at the cassegrainfocus of the
3.5m telescope. The datafor thisprojectweretaken in thered channel, centered at the
wavelength around the H line. The slit of the TWIN was set to measure 4 0
1:
00
5 on
the sky. With the setup used, the TWIN achieved a spectral resolution of 0.54
A per
detector pixel, which translates to 24:8kms 1
LOS-velocity resolution per pixel. The
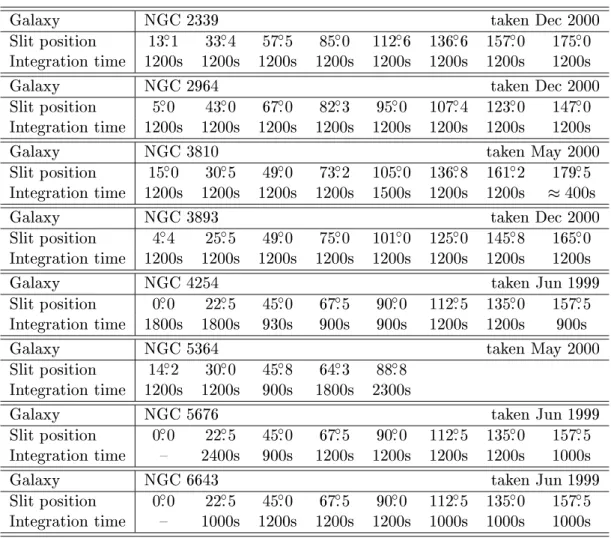
Table 3.3 ObservinglogfortheH spectroscopy.
Galaxy NGC 2339 taken Dec2000
Slitposition 13:
Æ
1 33:
Æ
4 57:
Æ
5 85:
Æ
0 112:
Æ
6 136:
Æ
6 157:
Æ
0 175:
Æ
0
Integration time 1200s 1200s 1200s 1200s 1200s 1200s 1200s 1200s
Galaxy NGC 2964 taken Dec2000
Slitposition 5:
Æ
0 43:
Æ
0 67:
Æ
0 82:
Æ
3 95:
Æ
0 107:
Æ
4 123:
Æ
0 147:
Æ
0
Integration time 1200s 1200s 1200s 1200s 1200s 1200s 1200s 1200s
Galaxy NGC 3810 taken May2000
Slitposition 15:
Æ
0 30:
Æ
5 49:
Æ
0 73:
Æ
2 105:
Æ
0 136:
Æ
8 161:
Æ
2 179:
Æ
5
Integration time 1200s 1200s 1200s 1200s 1500s 1200s 1200s 400s
Galaxy NGC 3893 taken Dec2000
Slitposition 4:
Æ
4 25:
Æ
5 49:
Æ
0 75:
Æ
0 101:
Æ
0 125:
Æ
0 145:
Æ
8 165:
Æ
0
Integration time 1200s 1200s 1200s 1200s 1200s 1200s 1200s 1200s
Galaxy NGC 4254 taken Jun1999
Slitposition 0:
Æ
0 22:
Æ
5 45:
Æ
0 67:
Æ
5 90:
Æ
0 112:
Æ
5 135:
Æ
0 157:
Æ
5
Integration time 1800s 1800s 930s 900s 900s 1200s 1200s 900s
Galaxy NGC 5364 taken May2000
Slitposition 14:
Æ
2 30:
Æ
0 45:
Æ
8 64:
Æ
3 88:
Æ
8
Integration time 1200s 1200s 900s 1800s 2300s
Galaxy NGC 5676 taken Jun1999
Slitposition 0:
Æ
0 22:
Æ
5 45:
Æ
0 67:
Æ
5 90:
Æ
0 112:
Æ
5 135:
Æ
0 157:
Æ
5
Integration time { 2400s 900s 1200s 1200s 1200s 1200s 1000s
Galaxy NGC 6643 taken Jun1999
Slitposition 0:
Æ
0 22:
Æ
5 45:
Æ
0 67:
Æ
5 90:
Æ
0 112:
Æ
5 135:
Æ
0 157:
Æ
5
Integration time { 1000s 1200s 1200s 1200s 1000s 1000s 1000s
spatialresolutionoftheCCDwasreducedbyafactoroftwotoincreasethespectrograph's
sensitivitytofaintemission. Itsampledtherotationcurvesofthegalaxieswitharesolution
of 1:
00
12,whichis inaccordance withtheaverage seeing conditions. Foreach galaxy eight
slit positions were planned to be taken across the disk to sample the 2D velocity eld
reasonably well. The angularseparationof the dierentslit positionswas chosen to 22:
Æ
5
for the June 1999 observations. For later runs the sampling was chosen to provide an
equidistant spacing in the deprojected reference frame of the galaxy. For that purpose
an assumption for the major axis position angle and the inclination of the galaxy was
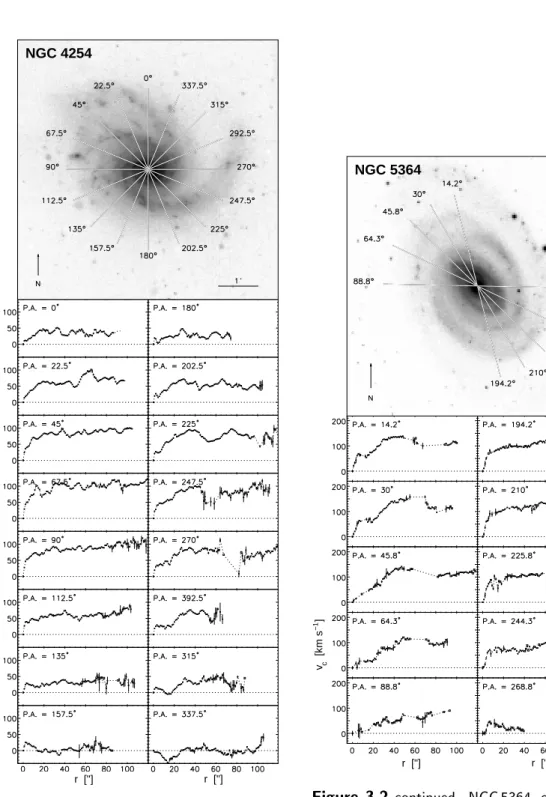
made. Theorientation of theslit positions and theirindividualexposure times are listed
inTable3.3andisdisplayedinFigure3.2togetherwiththereducedrotationcurvesalong
all taken slit positions. After each exposure a comparison exposure of a He-Ar arclamp
was taken to constantlymonitorthewavelength solutionof thespectrograph.
v [km s ] c
r ["] . r ["]
−1
NGC 2339
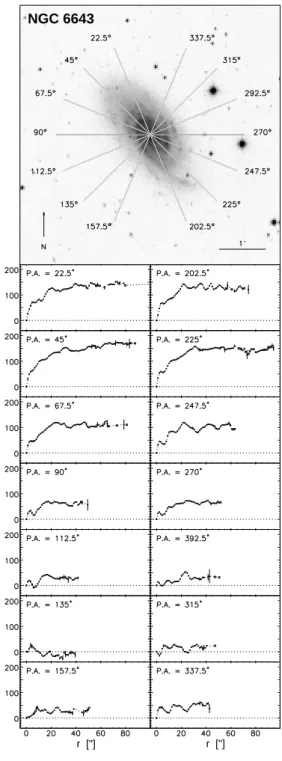
Figure 3.2NGC2339
v [km s ] c
r ["] . r ["]
−1
NGC 2964
Figure3.2 continued. NGC2964
Dataforthesubsampleof galaxieswithkinematicobservations. Theupperframe showstheK 0
-band
image. The overlay shows theorientationsofthe spectrograph. In order to measurethe 2D velocity
eld, ideally 8longslit spectra were taken acrossthe galaxies'disks (angles labelled in boldfont) all
crossingthenucleus. Themeasuredrotationcurvesalongthe16slitpositionsareshowninthe lower
part oftheFigure. Non-lleddatapointsindicateerrorslargerthan30kms 1
.
v [km s ] c
r ["] . r ["]
−1
NGC 3810
Figure 3.2continued. NGC3810
v [km s ] c
r ["] . r ["]
−1
NGC 3893
Figure 3.2continued. NGC3893
v [km s ] c
r ["] . r ["]
−1
NGC 4254
Figure 3.2continued. NGC4254
v [km s ] c
r ["] . r ["]
−1
NGC 5364
Figure 3.2 continued. NGC5364, only
5spectracouldbetaken.
v [km s ] c
r ["] . r ["]
−1
NGC 5676
Figure 3.2 continued. NGC5676, only
7spectracould betaken.
v [km s ] c
r ["] . r ["]
−1
NGC 6643
Figure 3.2 continued. NGC6643, only
7spectracouldbetaken.
3.3.1. NIR photometry
For NIR detector arrays most of the calibration procedures, such as correcting for pixel
to pixel gain variations or dark current subtraction, are very similar to those of optical
CCD's. However, one basic dierence is the sky brightness, which is outshining almost
any astronomical object. During the Omega Prime runs, the sky brightness was in the
range of 3500 counts persecond perdetector pixel, which translates to 12mag 2 00 1
.
These conditionsallowed onlyexposure times of 2 or3s, in order to not let thegalaxy's
nucleusreachtherange wherethechipshows deviationsfromlinearity,whichhappensat
25000 counts. Furthermore, the sky brightnessis highly variable and needs constant
monitoring. In the end, the observing runs yielded as many sky background frames as
science frames.
Theactualmeasureddetectorvoltage,orcounts, containsseveraladditionalcontributions
besides the source ux. The main components that contribute to the measured voltage
V(x;y)
m
at each pixelfora measurementon target are:
V(x;y)
m
=[G(x;y)(F(x;y)
g +F
s )+I
d
]t (3.1)
whereG(x;y)iseachpixel'sphotometricgain(e /photon),F(x;y)
g
istheextendedsource
ux that should be isolated and F
s
is the sky ux (photons/s), I
d
is the dark current
(e /s) and t is the integration time. In principle F
s and I
d
also exhibit pixel to pixel
variations,butat rst order both areapproximatelyconstant acrossthe chip. The main
components that contribute to the measured voltage V(x;y)
s
at each pixel for a sky
backgroundmeasurement areasabove:
V(x;y)
s
=[ G(x;y)(F
s )+I
d
]t (3.2)
Thedierenceoftheframeontargetandtheskybackgroundframeeliminatesallundesired
eectsexcept thepixelto pixel gain variation:
V(x;y)
m
V(x;y)
s
=G(x;y)F
g
t (3.3)
Theskyframescanalsobeusedtocorrectforthechip'sgainvariations,sincetheyexhibit
only negligibleux variations across the eld of view. Their use as \ateld frames" is
furthermotivatedbytheirrelativelyhighuxandthefactthatnumerousskyframeswere
taken. Theskyframesare,however,notentirelyfreeofsources. Therearestillstarsinthe
eldofview. Thenalateldframeusedfordatareductionwasderivedbycalculatinga
medianofalargesetofscaledskyframes,toeliminatefeaturesfromthebackgroundelds.
Furthermorethedarkcurrenthastobesubtractedfromtheskyateldframe. IfN =F
s t
is assumed to be a constant that normalizesthe ateld frame, from equation (3.2) it is
found:
G(x;y)=(V(x;y)
s I
d
t)=N: (3.4)
This procedure yields the source object's ux per unit time. To relate this quantity to
astrophysicalmagnitudes,measurementsofobjectswithknownuxhaveto beevaluated.
servations. The standard star measurements revealed only a very small variation of the
zero point throughout the nights: in thethree nights when mostof the dataweretaken,
the zero point variation was less than 0.095mag, and even smaller in one single night
(<0:05mag). Figure3.3 displays thestandardstar measurements forthenight of March
17 th
,2000.
Figure 3.3 Standardstar measurements in the
night of March 17 th
, 2000. The four dierent
stars (P035-R, P550-C, P499-E, P565-C) from
thePerssonetal.(1998)NIRstandardstarsam-
plewereobservedduringthenight. Theerrorbars
referto1 errors.
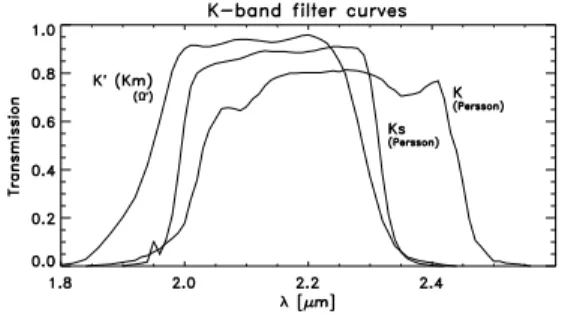
Figure 3.4 Transmissioncurvesof the K-band
ltersusedfortheobservations(K 0
withOmega
Prime) and the Persson et al. (1998) lters, for
whichthestandardstaruxesaregiven.
A systematicerror wasintroducedbythefactthat theuxesforthestandardstars were
only given forthe K and Ks lters (Persson et al. 1998), whereas for themeasurements
the K 0
lter was used,whose lter curve diersslightlyfrom bothother lters (see Fig-
ure3.4. However, theltercurvesof theK 0
and Ks lterarevery similar: about93%of
theintegratedareaoftheKsltercurveisinsidethatoftheK 0
ltercurve. Sincetheux
throughthedierentK andKsltersfortheusedsubsetofthePerssonsampleiscompat-
iblewithbeingequalwithintheirmeasurederrorbarsand variesbymaximally0.02mag,
theexpecteddierence betweentheKs and K 0
lterwouldbe even less. Thus,the Pers-
sonKs-uxeswereusedtocalibratethestandardstarsfortheOmegaPrimeobservations.
The data reductionwas doneusing the ESO-MIDAS software package and self developed
IDL routines. MIDAS was used for sky subtraction, atelding and for coaligning the
ditheredframes. Fortheskysubtractionskyframeswereusedthatwereinterpolationsof
theskyframestakenbeforeandaftertheobjectframe. Thenormalizedateldframewas
dividedinto the object frames. From all object framesa median imagewas computed to
correct for strongly deviating pixelsin theframes. Deviating pixels withinsingle frames
were then replaced by median values. The nal image was derived from a mean of all
preprocessedframes. Thenetuningofndingthezero-point oftheskybackgroundwas
done by looking at the radial light proles of the disks. The sky background level was
adjustedto not causestrong bends inthelight prolewhilefading into thesky. Possible
physicaldisktruncationeects wereconsideredand an attempt wasmade to avoid them
from being removed by adjusting the sky level. Finally, the images were cleaned from
bright foreground stars. The magnitudes listedin Table 3.4 are given forthe ux inside
the22 K 0
-mag 2 00 1
isophote.
To extract the individual rotation curves from the raw data, the IRAF data reduction
package, and again IDL routines were used. The IRAF package was used following the
instructions given in Massey (1997) and Massey et al. (1992). The longslit spectra were
reduced to a level that was required for extracting the rotation curves. Less priority
was attributed to illumination corrections or ux calibration. The latter was not at all
performed. To subtract the dark current from the frames and to ateld the images
with domeat exposures the IRAF-tasks zerocombine and atcombine were used in
combination with theccdproc task. The correction fordistortions alongthe spatialaxis
ofthelongslitwasaveryimportantsteptoassurecorrectvelocitymeasurementsatallradii
intherotationcurves. Thiscorrectionprocedurealsoincludedthewavelengthsolutionfor
thespectra. The followingtasks fromthenoao/twodspec/longslit package wereused:
identify wasusedto identifythelinesoftheHe-Arlampcomparisonspectrumalongone
dispersionline.
reidentify wasthenappliedtore-identifythese featuresat other(20) dispersionlines
alongthespatialaxis.
tcoords thenperforms a t of a two-dimensionalfunction to the identiedgrid points
all overthe frame.
transform nallyappliesthegeometricalcorrection totheoriginalframe,correctingfor
thedistortionsalongthespatialaxisandgivingthelogofthewavelengthasalinear
functionalongthe dispersionaxis.
Residualdistortionscan be mapped from night sky linesand get accounted forwhen de-
terminingthe linecenters.
ThefurtherdatareductionwasdoneusingselfdevelopedIDLroutines. Ina rststepthe
cosmic rays were removed from the relevant parts of the spectra by replacing the spikes
withadjacent pixel values. Thisprocess waskept interactive to assurethe qualityof the
correction. After removal of (all but one) night sky lines and the galaxy's continuum
emission, the rotation curves could be measured. The line-of-sight (LOS) velocity com-
ponentof theionized gaswasdetermined asa functionofradiusfrom thegalactic center
fromDopplershiftsof theH-lineand thebrighterNII-lineat6584
A(therightemission
line in Figure 3.5). The central values for the LOS velocity of the emission lines were
determined by tting a single Gaussian prole to the observed line prole. The single
Gaussianappeared to be a good enough descriptionof thereal line prolesto determine
theline centers to sub-pixelresolution. The nalrotation curve wascalculated from the
3:1 weighted coaddition of the two ts (see Figure 3.5). The weights were derived from
therelative linestrengths. The comparison ofthe two ts yieldedthe uncertainty of the
line center position, which was taken as = p
0:75(H mean) 2
+0:25(NII mean) 2
.
Residualslitdistortionsalong thespatialaxis were corrected by ttinga loworder poly-
nomial to spatialdistribution the night sky linecenter and subtracting thedeviationsof
thepolynomialfrom its mean fromthe rotationcurve.
Thenalstepwastondthezero-pointofthespectra,deningthedynamiccenterofthe
disk. Asitwasapparentfromthespectra,thedynamiccenterdidn'talwayscoincidewith
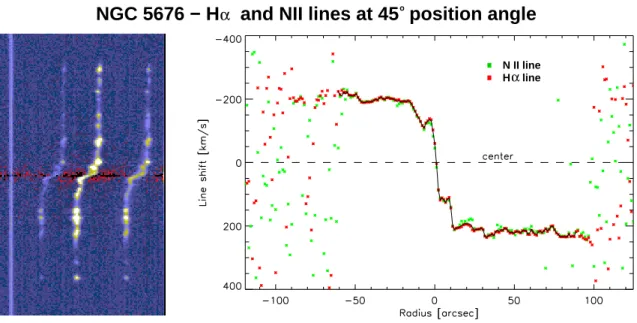
α
N II line H line α
NGC 5676 − H and NII lines at 45 position angle
Figure 3.5 Data example for NGC5676. Shown is the spectrum from slit position 45 Æ
, which is
very closetothemajor axispositionangle. Atleft thefullyreduced TWINspectrumis shownforthe
wavelength region of theH-line andthe twoNII-linesfor a widthof 68
A. One night sky line(left
in theimage)hadnotbeenremoved tocheck for residualdistortionsalongthespatialaxis. At right,
thederived lineshifts are plotted. Thegreendatapoints refertothe lineshiftsdetermined fromthe
NII-line(theright onein theimageatleft), whilethered datapoints referto theH-line. Theline
shifthasbeentranslatedintoline-of-sightvelocities. Thecontinuousblacklineistheweightedaverage
rotationcurve
the lightcenter of the continuum emission. In these cases the zero-point wasdetermined
such that the asymptotic rotation curves reached about the same velocity on bothsides
of the galaxy. Systematic errors arisingfrom all these procedureswere accounted for by
adding anoverallsystematic errorto allrotation curveswhencomparingwiththeresults
from thesimulations.
The lineshiftswere translatedinto LOS rotation velocitiesmaking useof
dv=c d
=cdln=c2:3026dlog (3.5)
wheredlog isthelineshiftinthewavelengthcalibratedspectrum. Theperpixel resolu-
tion is3:59610 5
forthe TWINspectrograph,corresponding to24.8kms 1
.
3.4. Derived quantities
For thisdiscussion, the focus will be on the NIR properties of the galactic disks. A rst
step to analyze thelight distribution is to ndtheinclination and positionanglesof the
galaxies and to perform the deprojection of the disks. In cases where there is only NIR
photometryavailable,theinclinationsandpositionangleswereestimatedbyapproximat-
ingan ellipseto the faintest isophotesof thegalaxy. Theprecisionwith whichthe values
can be determined fromthis methoddependson theinclinationof the particulargalaxy.
toallvalues. Theinclinationsandpositionanglesofthesegalaxies,forwhichobservedgas
kinematics is available, could be determined quite reliably from the spectra. They were
derived from a global 2
-t of an axisymmetric rotation curve model to the16 observed
rotation curves. The modelwasbasedon acombination ofstellarand dark halorotation
curveswhichwerescaledtoanaverage rotationcurvefromthesixslitpositionsclosest to
themajoraxis (as shown inFigure 3.7). The uncertainty range forthe kinematictting
method is lessthan 1 Æ
. However, forNGC 4254 it has been foundduringthe modelling
procedurethatitmight matterwhetheran axisymmetricrotation curvemodelisusedfor
thet ora 2D velocity eld from a hydrodynamical gas simulation. In most cases those
dierent methods lead to very similar results. Only for NGC4321 literature values had
to be adopted since this galaxy's size on the sky is larger than the eld-of-view of the
Omega Prime camera. A reliable estimate from the data wasnot possible. The derived
parameters forthesamplegalaxies arecompiledinTable3.4.
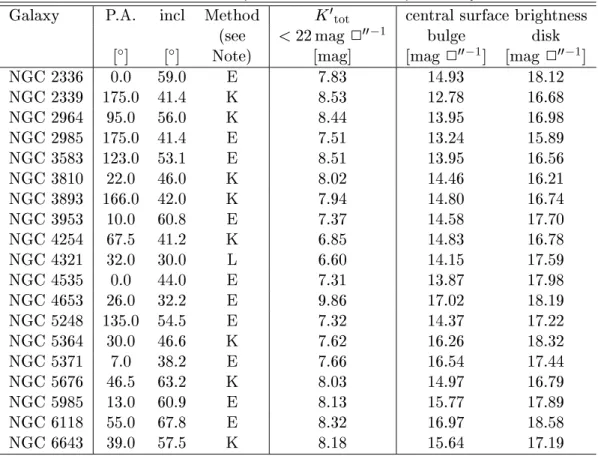
Table 3.4Derived parametersfromtheNIRphotometry.
Galaxy P.A. incl Method K
0
tot
centralsurface brightness
(see <22mag 2 00 1
bulge disk
[ Æ
] [
Æ
] Note) [mag] [mag 2
00 1
] [mag 2 00 1
]
NGC 2336 0.0 59.0 E 7.83 14.93 18.12
NGC 2339 175.0 41.4 K 8.53 12.78 16.68
NGC 2964 95.0 56.0 K 8.44 13.95 16.98
NGC 2985 175.0 41.4 E 7.51 13.24 15.89
NGC 3583 123.0 53.1 E 8.51 13.95 16.56
NGC 3810 22.0 46.0 K 8.02 14.46 16.21
NGC 3893 166.0 42.0 K 7.94 14.80 16.74
NGC 3953 10.0 60.8 E 7.37 14.58 17.70
NGC 4254 67.5 41.2 K 6.85 14.83 16.78
NGC 4321 32.0 30.0 L 6.60 14.15 17.59
NGC 4535 0.0 44.0 E 7.31 13.87 17.98
NGC 4653 26.0 32.2 E 9.86 17.02 18.19
NGC 5248 135.0 54.5 E 7.32 14.37 17.22
NGC 5364 30.0 46.6 K 7.62 16.26 18.32
NGC 5371 7.0 38.2 E 7.66 16.54 17.44
NGC 5676 46.5 63.2 K 8.03 14.97 16.79
NGC 5985 13.0 60.9 E 8.13 15.77 17.89
NGC 6118 55.0 67.8 E 8.32 16.97 18.58
NGC 6643 39.0 57.5 K 8.18 15.64 17.19
Note: Theabbreviationsforthemethodofdeterminingthegalaxy'spositionanglesandinclina-
tionsstand for thefollowing: E =fromellipsetting; K=fromgaskinetic measurements;L
=fromtheliterature.
Havingdetermined theprojectionanglesof thegalaxies,theIDLroutine'GAL FLAT'from
theastrolibwas usedto deprojectthegalaxy images to face-on(the deprojectionprocess
will be described in more detail in Section 4.1.3). These deprojected frames were then
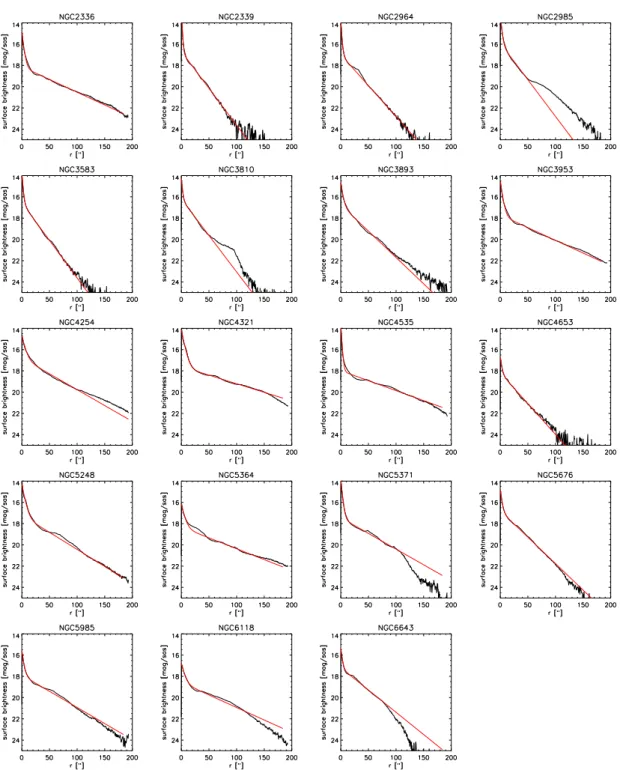
Figure 3.6RadiallightprolesinK 0
forallgalaxiesfromthesample. FormostgalaxiestheK-band
lightiswellapproximatedbyadoubleexponentialprole,givenbytheredline.
usedto ndtheaveragedradialK-bandlightproleand thediskscalelengths. Sincethe
sample consisted of late type spiralswith smallbulges, for mostof the galaxies a double
exponentialbulge/diskmodelprovidesaverygoodttotheradialK-bandlightproleas
showninFigure 3.6. The parametersthatwerederivedfromthephotometry aregivenin
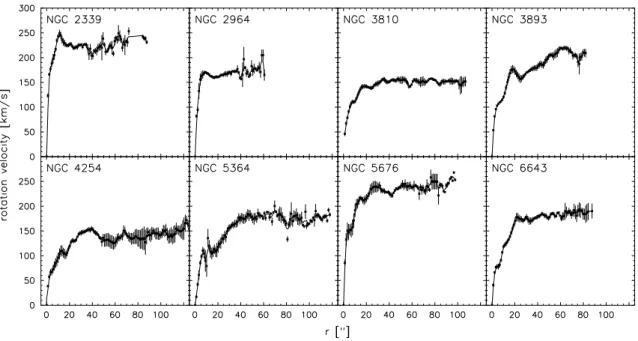
Figure 3.7 Averaged rotationcurvesof the sample galaxies. Each H rotationcurve shownabove
is anaverage of rotationcurvesfrom six spectrograph slitpositions thatwere oriented closestto the
majoraxispositionangle. Therotationcurvesareinclination-correctedandrenderintrinsicvelocities.
Table 3.4. It shows that thesample comprises mainlyof high surfacebrightnessgalaxies
which have a centraldisksurfacebrightnessof 17 mag 2 00 2
inK 0
.
Figure3.7showstherotation curvesthatwerederivedfrom theH-longslitspectra. The
presentedrotationcurvesareaveragesofspectratakenatthosesixslitpositionanglesthat
were taken closest to the major axispositionangle. The rotation curvesare presentedto
showintrinsicvelocities,i.e.projectioneects weretaken into accountand werecorrected
accordingto the parametersgiven inTable3.4.
3.4.1. Remarks toindividual galaxies
For the galaxies for which both photometric and kinematic data are available, a few
remarks about their morphology and environment are given. More detailedinformation
willbeprovidedinChapter5and Chapter6,wherethemodellingof individualobjects is
beingdiscussed.
NGC2339 exhibits asmall, very bright nucleusina weak complexbar. Inthe K-band
there are faint arms, revealing an inner 3-arm morphology. It is a bright IRAS
source.
NGC2964 is a starburst galaxy that exhibits strong star formationactivity across the
whole disk and the nucleus. It does not exhibit a clear grand design spiral struc-
ture,although there isa prominent arm-structure in thedisk. NGC2964 is a non-
interactingpair withNGC2968 at 5:
0
8 projected distance.
NGC3810 isaScgalaxyintheLeogroup. Inthecentralparts(<45 00
)NGC3810looks
like a grand design spiralbut furtherout the armsbecome more occulent. There
diskdeviatesconsiderablyfromexponentialandbeyond100 00
thediskappearstobe
truncated.
NGC3893 is a grand design Sc galaxy in the Ursa Major Cluster of Galaxies. In the
outerpartsthesymmetryofthespiralisdisturbedbyinteractionwithitscompanion
NGC3896 located3:
0
9 to the south-east. Thereis enhanced star formation activity
intheinteractingarmascompared to thearm at theoppositeside.
NGC4254 isabrightScgalaxy,locatedintheVirgogalaxycluster. Itexhibitsalopsided
three-arm morphology, that is seen much stronger in the optical than in the NIR.
The south-westernarm ismore pronouncedthantheothers. There isvigorous star
forming going on along the spiralarms. Although there is no major galaxy in the
immediate vicinity, it has been found that NGC4254 interacts with the gaseous
medium of the cluster (Phookun et al. 1993). It appears to have a weak bar at a
positionangle of 45 Æ
.
NGC5364 is an extremely regular galaxy whose spiral arms can be clearly traced for
more than400 Æ
. They emerge from an inner ring that is completelyclosed. Inside
this ring there is a nuclear spiral winding in the same sense. It has been argued
(Braine et al. 1993) that this galaxy might be disturbed because the spiral arms
wind"too much" and thereare several galaxiesvery nearby.
NGC5676 is a starburstgalaxy witha fairlyregular granddesign structure. Thereare
manybright,knotty starformingregions andlamentaryarmsoverimposed. Ithas
several suddenchanges inthespiral'spitchangle.
NGC6643 is { like NGC5676 { a starburst galaxy with a fairly regular grand design
structure. It exhibits a considerable lopsided morphology with a third arm and
lamentaryarms at theouter regions. Thereisno evidence forinteraction.