Lower plate serpentinite diapirism in the Calabrian Arc subduction complex
A. Polonia 1, L. Torelli2, L. Gasperini1, L. Cocchi 3, F. Muccini3, E. Bonatti1,4, C. Hensen5, M. Schmidt5, S. Romano 1, A. Artoni 2& M. Carlini 2
Mantle-derived serpentinites have been detected at magma-poor rifted margins and above subduction zones, where they are usually produced byfluids released from the slab to the mantle wedge. Here we show evidence of a new class of serpentinite diapirs within the external subduction system of the Calabrian Arc, derived directly from the lower plate.
Mantle serpentinites rise through lithospheric faults caused by incipient rifting and the col- lapse of the accretionary wedge. Mantle-derived diapirism is not linked directly to subduction processes. The serpentinites, formed probably during Mesozoic Tethyan rifting, were carried below the subduction system by plate convergence; lithospheric faults driving margin segmentation act as windows through which inherited serpentinites rise to the sub-seafloor.
The discovery of deep-seated seismogenic features coupled with inherited lower plate ser- pentinite diapirs, provides constraints on mechanisms exposing altered products of mantle peridotite at the seafloor long time after their formation.
DOI: 10.1038/s41467-017-02273-x OPEN
1Institute of Marine Sciences CNR ISMAR-Bo, Via Gobetti, 101, 40129 Bologna, Italy.2Department of Chemistry, Life Sciences and Environmental Sustainability, University of Parma, Parco Area delle Scienze, 157/A Parma, Italy.3Istituto Nazionale di Geofisica e Vulcanologia, via di Vigna Murata 605, 00143 Rome, Italy.4Lamont-Doherty Earth Observatory of Columbia University, Palisades, NY 10964, USA.5GEOMAR Helmholtz-Zentrum für Ozeanforschung Kiel, Wischhofstrasse 1-3, 24148 Kiel, Germany. Correspondence and requests for materials should be addressed to
A.P. (email:alina.polonia@ismar.cnr.it)
1234567890
T
ectonic activity in subduction-rollback convergent plate boundaries commonly involves backward migration of subducting slabs, arc magmatism, and plate boundary segmentation. Incipient collision, the presence of indentors, and generally lower plate topography may increase complexity and plate fragmentation. Slab tearing has a major role in developing segmented subduction zones, in particular in narrow slab seg- ments1, triggering asthenospheric upwelling, dynamic topo- graphy2, and magmatism3,4.The origin of the Ionian Sea is related to the opening of the Neo-Tethys basin5, which has now mostly disappeared below the Alps/Apennines. An exceptionally thick sedimentary cover (up to 6–8 km) and the lack of detailed magnetic anomalies makes it difficult to define the nature of the Ionian Sea crust, which has been interpreted as either oceanic6–8or oceanic/severely stretched continental9,10, or thinned continental11–13.
Consumption of the Neo-Tethys lithosphere since Oligocene times has caused the emplacement of the Calabrian Arc (CA), a narrow and arcuate subduction system (Fig.1) related to Africa/
Eurasia plate convergence, and to the southeastward retreat of the Tethyan slab14. Convergence generated a 10–30 km-thick, 300 km-wide subduction system, including a submarine accre- tionary wedge15. The migrating Calabria trench drives the entire subduction complex outward, but different boundary conditions
produce segmentation in two distinct lobes, with different structural and morphotectonic characteristics (Fig. 1). The east- ern lobe (EL) collides with the Hellenic subduction system and produces basement-involved tectonics similar to a fold and thrust belt15, whereas the western lobe (WL) is free to spread into the abyssal plain of the Ionian Sea (Fig.1) through frontal accretion and offscraping processes16.
Two oppositely dipping fault systems, i.e., the Ionian fault (IF) and Alfeo-Etna fault (AEF), deform the WL offshore Eastern Sicily (Fig.1) along a complex strike-slip/transtensional pattern15,17. These two systems mark the external boundary of a wide deformation zone including three additional faults (F1, F2, and F3; Fig. 1) and they might be the source of major earthquakes in the CA18. Trans-tensional deformation and deep fragmentation of the Western Ionian domain19–21are in agreement with geodetic mea- surements22, suggesting that Calabria is moving SE and Southern Sicily is moving South in an Apulia-fixed reference frame. Moreover, mechanical/numerical models taking into account geometry and strength contrast across the Neo-Tethyan passive margin and major faults, suggest that pre-existing fracture zones and transform faults controlled the subsequent Ionian margin segmentation17. In this context, the NW portion of the IF corresponds to basement defor- mation associated with slab tearing, whereas the AEF might be the result of regional scale dextral shearing.
14° 15° 16° 17° 18° 19°
35°
36°
37°
38°
39°
400 300
200
100
50
Eurasia
Africa
Thyrrenian Sea
Ionian sea
Sirte Gulf
F1
F3 F2
Contractional belt Extentional belt
Sicily channel
WESTERN LOBE(WL)
EASTERN LOBE (EL)
Ionian abyssal plain Outer deformation front
Outer deformation front Post-Messinian wedge
Mediterranean Ridge Mt. Etna
Calabria Tindari
0 50 100
km Alfeo
Mt.
Tyrrhenian Sea
Hyblean plateau
Pre-Messinian wedge
Strike slip fault Thrust fault Transpressive fault
Normal fault
Deformation zone of the IF and AEF systems Morphotectonic lineaments
Alfeo-Etna fault system
Ionian fault system Sicily
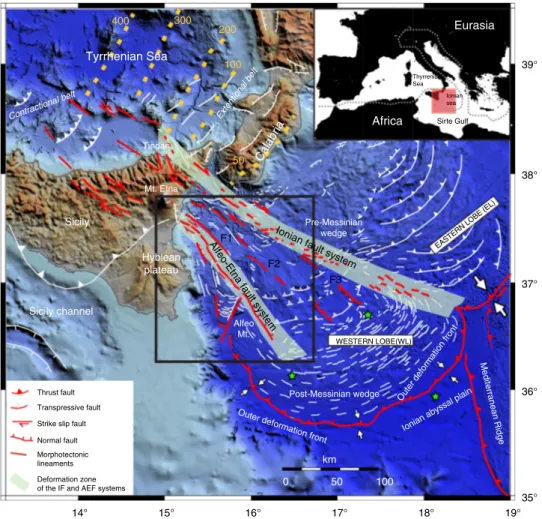
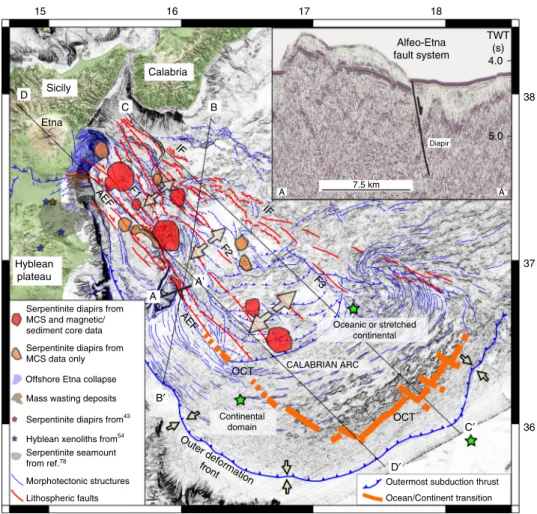
Fig. 1Geodynamic setting of the study area represented by the black box and the red area in the inset map. The structural model is modified from ref.17. Red lines: major faults absorbing plate motion; white lines: second order faults. The north-western (NW) ward dipping subducting slab of the African plate is represented by yellow iso-depth lines in the Tyrrhenian Sea. Major structural boundaries, active faults and extent of structural domains are indicated. The continental margin is segmented along the Ionian fault (IF) and Alfeo-Etna fault (AEF) systems whose deformation zone is represented by a light blue pattern. F1, F2, F3: transtensional faults belonging to the wide corridor of deformation between the AEF and IF17. White arrows represent shortening along the outer deformation front (higher rates in the EL) of the subduction systems. Green stars: location of OBSs used for velocity models of the lithosphere26
Seismic reflection profiles integrated with multibeam and potential field data reveal 13 sub-circular magnetic bodies beneath the seafloor aligned along transtensional faults seg- menting the continental margin. We investigated the nature of such bodies within the accretionary wedge, their link with Mesozoic paleoceanography and with the latest Quaternary extensional phase that disrupted the subduction complex. Our multidisciplinary approach suggests that the diapirs are made of inherited Mesozoic Tethyan serpentinites, which rise along transtensive faults controlling rifting processes perpendicular to the subduction arc. They provide thefirst example of serpentinite diapirism from the lower plate in a subduction system. Mantle- derived serpentinites combined with geophysical data suggest that the ocean-continent transition (OCT) in the Ionian Sea has a complex geometry reflecting the 90° curvature of the continental margin. Oceanic crust, if present, should be limited to the inner accretionary wedge of the subduction complex and the AEF should be located close to the Mesozoic Tethyan OCT and/or to a major transform fault.
Results
Rifting and diapirism along the AEF system. Multibeam, seis- mic reflection, magnetic, and gravityfield data call for incipient deformation of four areas marked by buried sub-circular features aligned along the AEF (Fig. 2). Area-1 is offshore Mt. Etna, whereas Area-2 and -3 are located north and northeast of Alfeo Seamount; the more distal Area-4 is located on a slope terrace of the accretionary complex. Deep deformation in these areas is imaged by seismic reflection lines showing sediment tilting and up warping around acoustically blind nuclei (Fig. 3). More information can be found in Supplementary Figs.1–7. Multibeam
data show sub-circular seafloor patterns, marked by increased roughness particularly in Area-2 (Fig. 2).
Deep penetrating multichannel seismic lines collected in Areas- 1 and -2 (Fig.3) run across the subsiding WL of the subduction complex, from the Malta escarpment to the IF, and image crustal trans-tensional faults segmenting the accretionary wedge. The AEF forms at the boundary between the salt-bearing complex emplaced after the Messinian salinity crisis and the older wedge consisting of clastic sediments (Fig.3b). This fault system served as main thrust fault during Messinian time, when frontal accretion resumed after the desiccation of the Mediterranean Sea15, and later accommodated transtensive deformation, as indicated by a syn-tectonic sedimentary basin in the footwall (Fig. 3b). Corresponding to the AEF, the basal detachment is disrupted, displaced and associated with large 10–20 km-wide diapirs. A reflector at about 13 s two-way travel time (TWT) in seismic line ETNASEIS 6 and 11 s (TWT) in lines CA-A is interpreted as the Moho (Fig. 3a, b). Arching and disruption of deep reflectors in correspondence to the diapiric structures suggest that the source region is deep and below the detachment.
Rising material in subduction complexes might be ascribed to different processes, such as salt/mud diapirism, magmatic intrusions, and serpentinite diapirism. We attempted to dis- criminate between these processes by gravity and magnetic modeling (Supplementary Fig.8). A salt source for the diapirs can be excluded because no thick salt was deposited in the inner wedge during Messinian times15, and because the source of the rising material is deeper than the Messinian salt layer (Fig. 3).
Moreover, salt and mud diapirs would not cause positive magnetic anomalies; gravity modeling also excludes a mud composition for the diapirs (Supplementary Fig. 8). As these structures are aligned offshore Mt. Etna, an origin related to
15°
15°
16°
16°
17°
36° 36°
37°
38°
Area1
35 36
29 18 c Fig. 3a
Fig. 3b Fig. 3c
a b
d Mt. Etna
Calabria
Sicily
Hyblean plateau
17
Area2
Area3
Area4
0 5
km Core-b
Core-a
0 50
km
nT 400
–400 –200 0 200
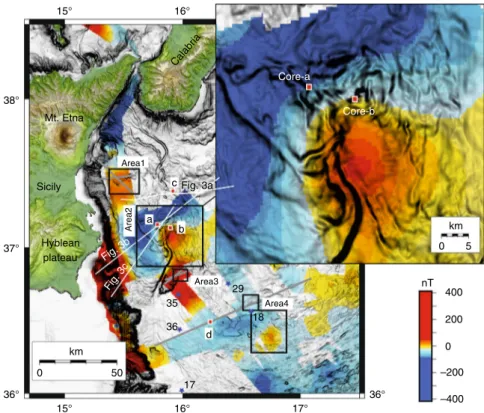
Fig. 2Magnetic anomaly map derived from this study superimposed over a gray levels bathymetric slope map. The four major areas of mantle diapirism described in this work are indicated (black squares 1–4). The inset highlights the rough seafloor topography of Area-2, which corresponds to the magnetic anomaly. White lines correspond to MCS data shown in Fig.3, whereas gray lines are shown in the supplementary material. Blue stars represent heatflow measurements from ref.23(17: 15.7±1.9 mW m−2; 18: 16.2±2.7 mW m−2; 29: 26.1±5.2 mW m−2; 35: 30.3±5.0 mW m−2; 36: 34.4±4.0 mW m−2). Red squaresa–drepresent gravity cores described in the manuscript (Fig.7) and Supplementary Figs.9–12
magmatism needs to be explored. However, magnetic and gravity anomalies are not consistent with a volcanic or magmatic source (Supplementary Fig.8) in agreement with heatflow data showing a lower than normal thermal regime for the Ionian basin (mean heat flow value is 31.8±5.0 mW m−2 23) (Fig. 2). As the basal detachment of the subduction system is deformed and segmented in correspondence with these diapirs (Fig.3), we argue that the source of the rising material is below the detachment; thus, a possible serpentinite composition for the diapirs was investigated (Fig.4).
Joint interpretation of magnetic and gravity data has been achieved computing a 2.75D forward modeling crossing the
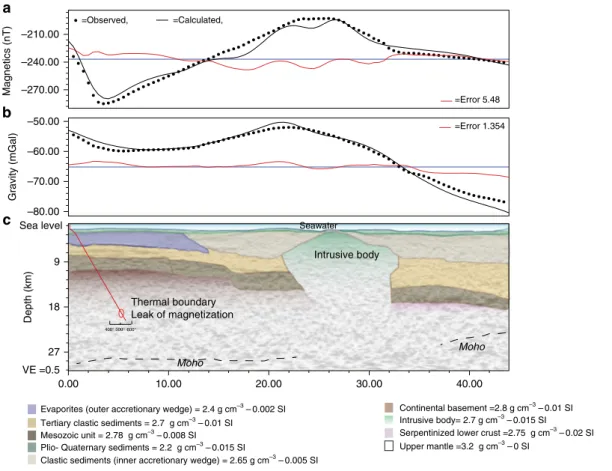
diapir in Area 2. The forward model was geologically constrained in depth through seismic data. The 2.75D forward model was approached redrawing the geometry of sedimentary sequences directly in TWT sections. Time–depth conversion was achieved assuming reliable seismic velocities for each block (Fig.4). The bestfit (5.48 nT and 1.354 mGal for magnetic and gravity errors, respectively) was obtained modeling the intrusion as a serpentine diapir with low magnetization (0.015 SI) and density 2.7 g cm−3 24. Magnetic modeling was limited in depth considering a thermal boundary approximately at 16–17 km estimated assuming a linear increase along a normal thermal gradient.
?
20 km M
M M
Malta Escarpment
Post-Messinian Accretionary Wedge
Pre-Messinian Accretionary Wedge Alfeo-Etna Fault
?
SW NE
2 3 4 5 6 7
TWT (s)
sp 2,000 1,900 1,800 1,700
c
10 km
12,000 11,500 11,000 10,500 10,000 9,500
Detachment
Alfeo-Etna Fault Ionian Fault system
Pre-Messinian Accretionary Wedge Post-Messinian
Accretionary Wedge
Moho ?
0 2 4 6 8 10 12
b sp
Malta Escarpment
TWT (s)
SSW NNE
100 500
1,000 1,500
2,000
0 2 4 6 8 10
12 14
TWT (s)
WSW ENE
Malta Escarpment
Moho ?
Detachment Alfeo-Etna Fault
Ionian Fault system Pre-Messinian Accretionary Wedge
sp
10 km
a
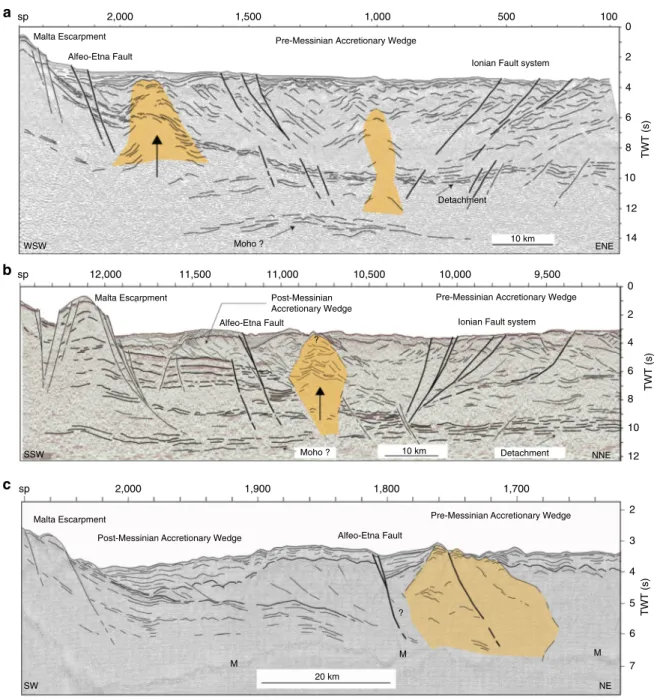
Fig. 3Line drawings of time migrated MCS lines used for structural reconstructions in Areas-1 and -2. Location of seismic profiles is shown in Fig.2.
Yellow/brown pattern: diapiric features.aETNASEIS-6 MCS line collected orthogonal to the continental margin SE of Etna. This line crosses the entire WL of the accretionary wedge intercepting both the Alfeo-Etna and Ionian faults. Such faults control extensional processes, which are associated with a shallower Moho at about 11 s TWT. A second diapiric feature is present in the centre of the rifting zone.bCA-A MCS line collected across the WL of the Calabrian Arc subduction complex orthogonally to the AEF. A reflector at about 11 s TWT is interpreted as the Moho reflection.cMS-26 MCS line across the AEF north of the Alfeo Seamount. M, multiple. The diapir corresponds to a very rough seafloor morphology. Bold lines: major trans-tensional faults controlling rifting processes
Combined P- and S-wave velocity profiles are required to assess whether the seismic structure derived from deep penetra- tion multichannel seismic and potentialfield data are compatible with a variable abundance of mafic and mantle-derived serpentinite25. P- and S- wave profiles are available in the southern region of the diapiricfield26. Simultaneous inversion of P- and S-wave arrival times, collected during a 3-year ocean bottom seismometer/hydrophone (OBS/H) monitoring campaign (Fig.5green stars), yields one-dimensional (1D) P- and S-wave velocity models for the Ionian lithosphere. The 1D model indicates the presence in the Ionian upper mantle of two layers with high seismic P-wave velocity, low S-wave velocity, and high Vp/Vs values, interpreted as partly serpentinized peridotites with 55–65% and 15–25% serpentinization, respectively26. These values of Vp/Vs for serpentinites are in agreement with data in the literature25 and the degree of serpentinization is similar to that derived from gravity and magnetic data. Serpentinization of peridotites produces an increase in susceptibility, because magnetite forms during serpentinization by the breakdown of the iron-rich olivines27,28. Serpentinization is also responsible for a density decrease, which follows a linear trend related to the degree of alteration27. Considering that serpentinization modifies the physical parameter of the original peridotites, we use our forward model to deduce degrees of serpentinization. According to our model the density of the intruded body is of the order of 2.7 g cm−3 with susceptibility of 0.015 SI, suggesting a serpenti- nization of about 75%29 and 68%28, respectively. These values, obtained by two independent data sets, are similar to those
obtained from Vp/Vs data26, supporting our hypothesis of serpentinite intrusions below the Ionian seafloor.
Comparing these results with our pre-stack depth migrated multichannel seismic data in the same region we find a good correlation between Vp/Vs-derived serpentinite layers and our interpretation of the Ionian lithosphere. In particular, the two serpentinite layers derived from the Vp/Vs datafit well with the source area of the diapirs (Fig.6b). The geometry and rooting in the Moho of the diapirs combined with the two high Vp/Vs layers at the same source depth support a serpentinite origin for the rising material.
Pore water geochemistry. Pore water data from mud volcanoes and other fluid dewatering features are a common tool to con- strain subsurface geochemical processes30–32. To check for potential geochemical anomalies that may be related to the advection of deep-source fluids, pore waters from gravity cores were analyzed from above the diapiric structure and compared with a reference site (core d) outside this range (Fig. 7 and Supplementary Figs.9–12).
Core a and core c from above the diapiric structures show deviations from normal diagenetic trends. Specifically, depletion in elements such as Cl behaving conservatively under normal diagenetic conditions, suggests freshening of pore water, e.g., caused by (clay) mineral dehydration. This freshening is typically associated with enrichment of fluid mobile elements, such as Li, B, and Sr31,32. Core c shows a significant (10%) depletion in chlorinity and a decrease in SO4and Ca, both indicating that a major horizon of anaerobic oxidation of methane is present a few
Mesozoic unit = 2.78 g cm–3 – 0.008 SI
Continental basement =2.8 g cm–3 – 0.01 SI Intrusive body= 2.7 g cm–3 – 0.015 SI Serpentinized lower crust =2.75 g cm–3 – 0.02 SI Upper mantle =3.2 g cm–3 – 0 SI
VE =0.5
Depth (km)
27 18 9 Sea level
Moho Moho
400°500°600°
Seawater
Intrusive body
Gravity (mGal)
–80.00 –70.00 –60.00 –50.00
Magnetics (nT) –270.00
–240.00 –210.00
=Observed,
=Error 1.354
=Error 5.48
=Calculated,
a
b
c
0.00 10.00 20.00 30.00 40.00
Thermal boundary Leak of magnetization
Evaporites (outer accretionary wedge) = 2.4 g cm–3 – 0.002 SI Tertiary clastic sediments = 2.7 g cm–3 – 0.01 SI Plio- Quaternary sediments = 2.2 g cm–3 – 0.015 SI
Clastic sediments (inner accretionary wedge) = 2.65 g cm–3 – 0.005 SI
Fig. 4Forward magnetic and gravity modeling.aObserved, calculated, and misfit (error) curves for magnetic modeling along seismic line CA-A (Fig.3b).
bObserved, calculated, and misfit (error) curves for gravimetric modeling along seismic line CA-A (Fig.3b).cGeometry of causative rocks derived from depth-migrated seismic section used as background. Averagefitting errors were 5.48 nT (5.5 %) and 1.354 mGal (2.5 %), for magnetic and gravity profiles, respectively. Red line identifies the depth distribution of the local geothermal gradient
meters below the seafloor. In addition, core-a and core-c show enrichment in dissolved Sr above background values. However, as Sr-enrichment is not accompanied by a freshening trend in both cores and B and Li are not enriched, other processes such as Sr- release from recrystallized carbonates32can be suggested. Similar geochemical anomalies have been found influids emanating from serpentinite mud volcanoes in the Mariana subduction zone, where slab-derived fluids drive serpentinization and mud volcanism33,34. However, serpentinization does not produce a direct typical geochemical signature in sedimentary environ- ments, given variables as composition of the sourcefluid, nature of ambient sediments, reaction temperatures, etc., causing a wide range of potential variations.
In summary, the observed pore water signature indicates active fluid migration related to subsurface dewatering and associated processes. This is confirmed by sediment facies analyses showing fluid flow related features such as patchy cloudy facies35, sediment layers disruption, mud injections, and vertical fluid paths (Supplementary Fig.10).
The CA subduction system is close to a continental collision that causes margin segmentation and disruption of the subduction system driven by pre-existing heterogeneities in the forearc basement17. Crustal velocity models obtained from deep seismic sounding (DSS) data12account for a Moho depth decreasing from
about 35 km in the EL, to some 20 km in the WL, close to the Malta escarpment. Moho depth variations occur in the region between the AEF and IF, where our seismic reflection profiles (Fig.3) show a Moho shallower than in the surrounding regions, in agreement with other evidence, suggesting a depth between 12 and 15 km10. This geometry suggests an asymmetric rifting affecting a large corridor between the AEF and IF, and the collapse of the WL of the accretionary wedge. Thus, the AEF may represent the western master fault accommodating plate divergence along a dextral shear zone, triggering serpentinite diapirism.
Differences in plumbing systems and hydrogeological char- acteristics of forearc basements may trigger contrasting processes in different forearcs, includingfluidflow and mud volcanism (i.e., Nankai Trough or Mediterranean Ridge36) or serpentinite diapirism (Izu-Bonin forearc37–39), whereas impermeable and consolidated sediments tend to inhibit fluid circulation (Japan Trench40). The CA, the narrowest subduction system on Earth, hosts both processes: mud volcanism in the EL35,41,42, serpenti- nite diapirism in the WL (this study), as well as on the Hyblean Plateau close to the AEF onland43.
15 16 17 18
36 37 38 B
C
A A’
Continental domain Etna
C′ B′
IF
AEF
IF AEF
Outer deformation front
Ocean/Continent transition Outermost subduction thrust Morphotectonic structures
Serpentinite diapirs from MCS and magnetic/
sediment core data Serpentinite diapirs from MCS data only
Mass wasting deposits Offshore Etna collapse
Serpentinite diapirs from43
Serpentinite seamount from ref.78
Hyblean xenoliths from54
Lithospheric faults
CALABRIAN ARC
OCT OCT
F1
F2
F3 Hyblean
plateau
Calabria Sicily
D
D′ 7.5 km
4.0
5.0 TWT
(s)
A A’
Alfeo-Etna fault system
Diapir
Oceanic or stretched continental
Fig. 5Structural map of the Western Calabrian Arc subduction complex with distribution of tectonically controlled serpentinite diapirs. Faulting associated with arc-perpendicular extensional tectonics in the accretionary wedge (modified from ref.17) provides an opportunity forfluids to be introduced deep into the underplating plate. A-A’: MCS line CALA-02 across a diapir in the sedimentary basin formed along the Alfeo-Etna fault. A diapiric intrusion of serpentinite bearing clayey material in the Hyblean plateau suggests affinity of clays with hydrothermally modified mafic and ultramafic rocks forming the Hyblean lower crust43,78. Sections B-B’and C-C’are shown in Fig.6, section D-D’in Fig.8. Green stars: OBS/H stations used for P- and S-wave velocity model for the Ionian lithosphere26. AEF, Alfeo-Etna fault; IF, Ionian fault; OCT, Oceanic-Continent transition. F1, F2, F3, transtensional faults belonging to the AEF-IF deformation zone17
Discussion
Mantle-derived serpentinites are found along slow to ultraslow spreading ridges, at magma-poor rifted margins and at subduc- tion zones, where the downgoing plate may trigger arc magma- tism or hydrate the deep Earth44–46. We suggest three possible scenarios for serpentinite emplacement in the Ionian Sea: during Pleistocene shear processes andfluid migration along the AEF; as a consequence of CA subduction; or during the formation of the Tethyan Ocean.
Diapirs alignment along the AEF suggests a direct link between tectonic activity and uprising of low-density material. However, we exclude that serpentinites formed in Pleistocene times since serpentinization is not limited to the fault zone, as indicated by velocity models of the lithosphere26(Fig.6). Tectonic dilatation in the rifting zone of the western Ionian Sea may trigger downwards fluidflow driving mobilization of serpentinites inherited from the Mesozoic ocean (Figs. 6 and 8) and already emplaced in the underplating African plate.
A different scenario for serpentinite emplacement includes the mantle wedge at the subduction zone, possibly hydrated by the subducting plate. However, this scenario is unlikely in our region, because of the external position of the diapirs not far from the African foreland, in an area where the slab is rather shallow (Fig.5). Velocity models for the Ionian lithosphere26, suggest two upper mantle layers (3.3 and 5 km thick, respectively, at 8 and 16 km depth), with high Vp/Vs ratio (1.95–2.1), interpreted as due to partly serpentinized peridotites26. The high Vp/Vs ratio suggests low pressure-low temperature serpentinization47, dif- ferent from that inferred usually for subduction settings. Ser- pentinites may thus characterize the basement of the southern Ionian Sea in a region as wide as hundreds km2at the transition with the African foreland.
If serpentinites are inherited from the Tethyan ocean, they are Mesozoic in age, and could have developed along fractures located near the boundary between the oceanic crust and the adjacent thinned continental crust, a situation similar to that observed west of the Galicia Bank along the Iberian margin24,48,49. Serpentinization of peridotites is due usually to hydrothermal processes andfluid circulation associated with early stages of accretion during rifting. As the sub- Ionian Sea crust has never been sampled and its nature never unambiguously defined, we cannot exclude that this part of the Ionian basin formed after tectonic extension and exhumation of a continental mantle causing serpentinization andfluidflow. In magma-poor margins, crustal faulting and mantle serpentinization are believed to occur when the crust becomes entirely brittle after a certain amount of extension50. In both scenarios, the AEF would represent a major Mesozoic tectonic discontinuity. Formation of serpentinites, regardless of geodynamic setting, is thus a consequence of lithospheric mantle exhumation as a result of a bulk pure shear, or related to Mesozoic rifting that brought the Moho and upper mantle rocks close to the surface. In any case, serpentinization could take place if suitable fluid pathways existed, with faults cutting down from the seafloor to the mantle44; the AEF may represent one such major discontinuity.
Interesting inferences can be obtained from xenoliths sampled from basalts and diatremes of the Hyblean Plateau (SE Sicily) East of the study region (Fig.5). The Hyblean Plateau has been con- sidered traditionally an uplifted portion of the Africa continental plate51,52. However, among the abundant lower crustal/upper mantle Hyblean xenoliths, none are of sub-continental deriva- tion53. Hyblean xenoliths include serpentinized harzburgites with a relict primary spinel Cr number between 0.25 and 0.30; this and other geochemical indicators are within the range of oceanic
Ionian fault system
Ionian fault system
Rifting zone
Fluid condutis
Fluid condutis
Alfeo-Etna fault system
OCT km
5
10
15
km 5
10
15
20 Salt-bearing accretaionary wedge
Salt-bearing accretionary wedge
Basement
Basement
Serpentinized unit S1
Serpentinized unit S2
Basal detachment
Basement Serepentinized unit S1 Serepentinized unit S2
Mantle
Mantle
Underthrusting plateUnderthrusting plate
10 km
25 km
?
?
?
Upper plateUpper plate
B′ B
C OCT C′
1.6 1.8 2.0
Vp/Vs
a
b
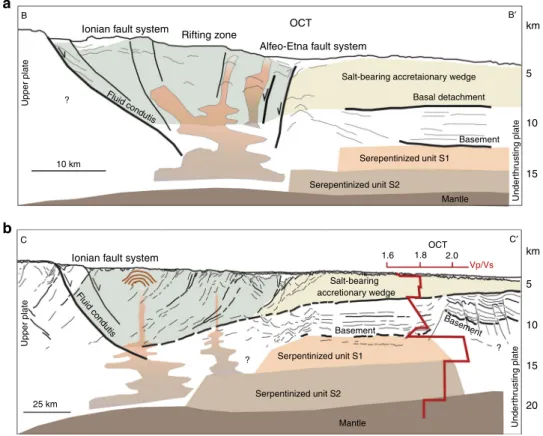
Fig. 6Structural cross-sections of the continental margin.aSketch based on MCS line MS-107 showing the margin structure parallel to the arc where lithospheric transtensive faults trigger the rise of serpentinite material from the lower plate.bSketch based on MCS line CROP-M2B showing the margin structure orthogonal to the arc where the geometry of the subduction thrust is imaged. The presence of serpentinite units and Vp/Vs data in the outer part of the subduction complex is taken from26. OCT, Oceanic-Continent transition. Location of seismic sections in Fig.5
peridotites53, suggesting that the lower crust may include bodies derived from an ancient oceanic domain54. Some Hyblean xeno- liths consist of metasomatized gabbroic rocks of lower crustal origin probably derived from an oceanic or OCT environment54. Hydrothermal modification of xenoliths suggests that serpentinite- hosted hydrothermal systems54, typical of slow and ultra-slow spreading ridges, were active since the Middle Triassic, as deduced from U/Pb ages of hydrothermal zircons55. These results, backed by geophysics56,57, suggest a serpentinized oceanic-type lithosphere beneath the Hyblean Plateau and may imply some connection between sub Ionian Sea and sub Hyblean lithosphere.
Based on the P-wave velocity model proposed for southeastern Sicily56, petrological evidence for the lithosphere beneath the Hyblean Plateau and the occurrence of serpentinized harzburgite xenoliths in Hyblean diatremes were used to estimate the degree of serpentinization53. The resulting values are in line with the presence of peridotites affected by different degrees of serpenti- nization (35–100 vol.%) at 8–19 km depth, with the Moho dis- continuity as a serpentinization front at about 19 km53 in agreement with results from the Ionian Sea26, further stressing a connection between the Ionian and Hyblean lithosphere.
Serpentinite diapirs below the Ionian Sea would have impor- tant implications to reconstruct the geometry and processes that have driven Tethyan ocean rifting. Our reconstruction, pointing towards mantle serpentinization coeval with Tethyan rifting, should be considered in the frame of Mesozoic paleogeography.
Widespread serpentinites suggest that the Tethyan Ocean, at least in this domain, was not a magma-rich basin; serpentinization may have occurred along the OCT or may represent the product of hydration of exhumed mantle. Accordingly, the AEF may represent one of the shear zones where extension was focused,
similar to the Magnaghi and Vavilov sub-basins of the Tyr- rhenian Sea, where tensional faults favor mantle exhumation and percolation of water in the deep crust58. Alternatively, if the Tethyan basin was floored by oceanic crust, the AEF might represent the OCT where the crust was thin enough to become entirely brittle during rifting, as in the Porcupine Basin and Galicia margin24,44,49. Gravity data (Supplementary Fig. 13) provide evidence of OCT geometry. We suggest that gravity highs marking the AEF trend and basement topography below the accretionary wedge16 (Figs. 2 and 6) represent the transition between continental and oceanic or continental stretched domains (Fig.5and Supplementary Fig. 13). The complex geo- metry of the OCT reflects the 90° curvature of the continental margin close to the Sirte gulf (Fig. 1). In this reconstruction, oceanic crust, if present, should be limited to the inner accre- tionary wedge of the subduction complex and the AEF should be located close to the Mesozoic Tethyan OCT (Fig.5).
Our reconstruction suggests that diapirism of inherited ser- pentinites occurs along active transverse shear zones segmenting the CA subduction complex, which thus controls structural development andfluidflow. Mt. Etna volcano is aligned with the serpentinite diapirs; its volcanism appears to be linked to active extensional tectonics, because the volcano is located on the NW tip of the AEF and has the same age of the inception of trans- tensional deformation in this sector17. Although Multi-Channel Seismic (MCS) data suggest that both the AEF and IF develop over structural boundaries inherited by the Mesozoic Tethyan basin, their recent tectonic activityfits with the latest Quaternary extensional phase. In fact, fault inception along the AEF produced the down throw of the WL and the formation of sedimentary basins, filled by up to 700–800 m-thick sediments (Fig. 3b s.p.
Cl– (mM)
Li (μM) Sr (μM) B (mM)
Ca (mM)
500 0 10 20 30 40
0 10 20 30 40 50 0 100 200 0 0.25 0.75
Core a Core b Core c Core d
0.5 1
0 5 10 15
0 600
200
400
Depth (cm)
600
800
0
200
400
Depth (cm)
600
800
700
SO42– (mM)
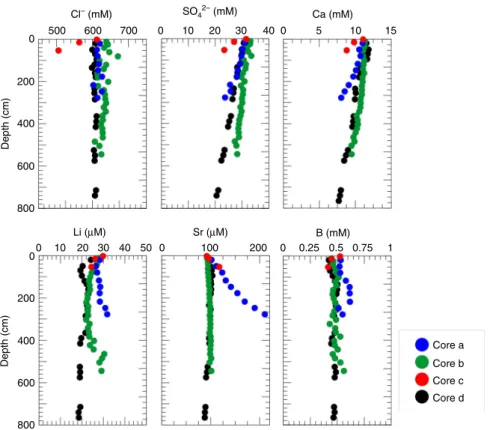
Fig. 7Depth profiles of selected pore water constituents in the sediment cores. Core a: SF17-04; core b: GH15-03; core c: SF17-05; core d: CQ14-02 (reference core not affected by diapirism). Core a and c from above the diapir show deviations from normal diagenetic trends (core d). In both cores, pore water Sr concentrations increase continuously with depth; in core a, this trend is accompanied by depletion in Cl (and other elements that typically behave conservative at this depth below the seafloor). These geochemical anomalies provide evidence forfluid advection (affected probably by mineral dewatering and other deep-seated geochemical processes) and suggest a direct relation to the observed diapirism. Core location in Fig.2
11,200). This observation was used to reconstruct the age of the fault assuming a sedimentation rate derived from sediment cores collected in the region18,59, indicating that 700 m-thick sediment
along the AEF might correspond to 350,000–700,000 years, in agreement with the age of Mt. Etna volcano60. This connection between large-scale offshore tectonic processes and the formation
D
D
D′ N
D′
Continental?
Ionian basin km
5 10 15 20 25
?
?
? OCT
WL EL
Calabria
Oceanic?
Wide corridor of transtensional
deformation Continental cr
ust
Ionian slab
Slab rollback Ionion lithosphere
AEF
OCT Serpentinized unit S1
Serpentinized unit S2 D
Vp/Vs1.6 1.8 2.0
D′ km
0
5
10
15
20
25
Mantle
Continental crust Oceanic crust Serpentinized uniy S1 Serpentinized uniy S2 Mantle
Pre-Messinian accretionary wedge Post-Messinian accretionary wedge Incipient new plate boundary
Serpentinite diapirs Thrust faults
Strike slip faults Extension Shortening Slab rollback driven
astenospheric upwelling62
Mt. Etna Serpentinite diapir field
Post-Messinian salt-bearing accretionany wedge
Pre-Messinian accretionary wedge
Astenospher
ic windo w AEF
IF
Mt. Etna Sicily
Serpentinize d layer Serpentinize S1
d layer S2
a
b
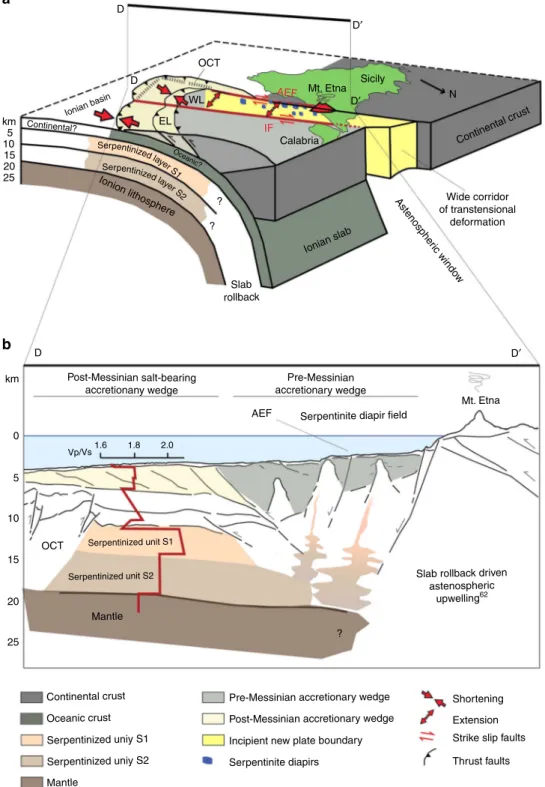
Fig. 8Schematic block diagram and cross section of the Western Calabrian Arc.aBlock diagram of the Western Calabrian Arc subduction complex showing relationships between deep slab, transtensional faults, serpentinite diapirs, and Mt. Etna volcano (modified from refs.62,69). Faulting associated with arc-perpendicular extensional tectonics in the accretionary wedge (modified from ref.17) is shown in the yellow corridor between the Ionian and Alfeo-Etna fault systems. Extensional processes and associated Mt. Etna volcanism could be related to vertical upwelling of the asthenosphere at the SW lateral edge of the Ionian slab62,63,79. At the edges of a retreating slab the toroidal component of asthenosphericflow may induce an upwardflow and decompression melting which could explain the formation of Mt. Etna2. Transtensional processes along the rifting zone between the Alfeo-Etna and Ionian fault may drive inherited serpentinite diapirism during slab tearing processes.bSketch of the margin structure orthogonal to the arc based on interpretation of available multichannel seismic and Vp/Vs data26. Section D-D’(location also indicated in Fig.5) crosses the Calabrian Arc accretionary wedge, the inherited serpentinite diapirfield, and Mt. Etna implying structural control on both diapirism and Mt. Etna formation. AEF, Alfeo-Etna fault; EL, eastern lobe of the accretionary wedge; IF, Ionian fault; OCT, Oceanic-continental transition; WL, western lobe of the accretionary wedge
of the volcano appears thus to be supported also by the age of transtensive reactivation along the AEF, which might indicate a primary role played in Mt. Etna volcanism by a Pleistocene geodynamic re-organization.
Etna Na-alkaline geochemistry61does not indicate a deep slab magma source, as in the Aeolian K-alkaline magmatism of the southern Tyrrhenian. It may be related to a subduction rollback driven vertical ‘slab window’ that might explain its alkaline chemistry and the anomalous external position of the volcano, not derived from the mantle wedge but in some way related to the slab2,62,63. Moreover, recent Etnean basalts composition may reflect addition of fluids to the mantle source and/or selective crustal contamination12 occurring when the AEF shifted from compression with extension during Pleistocene17. This agrees with the voluminous melting under Mount Etna having origi- nated from below the African plate62. Although it cannot be excluded, there is no geochemical evidence for a direct role of serpentinites in the genesis of Mt. Etna volcanism. Boron isotopes of Mt. Etna lavas do not support a role of serpentinite-derived fluids in their genesis64. However, a major tectonic discontinuity has been invoked as leading to the formation of Mt. Etna17,19,64. This fault would represent a window allowing upwelling of asthenosphere from below the subduction system between the Ionian and Sicilian slabs62(Fig.8). On the other hand, shallow partial melting as a response to mantle decompression was sug- gested as a source of Mt. Etna magmas within the framework of
extensional tectonics65. Both scenarios (i.e., deep and shallow source) call for a major discontinuity, i.e., the AEF. Fluid addition along the fault coupled with a pressure drop might induce gen- eration of magmas with the peculiar geochemistry of Etnean lavas64. The same process along the wide corridor between the Ionian and AEFs might have triggered offshore inherited ser- pentinite diapirism.
Serpentinite diapirs in the Ionian Sea provide evidence on how altered mantle rocks may be transferred from rifting, to basin floor, to subduction66 where they can give rise to large scale diapirism, enhancing shear processes and margin disruption during the final closure of the ocean. In this reconstruction, lithospheric inheritance controls neotectonic activity and loca- tion/reactivation of tectonic structures, as also observed in Canada67or in the Eastern Mediterranean68. The transition from weak and stretched continental crust to the relatively strong oceanic crust appears to guide present day seismicity patterns as well as plate kinematic evolution of this region. It was suggested that serpentinites control the seismic or aseismic behavior of subduction zones38. Major historical earthquakes in the CA (i.e., the Messina 1908, Catania 1693, and Sicily 1169 earthquakes) were generated in an area close to the Ionian and AEFs18,69,70. Moreover, the distribution of seismicity and the lack of thrust- type earthquakes along the CA subduction complex in the Ionian Sea may be due to sub Ionian serpentinites influencing the mechanical coupling between plates as proposed for the Japanese Table 1 Acquisition parameters, processing sequence and resolution of geophysical data used in this study
Geophysical multi-scale data set
Acquisition parameters Main processing sequence Resolution in
space CROP MCS data set Source: 4,906 cubic inch air guns Full pre-stack depth-migration (PSDM), with
SIRIUS/GXT, Migpack software package.
km-scale Streamer: 4,500 m
Group interval: 25 m Shot interval: 62.5 m Coverage: 3,600%
Sampl. interval: 4 ms
ETNASEIS data set Source: air guns array Velocity analysis, stack, time migration km-scale Streamer: 2,400 m
Coverage: 2,400%
Mediterranean Sea (MS) MCS data set
Source: Flexotir (2 guns) Velocity analysys, stack, DMO, velocity analysis, stack, and migration
km-scale Streamer: 2,400 m
Group interval: 50 m Shot interval: 100 m Coverage: 1,200%
Sampl. interval: 2 ms ENI MCS lines CA-A, CA-B
and CA-C
Source: 3,400 cu inch air guns Velocity analysis, stack, migration n× 100 to km-scale Streamer: 6,200 m
Group interval: 12.5 m Shot interval: 37.5 m Coverage: 12,000%
Sampl. interval: 2 ms
CALAMARE MCS data set Source: 2 Sodera G.I. guns, Velocity analysis, stack, DMO, velocity analysis, stack, migration
× 100 m to km- scale
Streamer: 600 m Group int.: 12.5 m Shot interval: 50 m
Coverage: 600%
Sampl. interval: 1 ms
Sparker seismic data Source: 30 kJ Teledyne system nx100 m to km
scale Streamer: active section: 50 m, single channel
Shot interval: 4–8 s (12–24 m) Chirp data set 17 hull mounted 17 transducers CHIRP-
Benthos sonar system (3–7 KHz sweep frequency)
Data represented through variable density sections with instantaneous amplitude
Metric/decimetric
margin71. Low thrust-type seismic activity may be an indication that subduction and convergence is aseismic, or that plate motion is expressed by large earthquakes with long recurrence time intervals. Serpentinites, when thicker than 2–3 km, may form an efficientflow channel at the top of the subducting slab influencing seismogenesis72; this has to be taken into account for seismic hazard assessments in this densely populated region.
The discovery of serpentinite diapirs in the CA provides the first example of a new class of serpentinites in a subduction system derived directly from the lower plate through lithospheric extensional faults disrupting the accretionary wedge and driven by tectonic processes at the slab edge. These findings may lead towards a more complete understanding of the structure of the Ionian lithosphere, of the mechanisms exposing altered products of inherited mantle peridotite at the seafloor long time after their formation, and finally of the role of serpentinization in driving continental collision.
Methods
Multibeam data. The morphobathymetric map is derived from three datasets collected by ISMAR-CNR during different cruises onboard ofR/V CNR Urania, integrated by the 500 m grid DTM from CIESM/IFREMER Medimap group73. Swath bathymetry during theUraniacruises (2010, 2011, and 2015) was collected using a SIMRAD EM 302 Multibeam Echosounder. During those cruises, a keel- mounted probe provided real-time estimate for sound-velocity at the surface, whereas sound velocity profiles were performed daily to correct for density, salinity, and temperature variations in the water columns. Functioning of the multibeam echosounder was controlled by the Kongsberg software SIS, which provided data quality control and information for the survey plan. Multibeam data were subse- quently processed using Caris Hips and Sips suite software.
Seismic reflection data. A close-spaced grid of seismic reflection profiles, char- acterized by different penetrations and vertical resolutions, was used to define the structural setting of the CA subduction complex in the Ionian Sea (Supplementary Fig.1a). The deep structure was reconstructed from interpretation of MCS reflection profiles collected during different cruises (ENI-CA, Etnaseis, CALA- MARE and Mediterranean Sea—MS data sets), from the 70s to the 90s. Single- channel Sparker profiles (the J data set of ISMAR-CNR) were used for detailing shallow structure of key areas previously identified through the analyses of deep penetrating seismic data. Acquisition and processing parameters of each set of data are described in Table1.
Final data processing and visualization, as well as structural mapping was performed using SeisPrho software74, freely distributed athttp://software.bo.ismar.
cnr.it/seisprho.
We used all available seismic data (CNR_ENI Deep Crust Seismic Profiles—
CROP, ENI CA MCS seismic, MCS CALAMARE lines, Sparker J data set, and Chirp profiles), characterized by different vertical resolutions (Table1), to describe geometry and kinematics of the fault systems segmenting the western Ionian Sea.
Magnetic and gravimetric data. Shipborne magnetic data were acquired during CALAMARE08 cruise16using a SeaSpy Marine Magnetics magnetometer, towed 180 m astern of the vessel. Raw magnetic data were collected at 1 Hz sampling frequency, resulting in an average spacing between every single measurement of about 4 meters.
Positioning of the magnetic sensor was obtained by a FUGRO differential Global Positioning System (GPS) mounted onboard of theR/V Uraniaafter performing the layback correction. Despiking and low-passfiltering were applied to the raw data to attenuate high frequency noise. Magnetic anomalies were obtained removing the International Geomagnetic Reference Field (IGRF) geomagnetic referencefield. Final magnetic anomalies (Fig.2) were gridded using a minimum curvature method at 500 m grid cell size.
Gravimetric profiles were acquired along each CALAMARE08 seismic profile track using a LaCoste and Romberg AirSea Gravity System II at 1 Hz of sampling frequency. Gravity values were smoothed at 120 s by a low-passfilter, with an Exact Blackman Window. Drifting of the gravimeter was estimated at the beginning and end of the cruise; the average drift was below 0.2 mGal per day. Accuracy in positioning and velocity measures guaranteed 1 mGal accuracy in the gravity anomaly. Gravity meter readings were tied to an absolute gravity station in Naples, by using a portable model G gravity meter. Drift, Eötvös and Latitude corrections were applied to obtain the Free Air anomaly.
Quantitative interpretation of crustal properties below the CA-A seismic line track was obtained performing a 2.75D forward modeling, which allows geometry and density/susceptibility values of crustal bodies in strike direction to be defined.
Magnetic and gravity data were sampled along the CA-A track using 400 data points (about 10 sample per km). The model was constrained by geometries and
crustal features of major crustal bodies determined by seismostratigraphic interpretation of depth-migrated seismic sections. Seismic velocity of each stratigraphic interval was converted into density using Gardner’s equation75, which produced a preliminary set of values for subsequent re-adjustments. Best-fit between gravity and magnetic modeling was achieved byfine-tuning susceptibility and density values. Afterfixing the geometry of the diapiric body and the properties of the overburden, we tested the effect of different lithologies, including fine-grained clastic sediments, gabbroic cumulates, and a typical oceanic crust of slow-spreading domains. Wefinally observed that all realistic lithologies, alternative to that of serpentinized peridotites, provided different gravity and magnetic patterns relative to those observed in thefield (Supplementary Fig.8).
Pore water analyses. Pore water samples were extracted using Rhizones76from cooled cores. Concentrations of chloride and sulphate were measured by ion chromatography (METROHM 761). Acidified subsamples were analyzed by inductively coupled plasma optical emission spectrometry (VARIAN 720-ES).
Details on analytical methods applied routinely at GEOMAR are available athttp://
www.geomar.deor in publications31.
X-ray diffraction analysis of core GH15–03. The homogenized sediment sample A1 (Supplementary Figs.10and11) was split and air-dried, and glycolized sub- samples were analyzed by X-ray diffraction (Cu Kα, 3–70°, 0.02° steps). Mineral components and quantitative estimates were determined from the diffraction patterns, by using the software package XPowder.
Satellite-derived vertical gravity gradient. Vertical Gravity Gradient (VGG) data are from a global marine gravity model compilation77. CryoSat-2 and Jason-1 satellite missions provided high track coverage that enhanced the gravity anomaly signal within 12–40 wavelength band and a maximum resolution of 2 mGal. VGG computation permits to remove long wavelengths of gravityfield particularly related to large-scale Moho-isostatic effects77. Peculiar tectonic structures and specific seafloor fabric are visible in the VGG data, which highlight density var- iation at a frequency band typical of upper/middle crust. The VGG model com- puted starting from satellite gravity data permits to distinguish OCT’s geometry68, as well as relict ridge structures below thick crust77
Data availability. Data associated with this paper are available upon request (alina.
polonia@ismar.cnr.it).
Received: 17 February 2017 Accepted: 16 November 2017
References
1. Govers, R. & Wortel, M. J. R. Lithosphere tearing at STEP faults: response to edges of subduction zones.Earth Planet. Sci. Lett.236, 505–523 (2005).
2. Faccenna, C. et al. Topography of the Calabria subduction zone (southern Italy): clues for the origin of Mt. Etna.Tectonics30, TC1003 (2011).
3. Rosenbaum, G., Gasparon, M., Lucente, F. P., Peccerillo, A. & Miller, M. S.
Kinematics of slab tear faults during subduction segmentation and implications for Italian magmatism.Tectonics27, TC2008 (2008).
4. Schellart, W. P. Mount Etna-Iblean volcanism caused by rollback-induced upper mantle upwelling around the Ionian slab edge: an alternative to the plume model.Geology38, 691–694 (2010).
5. Frizon de Lamotte, D. et al. The southernmost margin of the Tethys realm during the Mesozoic and Cenozoic: Initial geometry and timing of the inversion processes.Tectonics30, TC3002 (2011).
6. de Voogd, B. et al. Two-ship deep seismic soundings in the basins of the Eastern Mediterranean Sea (Pasiphae cruise).Geophys. J. Int.109, 536–552 (1992).
7. Catalano, R., Doglioni, C. & Merlini, S. On the Mesozoic Ionian Basin.Geophys.
J. Int.144, 49–64 (2001).
8. Speranza, F., Minelli, L., Pignatelli, A. & Chiappini, M. The Ionian Sea: the oldest in situ ocean fragment of the world?J. Geophys. Res. Solid Earth117, B12101 (2012).
9. Makris, J., Nicolich, R. & Weigel, W. A seismic study in the western Ionian Sea.
Ann. Geophys. Ser. B4 B, 665–678 (1986).
10. Cowie, L. & Kusznir, N. Mapping crustal thickness and oceanic lithosphere distribution in the Eastern Mediterranean using gravity inversion.Pet. Geosci.
18, 373–380 (2012).
11. Cernobori, L., Nicolich, R., Petronio, L. & Romanelli, M. Crustal image of the Ionian basin and its Calabrian margins.Tectonophysics264, 175–189 (1996).
12. Continisio, R., Ferrucci, F., Gaudiosi, G., Lo Bascio, D. & Ventura, G. Malta escarpment and Mt. Etna: early stages of an asimmetric rifting process?Acta Vulcanol.9, 45–53 (1997).