Cite this:Phys. Chem. Chem. Phys., 2015,17, 30590
Dual-fluorescence pH probe for bio-labelling†
C. Richter,aC. Schneider,bM. T. Quick,aP. Volz,bR. Mahrwald,aJ. Hughes,c B. Dick,d U. Alexiev*band N. P. Ernsting*a
Although seminaphtorhodafluor (SNARF) dyes are already widely used to measure pH in cells and at biofilms, their synthesis has low yield and results in an unspecific position of a carboxy-group. The separation of 50- and 60-carboxy-SNARF reveals a pKa difference of 0.15, calling into question pH measurements with the (commercially available) mixture. Here we replace the bulky external dicarboxyphenyl ring with a propionate group and evaluate the spectral properties of the new derivative. Proceeding to the ethyl-iodoacetamide, covalent linkage to cysteine protein sites is achieved efficiently as shown with a cyanobacterial phytochrome, extending the scarce application of SNARF in bio-labelling in the current literature. Application in fluorescence lifetime imaging is demonstrated both with the lifetime-based and ratiometric-yield method.
1. Introduction
Xanthene-based ratiometric pH-probes have been used extensively in the investigation of pH in cells and at biofilms.1Fluorescein homologues are most commonly used, for example BCECF (Scheme 1) which was optimized for solubility.2–4 However, only their emission intensity and not the color is affected by protonation,
so that ps-time-resolved measurements of the fluorescence decay are often needed in quantitative pH experiments. For imaging one would prefer a dual emission band which reflects the protonated and deprotonated populations more directly.
This distinction can be achieved with ‘‘seminaphtorhodafluor’’
homologues like carboxy-SNARF.5–14Advantages of these dyes include a wide excitation range, fluorescence from both protonated and deprotonated forms, and a pKabetween them which is in the physiological range.
Several drawbacks currently prevent more widespread use of the SNARF probes mentioned above, however. (i) Their syn- thesis has low yield and results in an unspecific position (50or 60) of a second carboxy-group.5–7Note that the isomeric mixture is commonly used in the literature.13–15(ii) Available spectral and photophysical data are less extensive than for fluorescein. For example, in the equivalent case of 50- and 60-carboxyfluorescein the differences have been described;16,17such a distinction is still missing for rhodafluors. (iii) At higher pH the dicarboxyphenyl ring, being external to the electronic chromophore, causes a lactonic form and therefore renders a fraction of the dissolved dye useless.18–20
Here we report the new derivatives PAc- and EA–SNARF (Scheme 2) where the problematic dicarboxyphenyl ring has been replaced by a propionate or ethylamino group, respectively.
For investigations of protonation dynamics near the entrance or exit site of proton channels in proteins, for example, covalent linkage of the dye to a target site is needed. A widely-used linker for cysteines is maleimide. The connection of maleimide to the SNARF-system was already described by I. Himachi and coworkers,7but their chain is quite long and, correspondingly, the footprint of the tethered dye is too large for spatial resolution of the proton wire topology at the protein surface. To overcome Scheme 1 Chemical structures of xanthene-based pH-probes.
aDepartment of Chemistry, Humboldt-Universita¨t zu Berlin, 12489 Berlin, Germany.
E-mail: nernst@chemie.hu-berlin.de
bDepartment of Physics, Freie Universita¨t Berlin, 14195 Berlin, Germany.
E-mail: ulrike.alexiev@fu-berlin.de
cInstitute for Plantphysiology, Justus-Liebig Universita¨t, 35390 Giessen, Germany
dInstitute for Physical and Theoretical Chemistry, Universita¨t Regensburg, 93053 Regensburg, Germany
†Electronic supplementary information (ESI) available: Synthesis and character- ization of all compounds can be found. See DOI: 10.1039/c5cp05454k Received 12th September 2015,
Accepted 16th October 2015 DOI: 10.1039/c5cp05454k
www.rsc.org/pccp
PAPER
Open Access Article. Published on 19 October 2015. Downloaded on 04/02/2016 14:21:24. This article is licensed under a Creative Commons Attribution 3.0 Unported Licence.
View Article Online
View Journal | View Issue
this limitation we developed IA–SNARF (see also Scheme 2), described here, where the fluorescent core bears an ethyl chain with an iodacetamido group. This allows us to label a cyano- bacterial phytochrome covalently at a free cysteine. Spectral and radiative properties of the label are described. This novel SNARF with dual pH-dependent fluorescence bands and well- separated fluorescence lifetimes is better suited for imaging than fluorescein derivatives.7,21–23
2. Experimental section
Syntheses are described in the ESI.†
Solutions. Measurements were carried out at pH 5–9 as measured with a glass electrode. Generally dimethyl sulfoxide (dmso, spectrograde from Merck) was used as cosolvent; the concentration was water : dmso 20 : 1 (vol : vol before mixing) unless stated otherwise. For stationary measurements, standard buffer solutions from Merck were diluted with water 1 : 1. Note that the dmso cosolvent shifts the pH up by 0.1 on average.
Buffers consisted of a disodium-hydrogenphosphate/potassium- dihydrogenphosphate mixture or of a citric acid/sodium hydro- xyl/hydrochloric acid mixture (traceable to SRM from NIST and PTB.) The sodium salt of the carboxy-derivatives PAc- and 50 (or 60) C-SNARF dissolves excellently in water, but after acidifica- tion the absorption spectra at pHB 5 showed amplitude varia- tions if the peak absorbance of the protonated form exceeded 0.2 over 1 cm. The variations are possibly caused by very slow aggregation or other adsorption processes which we cannot account for. Thus it is challenging to obtain optical spectra with a well-defined isosbestic point. For time-resolved fluorescence measurements, the sodium salt of PAc–SNARF was first dissolved in Tris-citrate buffer (Sigma) at pH 10; subsequent titration down to pH 5 resulted in absorbance spectra with clear isosbestic points.
Quantum-chemical calculationswere performed with time- dependent density functional theory (TD-DFT), and ground
state geometries were optimized with density functional theory (DFT).24The B3LYP functional and the cc-pVDZ atomic basis set were used throughout. Solvents effects were taken into account with the polarized continuum (PCM) model.
Optical spectra.Absorption spectra were measured with a Cary 300 Bio and a Shimadzu UV2450 UV-visible spectrophoto- meter. Fluorescence spectra were recorded with a Spex Fluorolog 212 and a Spex Fluoromax. Excitation wavelengths were 488, 526 and 545 nm; the latter two are at or close to the isosbestic point of absorption by PAc–SNARF. Raw fluorescence spectra were multiplied with a photometric correction function; in this way the relative number of photons/(s nm), or quantum distribution F(l) =qF/ql, is obtained for each emission wavelength l. The bandwidth was generally 2 nm, and wavelengths were checked with Hg lines.
The quantum yield of fluorescence from PAc–SNARF was determined at pH 9, i.e. for the deprotonated form. For this purpose the dmso concentration was adjusted so that the peak absorbance wavelength and value of the solution coincide with that of a solution of rhodamine 101 in methanol. Following excitation at the peak (1 nm bandwidth), the fluorescence bands were recorded and photometrically corrected as before. The band integrals are related like the quantum yields, which for rhodamine 101 is 1.0.25The entire experiment, starting with the preparation of both solutions, was repeated three times.
Fluorescence decay curves were measured with a tunable picosecond laser in a TCSPC setup which is based on a micro- channel plate.26,27Sample fluorescence was excited by a white- light laser together with an acusto-optical tunable filter (SuperK Extreme EUV3 and SELECT UV-VIS, NKT). The output power was 140mW (488 nm) and 220mW (526 nm) at 19.5 MHz repetition rate. Emission was spectrally selected either with a 580 nm or 630 nm interference filter (Edmund 47 139 THGC and EO65706 580 nm 1-9-13), or else with a long-pass filter (LP) Z545 nm (HQ545, Chroma) or LP 715 nm (RG715, Schott). Fluorescence decay traces were collected in 1024 time channels with a channel width of 19.5 ps. The instrumental response function (IRF) was determined at the corresponding wavelengths with a colloidal silica solution as scattering material (LUDOX, Grace). The IRF of the system had 60–70 ps full width at half maximum. After deconvolution with the IRF the traces were fitted by a sum of exponentials.26,28
Fluorescence lifetime imaging microscopy (FLIM)29 was performed with the same laser system. The setup consists of an inverted microscope (Olympus IX71), equipped with a 4or 40 objective, and a confocal scanning unit (DCS-120, Becker & Hickl).
Time-correlated single photon counting was performed with a corresponding module (SPC-160, Becker & Hickl) and a hybrid PMT (HPM-100-40, Becker & Hickl). The time range was set to 19.97 ns for 1024 channels. For ratiometric-yield experiments the excitation was at 526 nm and emission was spectrally selected by a dichroic filter 560 dclp for the dual detection mode. In the ‘‘green’’
and ‘‘red’’ emission channel an additional HQ545LP, respectively OG590 longpass filter, was used. For lifetime-based analyses the same settings as in the spectroscopic experiments were used.
Additionally, excitation and filter settings are given in the text.
Scheme 2 New derivatives with propionate (PAc), ethyl-amino (EA) and iodoacet-amide (IA) functionality. Colors highlight the spectral difference.
Open Access Article. Published on 19 October 2015. Downloaded on 04/02/2016 14:21:24. This article is licensed under a Creative Commons Attribution 3.0 Unported Licence.
SNARF labelling of cyanobacterial phytochrome. The Cph1D2 sensory module30was labelled with a 5-fold excess of IA–SNARF in 2.5 mM Tris pH 7.8, 15 mM NaCl for 1 hour at room temperature. Unbound dye was removed by gel filtration (Sephadex G-25 fine, GE Healthcare). The labelling stoichiometry was calculated according to
cLabel
cProtein¼ DAL eL
eProtein
AProtein
: (1)
HereAProteinis the absorbance at 658 nm (lmax) of Cph1D2 in the Pr state at pH 8.8, 15 mM NaCl. We determined the corresponding extinction coefficient, eProtein, to be B50 000 l mol1 cm1 under our conditions, significantly lower than that reported by van Thoret al.32DALis the absorbance of the label, measured as the absorbance difference between the labelled and unlabelled phytochrome at 565 nm. The extinction coefficient of SNARF at 565 nm (deprotonated form) is eL= 47 100 l mol1 cm1, as described in the results section. Covalent binding of the IA–SNARF label to Cph1D2 and the removal of excess label was verified by the fluorescence of the Cph1D2 band following SDS- PAGE. The ability of the SNARF-labelled phytochrome to shift between the far red (Pfr) and red (Pr) form was tested by illumina- tion at l= 735 nm. The phytochrome samples remained fully photochromic after derivatisation, indicating that the procedure did not affect molecular function.
Fluorescence imaging of HeLa cells was performed in phosphate-buffered saline (PBS) at pH 7.3. Cells were incubated with PAc–SNARF and IA–SNARF, respectively, for 30 minutes and subsequently washed with PBS. Incubation and imaging were carried out at 371C.
3. Results and discussion
3.1 Properties of PAc- and other SNARF derivatives
Stationary absorption and emission spectra are shown in Fig. 1 as function of pH. Spectra have been scaled to the same sample concentration. In absorption an isosbestic point is observed at 526 nm. At shorter wavelengths the extinction coefficient of the protonated form exceeds that of the deproto- nated form. In stationary measurements of fluorescence, in order to enhance the relatively weak ‘‘blue’’ emission from the protonated species, we excite atlexc= 488 nm. The appearance of the spectra is very similar to that of the known 50,60C-SNARF mixture.
For analysis we may assume that the protonated and depro- tonated forms are in equilibrium in the electronic ground state.
The absorption spectra in Fig. 1a can therefore be decomposed into contributions from the two ground-state forms to yield the species-associated spectra (SAS). These are shown as red and blue lines, respectively, in panel (a). Their relative weight, corresponding to the mole fractions x of the two forms, is described by
xred= 10pKa/(10pKa+ 10pH) andxblue= 1xred. (2) A fit to the data gives pKa = 7.55 (0.12 standard error) for the protonation equilibrium, as measured by absorption.
The fluorescence spectra in Fig. 1b, when treated in the same manner, give a similar pKa= 7.50 (0.20). The resulting SAS are shown as a red and blue lines, respectively, in panel (b).
The maximum extinction coefficient of the deprotonated formered,max= 47 100500 l mol1cm1was determined at pH 9.31 From Fig. 1a we find that upon protonation the maximum extinction coefficient drops to 58%, henceeblue,max= 27 320 l mol1cm1.
Species-associated spectra were fitted by one or several functions
log normð~nÞ ¼hexp ln 2 ln 1þ2ð~ggepÞ
D
g
!2
8<
:
9=
;: (3)
With parametersnep;D;g;hfor peak wavenumber [cm1], width [cm1], asymmetry [], and amplitude []. Note that in case of absorption,hrefers to extinction coefficients (in l mol1cm1).
In case of fluorescence, quantum distributions over wave- lengths were converted into distributions over wavenumbers, F(~n) = (qF/(F~n))p(qF/ql)l2and then set to 1 at the peak of the spectrum of the deprotonated form (Fis the total number of Fig. 1 Optical absorption (a) and fluorescence (b) spectra of PAc–SNARF in water/dmso (20 : 1 by volume, for buffer see text) as function of pH at 221C. Red and blue curves represent the species-associated spectra (SAS) of the pure deprotonated and protonated species, respectively, from global analysis. In stationary measurements, excitation wavelengthlexc= 488 nm was chosen in order to enhance the fluorescence contribution by the protonated species.
Open Access Article. Published on 19 October 2015. Downloaded on 04/02/2016 14:21:24. This article is licensed under a Creative Commons Attribution 3.0 Unported Licence.
photons counted). Log norm parameters are collected in Table 1 and Tables S1–S5 (ESI†).
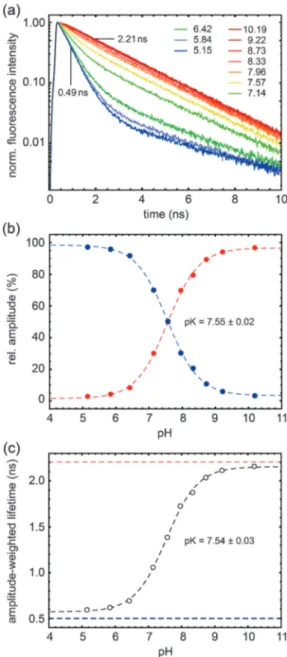
Fluorescence lifetime curves are shown and analyzed in Fig. 2. Fluorescence time traces were recorded at different pH values in Tris-citrate buffer (panel a). In these time-resolved fluorescence measurements the sample was excited at the iso- sbestic point (526 nm), ensuring the same excitation probability for the deprotonated and protonated form, and emission was detected atl4545 nm. In line with the considerations above we assume that each species possesses an individual fluores- cence lifetime that is constant over the pH range. The relative amplitudes of the two global lifetime components (tred= 2.21 ns for the deprotonated ‘‘red’’ form and tblue = 0.49 ns for the protonated ‘‘blue’’ form) are shown as data points in Fig. 2b. A fit gives pKa= 7.55 (0.02). Similarly, the amplitude-weighted lifetime displays the expected behavior with pH (panel c) and we find pKa= 7.54 (0.03). Note that these lifetime-based analyses are independent of the dye concentration.
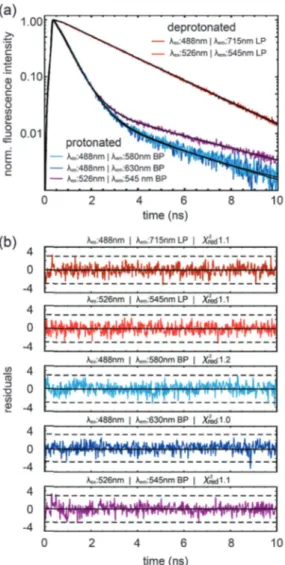
The dependence of fluorescence lifetimes on excitation and emission wavelengths is shown in Fig. 3. At pH 10 the depro- tonated form is detected easily as a pure species with 2.21 ns lifetime (lex = 526 nm, lem = 545 nm long pass). The same observation is made even upon excitation at the ‘‘blue’’ side of the absorption spectrum (lex= 488 nm), by choosing an appro- priate emission filter (e.g.longpass 715 nm or bandpass 630 nm).
At pH 5 the protonated form, when excited at the isosbestic point or at 488 nm, gives fluorescence decay traces with a main decay component of 0.49 ns (96–97%). The remaining percentages can be attributed to the residual amount of the deprotonated form, in particular when detecting in the ‘‘red’’ emission band (lex = 488 nm, lem = 630 nm band pass). The existence of a minor additional protonated species with a lifetime ofB4.0 ns (lex= 526 nm,lem= 545 nm long pass) is also conceivable.
Photometric considerations conclude the examination of PAc–SNARF in this section. The S1 ’ S0 absorption band is available in terms of lognormal functions of wavenumber and
can therefore be integrated entirely (12 000–25 000 cm1). Thus we find oscillator strengths fosc,blue= 0.65 and fosc,red = 0.83.
Radiative lifetimes are calculated with the Strickler–Berg formula, resulting intrad,blue= 6.03 ns andtrad,red= 5.08 ns. Compare this with the measured fluorescence lifetimes oftblue= 0.49 ns and tred= 2.21 ns (Fig. 3). Looking only at the red form at pH49, we predict a fluorescence quantum yield QYred= 44%. Instead our direct measurement (with rhodamine 101/methanol as reference) gave a value of 35%. The experimental value being lower is Table 1 Lognormal description of S1–S0bands of PAc–SNARF in water/
dmso (20 : 1 vol : vol)
e np
cm1 D/cm1 g h
Absorption (Fig. 1a)
Deprotonateda 16 309 971 0.42 3425
17 602 1576 0.19 47 100
19 033 1675 0.49 15 926
Protonatedb 16 934 1450 0.58 563
18 206 974 0.07 13 403
19 130 1696 0.25 23 321
20 385 2012 0.53 13 808
Emissioncfrom 488 nm excitation (Fig. 1b)
Deprotonated 15 844 1605 0.12 1.000
14 174 1434 0.25 0.193
Protonated 17 283 1219 0.03 0.316
15 953 1604 0.26 0.247
14 242 1562 0.42 0.044
aFor 14 300–20 160 cm1.b14 300–22 220 cm1.cdF/d~n.
Fig. 2 Time-resolved fluorescence of PAc–SNARF as a function of pH.
(a) Decay traces at various pH values as indicated by the different colors. Red and blue curves refer to the pure deprotonated and protonated species; the two lifetimes from global analysis are indicated. (b) Relative amplitudes of the decay components due to the protonated (blue) and deprotonated form (red curve). (c) Amplitude-weighted lifetimes. Fit lines and pKavalues are also given. Conditions: 10 mM Tris Citrate, 190 mM NaCl, 20 : 1 water:dmso volume fraction, 201C.lexc= 526 nm, and emission was detected with long pass filter HQ 545.
Open Access Article. Published on 19 October 2015. Downloaded on 04/02/2016 14:21:24. This article is licensed under a Creative Commons Attribution 3.0 Unported Licence.
consistent with the idea that a higher electronically excited state contributes to the first absorption band of the red form.
Quantum-chemical resultsfor the SNARF core (i.e.by setting RQH, see Scheme 2) in water are presented in Table 2. The lowest-energy transition of the protonated form is calculated at DE= 21 290 cm1with oscillator strengthf= 0.49. It is accom- panied by a moderate change in dipole moment,Dm = 4.3 D (=Debye). For the deprotonated form the lowest transition at 20 080 cm1 is predicted to be strong (f = 0.75). The energy separation of the lowest excited electronic states and the relative strengths of the corresponding transitions are in good agree- ment with observations. Note that the TDDFT method also finds a charge transfer transition (Dm= 25.1 Debye) with zero oscillator strength. This is due to a well-known artifact of DFT methods which overestimate the stability of charge-transfer states. Mole- cular orbitals are shown in the ESI.†
Regioisomers 50C- and 60C-SNARF were also synthesized and isolated. The dependence of optical spectra on pH was examined in water : dmso 5 : 1 in this case, in order to avoid
solubility problems at pH B5. Species-associated spectra of absorption and fluorescence are almost identical to those of PAc–SNARF at the same cosolvent concentration; however the pKa of 50C- is larger by 0.15 compared to 60C- (see ESI†). In precision measurements of pH it is important to use only one of the isomers, because if a mixture is used, protonated and deprotonated forms coexist in a broader range and resolution is lost correspondingly.
3.2 Labelling of cyanobacterial phytochrome Cph1D2 The function of light-activated proteins such as bacteriorho- dopsin, visual rhodopsin, channelrhodopsin or phytochrome is associated with protonation changes in the protein and sub- sequent proton release/uptake events.32 A pH-dependent dye for covalent linkage to the protein surface often used in the investigation of these proteins is iodoacetamido-fluorescein, IA-F.33 Instead we test here the covalent binding of IA–SNARF to a protein surface, using the cyanobacterial phytochrome Cph1D230 as example.
Under the conditions described in the Experimental Section, about 0.8 mol of IA–SNARF was bound per mol Cph1D2. The 2VEA crystal structure29 implies that only C371 in the sensor module is exposed and thus is the most likely target for the label. Fig. 4 shows the absorption spectra of Cph1D2 in the Pr form of phytochrome. For pH 6 and pH 8.8, spectra before and after labelling are compared (dashed and solid line, respectively).
When SNARF is bound to the protein, the absorption band has its maximum atlmax= 5291 nm in the protonated form and at lmax= 565 1 nm in the deprotonated form. The protonated form is slightly red-shifted compared to that of PAc–SNARF (cf.Fig. 1a). The same holds true for the isosbestic point, which is now observed at 541 nm. The fluorescence lifetimes of IA–SNARF aretblue= 0.49 ns andtred= 2.10 ns, very similar to PAc–SNARF.
As the peak absorbance of phytochrome in the Pr form is located at 658 nm, an excitation of the SNARF dye results in minimal phytochrome activation. This is one prerequisite for using the SNARF dye with photoreceptor proteins.
4. Outlook
Besides investigations on the molecular level, monitoring the pH inside living cells is important since intracellular pH changes are critical for cell and tissue activities, including phagocytosis, Fig. 3 Fluorescence decay analysis of protonated and deprotonated
forms of PAc–SNARF for different excitation and emission wavelengths, as indicated. (a) Fluorescence decay traces and their multi-exponential fits.
(b) Fit residuals. (BP-band pass; LP-long pass filter).
Table 2 Vertical excitation energyDE, oscillator strengthf, and dipole moment change Dm = |mi m0| of the SNARF core (RQH) in water, calculated with TD-DFT/B3LYP/cc-pVDZ for the first three electronic transitions
DE/cm1 f Dm/D
Deprotonated 20 080 0.752 7.43
22 460 0.000 25.12
23 910 0.008 6.96
Protonated 21 290 0.491 4.27
25 140 0.158 10.99
27 130 0.027 8.01
Open Access Article. Published on 19 October 2015. Downloaded on 04/02/2016 14:21:24. This article is licensed under a Creative Commons Attribution 3.0 Unported Licence.
endocytosis, ion transport, signaling cascades, and synaptic transmission. Both PAc–SNARF and IA–SNARF are able to enter the cell freely.
To validate the applicability of our SNARF derivatives as dual fluorescence probe for quantitative pH measurements in imaging experiments, we conducted two proof-of-principle experiments using a confocal raster scanning fluorescence microscope equipped with TCSPC detection for fluorescence lifetime experiments.29
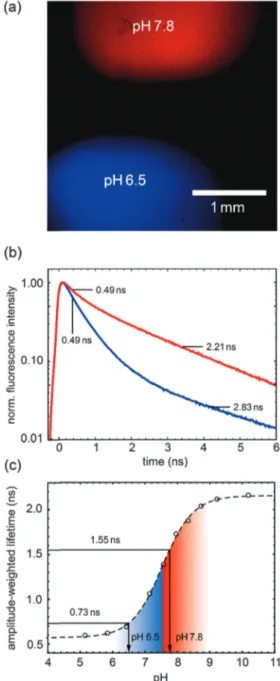
The first experiment (see Fig. 5) demonstrates the amplitude- weighted-lifetime method for determining pH. Two drops of PAc–
SNARF solution with different pH values (6.5 and 7.8) are placed on a cover slip. Panel (a) shows the false-coded FLIM image according to the different fluorescence lifetime characteristics of the image, clearly indicating the two different drops in the image.
The corresponding fluorescence decay curves and lifetimes are shown in panel (b). The calibration curve from the TCSPC measure- ments (Fig. 2c) was used to obtain the pH values as shown in Fig. 5c, which match the target pH values. Since the lifetime is used in the pH calibration curve, it does not matter whether the calibration was obtained in a spectroscopic or microscopic setup as long as the excitation and emission parameter are identical.
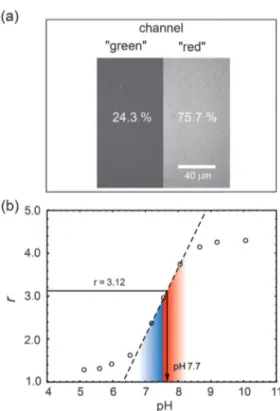
The second experiment (see Fig. 6) demonstrates the ratiometric-yield method with a SNARF-labelled protein. Here the two emission bands from only one excitation wavelength are exploited. Using the standard set of emission filters that exists in many confocal laser scanning microscopes, we measure the stationary fluorescence intensity of the SNARF-labelled phyto- chrome in the ‘‘red’’ and ‘‘green’’ emission channel (green:lem= 545–560 nm, red:lem4590 nm). The corresponding images are shown in panel (a). The calibration curve (b) was obtained with Fig. 4 Covalent binding of IA–SNARF to cyanobacterial phytochrome
Cph1D2. Absorption spectra are shown before (– – –) and after (–) labelling at pH 8.8 (a) and pH 6.0 (b). Arrows indicate the absorption maximum of the deprotonated (565 nm at pH 8.8) and the protonated (529.5 nm at pH 6) form of bound SNARF. Inset in (a): left – photographs of the fractions after gel filtration containing SNARF (red fluorescence in fraction F2) and phyto- chrome (blue absorption in fraction F2); right – SDS PAGE of IA–SNARF in the fluorescence image (lane 1: molecular weight marker, lane 2: Cph1D2- A-SNARF). Inset in (b): absorption spectrum of IA–SNARF at pH 6.0.
Fig. 5 FLIM based determination of pH values. (a) FLIM image of PAc–
SNARF in acidic (blue) and basic (red) environment. Conditions: 4objective, excitation at 526 nm and emission filter HQ545LP. (b) Fluorescence decay traces of protonated (blue) and deprotonated (red) PAc–SNARF of (a). (c) pH calibration curve obtained by TCSPC cuvette measurements using the same excitation wavelength and emission filter. The determined amplitude- weighted lifetimes (0.73 & 1.55 ns) of the traces in (b) and respective determined pH values (6.5 & 7.8) are shown.
Open Access Article. Published on 19 October 2015. Downloaded on 04/02/2016 14:21:24. This article is licensed under a Creative Commons Attribution 3.0 Unported Licence.
the confocal microscope using the same settings as for the ratiometric pH determination of the pH at the protein surface of phytochrome. The resulting pH value is 7.7.
The results of these proof-of-principle experiments show clearly that the new SNARF dye offers the opportunity for tracking spatio-temporal pH changes inside living cells, and to elucidate the function of proteins to which the SNARF dye is attached to.
Acknowledgements
This project was supported by the Deutsche Forschungsge- meinschaft through grants to UA and NPE (Collaborative Research Center 1078 ‘‘Protonation Dynamics in Protein Function’’, projects A2 and A3) and to UA (Collaborative Research Center 1112
‘‘Nanocarriers: Architecture, Transport, and Topical Application of Drugs for Therapeutic Use’’, project B03). We would like to thank Dr Katharina Achazi for providing HeLa cells.
Notes and references
1 J. Han and K. Burgess,Chem. Rev., 2010,110, 2709–2728.
2 A. M. Paradiso, R. Y. Tsien and T. E. Machen, Proc. Natl.
Acad. Sci. U. S. A., 1984,81, 7436–7440.
3 X. Wang, A. J. Levi and A. P. Halestrap,Am. J. Physiol.: Heart Circ. Physiol., 1994,267, H1759–H1769.
4 M. J. Fehr, M. A. McCloskey and J. W. Petrich,J. Am. Chem.
Soc., 1995,117, 1833–1836.
5 R. P. Haugland and J. Whitaker andU.S. Pat., 4945171, 1990.
6 J. Liu, Z. Diwu and W.-Y. Leung,Bioorg. Med. Chem. Lett., 2001,11, 2903–2905.
7 E. Nakata, H. Wang and I. Hamachi,ChemBioChem, 2008,9, 25–29.
8 A. Keppler, H. Pick, C. Arrivoli, H. Vogel and K. Johnsson, Proc. Natl. Acad. Sci. U. S. A., 2004,101, 9955–9959.
9 E. Nakata, Y. Nazumi, Y. Yukimachi, Y. Uto, H. Maezawa, T. Hashimoto, Y. Okamoto and H. Hori,Bioorg. Med. Chem.
Lett., 2011,21, 1663–1666.
10 R. Martinez-Zaguilan, G. M. Martinez, F. Lattanzio and J. R. Gillies,Am. J. Phys., 1991,260, 297–307.
11 M. Frasconi, R. Tel-Vered, J. Elbaz and I. Willner, J. Am.
Chem. Soc., 2010,132, 2029–2036.
12 M. A. Schroeder, M. A. Ali, A. Hulikovam, C. T. Supuran, K. Clarke, R. D. Vaughan-Jones, D. J. Tyler and P. Swietach, Proc. Natl. Acad. Sci. U. S. A., 2013,110, E958–E967.
13 M. P. Weekes, S. Y. Tan, E. Poole, S. Talbot, R. Antrobus, D. L. Smith, C. Montag, S. P. Gygi, J. H. Sinclair and P. J. Lehner,Science, 2013,340, 199–202.
14 S. Schlafer, J. E. Garcia, M. Greve, M. K. Raarup, B. Nyvad and I. Dige,Appl. Environ. Microbiol., 2015,81, 1267–1273.
15 K. J. Buckler and R. D. Vaughan-Jones,Pflugers Arch., 1990, 417, 234–239.
16 M. V. Kvach, D. A. Tsybulsky, A. V. Ustinov, I. A. Stepanova, S. L. Bondarev, S. V. Gontarev, V. A. Korshun and V. V.
Shmanai,Bioconjugate Chem., 2007,18, 1691–1696.
17 I. Johnson and M. T. Z. Spence,The Molecular Probes Hand- book, 11th edn, 2010, ch 1.5, Fluorescein, Oregon Green and Rhodamine Green Dyes.
18 Y. Kaneko and D. C. Neckers,J. Phys. Chem. A, 1998,102, 5356–5363.
19 J. Karpiuk,J. Phys. Chem. A, 2004,108, 11183–11195.
20 J. Karpiuk, Z. R. Grabowski and F. C. De Schryver,J. Phys.
Chem., 1994,98, 3247–3256.
21 A. Galant, R. P. Koester, E. A. Ainsworth, L. M. Hicks and J. M. Jez,New Phytol., 2012,194, 220–229.
22 T. Kreisig, R. Hoffmann and T. Zuchner,Anal. Chem., 2011, 83, 4281–4287.
23 M. Misheva, G. Kaur, K. R. W. Ngoei, Y. Y. Yeap, I. H. W. Ng, K. M. Wagstaff, D. C. H. Ng, D. A. Jans and M. A.
Bogoyevitch,Biochim. Biophys. Acta, 2014,1843, 253–264.
24 A. A. Granovsky, GAMESS Firefly version 8, (http://classic.
chem.msu.su/gran/firefly/index.html) which is partly based on, M. W. Schmidt, K. K. Baldridge, J. A. Boatz, S. T. Elbert, M. S. Gordon, J. H. Jensen, S. Koseki, N. Matsunaga, K. A.
Nguyen, S. Su, T. L. Windus, M. Dupuis, J. A. Montgomery, J. Comput. Chem., 14,1993, 1347–1363.
25 K. H. Drexhage,J. Res. NBS, Sect. A: Phys. Chem., 1976,80, 421–428.
26 U. Alexiev, I. Rimke and T. Po¨hlmann,J. Mol. Biol., 2003, 328, 705–719.
Fig. 6 Laser scanning image for ratiometric intensity based determination of pH values. (a) Image of SNARF-labelled phytochrome in the two detection channels. Conditions: 40objective, excitation at 526 nm and dual detec- tion mode using a dichroic filter 560 dclp. In the ‘‘green’’ and ‘‘red’’ channel an additional HQ545LP respectively OG590 longpass filter was used. (b) pH calibration curve obtained by the fluorescence intensity ratior=Ired/Igreen
of both channels measuring PAc–SNARF calibration samples at different pH values.
Open Access Article. Published on 19 October 2015. Downloaded on 04/02/2016 14:21:24. This article is licensed under a Creative Commons Attribution 3.0 Unported Licence.
27 T.-Y. Kim, K. Winkler and U. Alexiev,Photochem. Photobiol., 2007,83, 378–385.
28 U. Alexiev and D. L. Farrens,Biochim. Biophys. Acta, Bioenerg., 2014,1837, 694–709.
29 A. Boreham, T.-Y. Kim, V. Spahn, C. Stein, L. Mundhenk, A. D. Gruber, R. Haag, P. Welker, K. Licha and U. Alexiev, ACS Med. Chem. Lett., 2011,2, 724–728.
30 L. O. Essen, J. Mailliet and J. Hughes,Proc. Natl. Acad. Sci.
U. S. A., 2008,105, 14709–14714.
31 The storage form (see ESI†) was weighed in since it can be purified better. Reproducible results were obtained when milligram quantities were dissolved directly in the appro- priate final liquid volume.
32 J. J. van Thor, B. Borucki, W. Crielaard, H. Otto, T. Lamparter, J. Hughes, K. J. Hellingwerf and M. P. Heyn, Biochemistry, 2001,40, 11460–11471.
33 U. Alexiev, P. Scherrer, T. Marti, H. G. Khorana and M. P. Heyn,FEBS Lett., 1995,373, 81–84.
Open Access Article. Published on 19 October 2015. Downloaded on 04/02/2016 14:21:24. This article is licensed under a Creative Commons Attribution 3.0 Unported Licence.