Counting CO
2emissions in a globalised world
Producer versus consumer-oriented methods for CO2 accounting
Martin Bruckner Christine Polzin Stefan Giljum
DIE Research Project “Development Policy:
Questions for the Future”
Bonn 2010
Discussion Paper / Deutsches Institut für Entwicklungspolitik ISSN 1860-0441
Die Deutsche Nationalbibliothek verzeichnet diese Publikation in der Deutschen Nationalbibliografie; detaillierte bibliografische Daten sind im Internet über http://dnb.d-nb.de abrufbar.
The Deutsche Nationalbibliothek lists this publication in the Deutsche Nationalbibliografie; detailed bibliographic data is available in the Internet at http://dnb.d-nb.de.
ISBN 978-3-88985-517-6
Martin Bruckner is a researcher at the Sustainable Europe Research Institute (SERI), Vienna E-mail: martin.bruckner@seri.at
Christine Polzin is a researcher at the Sustainable Europe Research Institute, Vienna E-mail: christine.polzin@seri.at
Stefan Giljum is head of the research group "Sustainable Resource Use" at the Sustainable Europe Research Institute, Vienna
E-mail: stefan.giljum@seri.at
© Deutsches Institut für Entwicklungspolitik gGmbH Tulpenfeld 6, 53113 Bonn
℡ +49 (0)228 94927-0 +49 (0)228 94927-130 E-Mail: die@die-gdi.de http://www.die-gdi.de
Foreword
This paper has been produced under the umbrella of the DIE research project „Development Policy: Questions for the Future,” funded by the German Ministry for Economic Cooperation and Development (BMZ). A main objective of this research project is to stimulate thinking about how the context that development policy responds to could change in the long-term.
In the short-term, policymakers face numerous decisions with far-reaching implications of their own. Among them are decisions concerning how to respond to the global climate chal- lenge by crafting a successor to the Kyoto climate regime set to expire in 2012. This paper by Martin Bruckner, Christine Polzin, and Stefan Giljum from the Sustainable Europe Research Institute, Vienna, offers a contribution to the debate about what considerations should be in- corporated into deliberations on the governance of the global climate in the future by identify- ing how consumption-focused methods of accounting for carbon dioxide emissions can pro- vide a more complete picture of national responsibilities to take action against climate change than production-focused accounting methods alone might allow. The paper highlights the en- vironmental dimensions of interstate economic relations and encourages policymakers to ac- knowledge the implications of economic interdependence for global climate policy to a greater extent. The research presented here provides a complement to several ongoing strands of research at the Deutsches Institut für Entwicklungspolitik/German Development Institute (DIE), touching on issues such as the compatibility between the global trade and climate regimes, the place of climate adaptation measures within the framework of global climate governance, and pathways toward a global low-carbon economy. A common concern within this body of work is the need to accommodate the interests of developing countries within global environmental governance processes while putting the world as a whole on a more sustainable development path in the future.
Erik Lundsgaarde Bonn, July 2010
Contents
Abbreviations
Summary 1
1 Introduction 3
2 Background and methodology 4
2.1 Approaches to carbon accounting 4
2.2 Models for economy-wide carbon accounting 5
2.3 Data sources 8
3 Comparing consumption-based and production-based emissions 9
4 Implications for global climate and trade policies 19 4.1 Implications of a complete shift from producer to consumer responsibility 19 4.2 Options for sharing responsibilities between producers and consumers 21
4.3 Implications for international trade policy 22
4.4 Broadening the scope to other environmental issues 23
5 Conclusions 23
Bibliography 25
Figures and Tables
Figure 1: Ranking of top five net importers and exporters in 1995, 2005 14 Figure 2: Consumption-based CO2 emissions per capita, 2005 14 Figure 3: Carbon trade balances of selected regions, 1995–2005 15 Figure 4: Share of net imports/exports in consumption-based carbon emissions 16 Figure 5: Weak carbon leakage of selected countries, 1995–2005 17 Figure 6 Production, consumption, imports and exports of CO2 in China, 1995–2005 18 Figure 7: Production, consumption, imports and exports of CO2 in the US, 1995–2005 18
Table 1: Transactions in a three sector economy 6 Table 2: Assumed input-output structure for countries without available
input-output data 9
Table 3: Production and consumption-based emissions, carbon trade balances
and shares in global shifts of selected countries, 1995 and 2005 10 Table 4: Production- and consumption-based emissions per capita, net-
imports/exports per capita and shares of net-trade flows in carbon
consumption of selected countries, 1995 and 2005 13
Table 5: Share of weak carbon leakage in production, 1995 and 2005 17 Table 6: Example of emission reduction requirements in a budget
approach (in Mt CO2) 20
Abbreviations
BEET Balance of Emissions Embodied in Trade
BTD Bilateral Trade Data
CDM Clean Development Mechanism
CO2 Carbon dioxide
CSS Carbon Capture and Storage EIT Economies in transition GHG emissions Greenhouse gas emissions
GRAM Global Resource Accounting Model GTAP Global Trade Analysis Project
GWS Gesellschaft für wirtschaftliche Strukturforschung IEA International Energy Agency
IO Input-output
IPCC Intergovernmental Panel on Climate Change LULUCF Land-use, land-use change and forestry MRIO model Multi-regional input-output model
Mt Million tonnes
OECD Organisation for Economic Co-operation and Development OPEC Organization of the Petroleum Exporting Countries
RoW Rest of the World
SERI Sustainable Europe Research Institute SRIO Single-region Input-Output analysis
UNFCCC UN Framework Convention on Climate Change
WBGU Wissenschaftlicher Beirat der Bundesregierung Globale Umweltveränderungen (German Advisory Council on Global Change)
Counting CO2 emissions in a globalised world: Producer versus consumer-oriented methods for CO2 accounting
German Development Institue / Deutsches Institut für Entwicklungspolitik (DIE) 1 Summary
This paper compares the Kyoto Protocol’s production-based accounting method to calculate a country’s carbon emissions with a consumption-based accounting method that measures the carbon embodied in goods in the country where they are consumed. The choice between the two accounting principles implies an inherent judgment on whether the producer or the con- sumer is responsible for the CO2 emissions. The comparison raises questions on international environmental justice as well as political implications regarding the responsibility for carbon emissions and climate change. This paper argues that consumption-based accounts are a useful complement to production-based accounts because they provide a basis for sharing environ- mental responsibilities between producer and consumer countries.
Using a multi-regional input output (MRIO) model we find that CO2 emissions embodied in internationally traded goods accounted for 27% of the total energy-related CO2 emissions in 2005, up from 22% in 1995. The G77 countries consume 23% less CO2 emissions than they produce while the countries Organisation for Economic Co-operation and Development (OECD) consume almost 30% more CO2 emissions than they produce. The G77 have a com- bined CO2 trade deficit of more than 3 billion tonnes and thus deliver almost all the net imports of the OECD countries. The largest net importers of embodied carbon emissions in 2005 were the US (1255 Mt), Japan (380 Mt) and the biggest European economies (France 275 Mt, Ger- many 257 Mt, and the UK 232 Mt). The largest net exporters were China with 990 Mt (an in- crease of 63% compared to 1995), the Russian Federation (330 Mt) and India (136 Mt). The highest carbon leakage occurred in the United States (1,250 Mt CO2 from consumption origi- nated from non-Annex I countries). The European Union imported 1,450 Mt CO2 from non- Annex I countries.
The paper also raises some pertinent policy implications. Consumption-based carbon account- ing puts the credibility of the reduction achievements under Kyoto into a different perspective because it would not allow the reduction of national carbon budgets by substituting domestic production for imports. A consumption-based accounting system might be perceived as fairer than production-based accounting, especially by net-exporting countries. Measuring the CO2
emissions and other environmental outputs of world trade may be useful in revising and finding fair emission targets and may encourage technology transfers and mitigation activities. A con- sumption-based approach to carbon accounting combined with appropriate policy instruments such as quotas or taxes may help shift comparative advantage away from pure economic meas- ures to a logic that also considers environmental aspects. Finally, the debate on global envi- ronmental responsibility should not only focus on CO2 emissions but also consider the effects of other greenhouse gases and the unsustainable use of other resources such as raw materials, land and water.
Martin Bruckner / Christine Polzin / Stefan Giljum
German Development Institute / Deutsches Institut für Entwicklungspolitik (DIE) 3 1 Introduction1
The attention of both national and international climate change policy negotiations has in- creasingly focused on reducing the growth of anthropogenic greenhouse gas (GHG) emissions – most importantly of carbon dioxide (CO2), one of the main drivers of global warming. The Kyoto Protocol of the UN Framework Convention on Climate Change (UNFCCC 1998), the most prominent example of global policy efforts, sets targets for the main industrialised coun- tries to reduce the greenhouse gases they produce.2
The measurement of emissions in the Kyoto Protocol follows the UNFCCC convention of territorial accounting, a method that attributes all emissions generated from production activi- ties within a country’s territory to that country’s total emissions. It does not take into account emissions which occur along international value chains (embodied emissions of traded goods and services). Some argue that the method is inadequate for open economies engaged in trade because the amount of GHG emissions they produce hardly ever corresponds to the amount of emissions released to enable their consumption of domestic and imported products (see for example Li / Hewitt 2008; Peters / Hertwich 2008a; Wilting / Vringer 2009; Davis / Caldeira 2010). Indeed, as this paper will show, there is a large difference between countries’ emis- sions related to production and consumption.
The selection of different ways to measure CO2 emissions is not only an academic issue but also raises questions of international environmental justice and carries political implications regarding responsibility. Production-related emissions in many export-oriented developing and emerging economies are to a considerable extent driven by the consumption patterns in industrialised countries. So who should be responsible for the emissions embodied in trade, the developing countries in their role as producers or the industrialised countries as consum- ers? In order to devise fair and equitable climate policies it is worth analysing where and for what purpose greenhouse gases are emitted.3
Doubts about the usefulness of territorial accounting as a basis for the assignment of respon- sibility between different countries may also arise because national action plans aimed at re- ducing domestic CO2 emissions can increase the emissions of other countries and thus counter the global efforts to tackle climate change. This effect, which is known as carbon leakage (Ahmad / Wyckoff 2003; Barker et al. 2007), can be measured in terms of CO2 emissions that are not consumed in the same country where they are produced. Such carbon shifts from one country to another may occur as a result of two different processes. First, some pollution in- tensive industries in the country with stricter national environmental regulations may migrate
1 The authors would like to thank Kirsten Wiebe and Christian Lutz from the Institute of Economic Structures Research (GWS) in Osnabrück for their support in building up and running the model on which the analysis in this paper is based.
2 The Kyoto Protocol, an international agreement to reduce greenhouse gas emissions worldwide, entered into force on 16 February 2005. Parties to the UNFCCC are classified as Annex I parties (industrialised countries that are members of the OECD and economies in transition (EIT)), Annex II parties (OECD members of An- nex I but not EITs who are required to provide financial resources to developing countries for adaptation to climate change), and Non-Annex I parties (mostly developing countries who are not required to reduce emis- sion levels unless developed countries supply enough funding and technology).
3 Climate justice and responsibility are commonly raised ethical concerns in the literature on climate policies (Ringius / Torvanger / Underdal 2002; Bastianoni / Pulselli / Tiezzi 2004; Vanderheiden 2008; Hoekstra / Janssen 2006; Ikeme 2003; Rose 1990; Bulkeley / Newell 2010; Roberts / Parks 2009).
Martin Bruckner / Christine Polzin / Stefan Giljum
4 German Development Institute / Deutsches Institut für Entwicklungspolitik (DIE)
to countries with less stringent environmental regulations. Helm / Smale / Phillips (2007), for example, argue that developed countries have ‘pushed’ dirty production into developing coun- tries, helped by policies of deindustrialisation. In the literature, the jury is still out on this so- called strong pollution haven hypothesis (see for example Cole / Elliott / Shimamoto 2005;
Xing / Kolstad 2002; Brunnermeier / Levinson 2004). Carbon leakage may also occur when production increases in less environmentally regulated countries (e.g. non-Annex I countries) for reasons that are not connected to climate change mitigation in countries with stronger en- vironmental regulation (e.g. Annex I countries) (Rothman 1998). There is strong evidence for the occurrence of weak carbon leakage, as this paper will show.
This paper will provide an overall account of the emissions embedded in global trade flows to and from different countries and regions. While knowledge about the size of embodied CO2
emissions in imports and exports has long been limited, new models are now enabling the calculation and analysis of these embodied emissions. This paper uses a multi-regional input- output (MRIO) model to compare energy-related CO2 emissions from production and con- sumption by calculating the emission balances of consumption (= production – exports + im- ports) in 54 countries and comparing them to the production-based emission balances.
The paper will thus provide answers to three main questions. First, which countries and re- gions are the biggest net importers and net exporters of embodied CO2 emissions from inter- national trade? Second, what amount of CO2 emissions has been shifted between different regions through international trade? Third, what is the influence of considering consumer re- sponsibility on the goals of international climate agreements?
The main conclusions from this paper are:
— Comprehensive carbon trade balances with embedded emissions show that emissions re- lated to domestic consumption of products are significantly higher than those related to domestic production in many industrialised countries. The opposite is revealed for trade- engaged developing and emerging economies.
— Consumption-based carbon trade balances should be established in addition to production- based balances because they can help in finding solutions to issues such as carbon leakage and emission targets for developing countries.
The next section explains how to measure embodied carbon emissions in traded goods and provides a brief review of the literature on consumption-based accounting. It will also explain the method and data used to calculate the embedded carbon emissions in the paper. Section 3 presents the results generated with the MRIO model. Section 4 considers implications for global climate policies. Section 5 concludes.
2 Background and methodology
2.1 Approaches to carbon accounting
The most commonly used method for CO2 accounting – production-based or territorial ac- counting – measures the CO2 emitted within a country. While it can be used to evaluate the global environmental impacts of the production and consumption activities of a specific coun- try, it cannot identify shifts of environmental pressures as a result of changing global produc-
Counting CO2 emissions in a globalised world: Producer versus consumer-oriented methods for CO2 accounting
German Development Institute / Deutsches Institut für Entwicklungspolitik (DIE) 5 tion, trade and consumption patterns. Moreover, it is not possible to use this approach to ana- lyse carbon leakage or equity concerns related to the structure of trade relations between de- veloping and industrialised countries (Schaeffer / Leal de Sá 1996).
By contrast, consumption-based emissions are calculated by adding the emissions arising from domestic production and emissions embodied in imports and subtracting the emissions embodied in exports (Nakano et al. 2009). Allocating emissions on a national production basis is easier than calculating them on a consumption basis because the latter requires the detailed specification of inter-industry and international trade structures. The calculation of emissions from the production of exports furthermore requires large quantities of country-specific, up- to-date data (in the form of so-called input-output tables and international trade data). Territo- rial accounting, by contrast, has clear system boundaries and good data availability.
The choice between the production and consumption accounting principle implies an inherent judgment on whether the producer or the consumer is responsible for the CO2 emissions.
2.2 Models for economy-wide carbon accounting
The most commonly used methodology to estimate embodied emissions in international trade and identify all direct and indirect effects of production is based on the analysis of input- output (IO) tables. Input-output tables express the structure of an economy in terms of the inputs to its various sectors and the nature of the outputs from those sectors. They can be used to investigate what an economy extracts from and introduces into the natural environment as well as the environmental implications of resource use of final consumption (Leontief / Ford 1970; Miller / Blair 1985; Walter 1973). Environmentally extended input-output analysis can be used to analyse the environmental effects of structural changes in the economy, such as technology, trade, investment and consumption.
Martin Bruckner / Christine Polzin / Stefan Giljum
6 German Development Institute / Deutsches Institut für Entwicklungspolitik (DIE)
There are two kinds of input-output-based approaches – Single-Region Input-Output (SRIO) models and Multi-Regional Input-Output (MRIO) models.4 As supply chains have become increasingly global over the past decades, MRIO models have gained in importance in meas- uring emissions embodied in trade. A multi-regional input-output model includes all trade linkages between regions and shows how many domestic and imported products are required from each sector in each region. The main advantages of the MRIO approach are:
— MRIO models enable an accurate and comprehensive evaluation of the environmental impacts embedded in trade because they link (monetary) trade flows and environmental databases, taking variations in production structures and technologies between different countries and world regions into account (Wiedmann et al. 2007a).
4 On single-region input-output models, see for example Machado / Schaeffer / Worrell (2001) for Brazil, Munksgaard / Pedersen (2001) for Denmark, Mongelli / Tassielli / Notarnicola (2006) for Italy. For an excel- lent comparisons of the different approaches, please see Lenzen / Pade / Munksgaard (2004), Haukland (2004), Peters / Hertwich (2006).
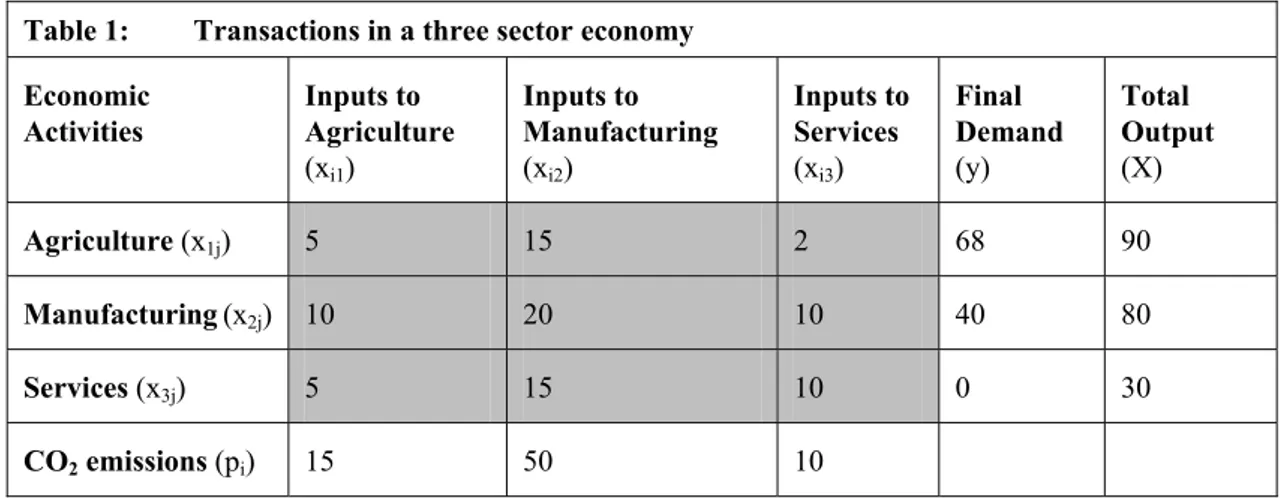
Box 1: A short description of input-output analysis
Input-output analysis helps to understand the interactions between economic sectors, producers and consum- ers. The method tracks all financial transactions between industrial sectors and consumers within an economy.
It is possible to assign an environmental impact to these financial transactions by adding environmental in- formation, such as greenhouse gas emissions, to each sector. An environmentally extended input-output model tracks the flow of environmental impacts along supply and production chains. As each production step adds an environmental burden, the result is a life-cycle inventory of impacts of production and consumption, e.g. carbon or water footprints of product groups, industries, regions or countries. Data is largely obtained from input-output tables, which show the flows of goods and services from every sector to every other sector in the economy over a given year. Table 1 represents a simplified example of an input-output table of a three sector economy.
Table 1: Transactions in a three sector economy Economic
Activities
Inputs to Agriculture (xi1)
Inputs to Manufacturing (xi2)
Inputs to Services (xi3)
Final Demand (y)
Total Output (X)
Agriculture (x1j) 5 15 2 68 90
Manufacturing (x2j) 10 20 10 40 80
Services (x3j) 5 15 10 0 30
CO2 emissions (pi) 15 50 10
Note: Data in input-output tables are usually given in monetary units. The exception here is the row which shows the environmental impacts (here the use of biomass from eco systems).
The columns in the table explain what inputs a sector uses to produce its output. They refer to the production side, while the rows show the distribution of the produced goods and services. In order to produce 68 units of agricultural products for final demand in this representative three sector economy, 5 units of inputs are needed from the agricultural sector, 10 units from the manufacturing sector and 5 units from the services sector. The agricultural sector also produces 15 units of CO2 emissions.
Counting CO2 emissions in a globalised world: Producer versus consumer-oriented methods for CO2 accounting
German Development Institute / Deutsches Institut für Entwicklungspolitik (DIE) 7
— MRIO models can be used to conduct different analyses at the international level, such as structural path analysis, production layer composition, quantification of shared environ- mental responsibilities between producers and consumers of goods (Wiedmann et al.
2007a; Wiedmann et al. 2007b).
— MRIO models can help to capture direct, indirect and induced effects of international trade (Wiedmann et al. 2007a).
In recent years, complex multi-regional multi-sectoral input-output models have been used to identify the environmental pressures that occur along the international supply chains of prod- ucts (Ahmad / Wyckoff 2003; Peters / Hertwich 2004).5 The latest studies to calculate embod- ied CO2 emissions which distinguish a large number of countries and regions, based on the Global Trade Analysis Project (GTAP) database, include Peters and Hertwich (2008b) and Minx et al. (2008).
The results presented in this paper were also derived using a MRIO model, the Global Re- source Accounting Model (GRAM).6 The GRAM model is a so-called multi-directional model, which includes all trade relations between the different countries and regions in the model.7 Following the OECD definition (Nakano et al. 2009; 10), this paper defines imported CO2 as the emissions embodied in the imports used for immediate and final consumption. In contrast to the UNFCCC model, that does not include emissions from aviation and shipping in national carbon accounts, the model used in this paper to calculate production-based CO2 bal- ances includes these emissions. The GRAM model may therefore produce higher emissions than those used in the Kyoto protocol.
For the calculation of carbon leakage this paper follows the methodology used by Peters and Hertwich (2008b; 1402) for “weak” carbon leakage - the total aggregated CO2 emissions em- bodied in imports from non-Annex I countries to Annex I countries.8 In a “strong” definition (generally used by the Intergovernmental Panel on Climate Change IPCC), in contrast, carbon leakage is defined as the “increase in CO2 emissions outside the countries taking domestic mitigation action divided by the reduction in the emissions of these countries” (IPCC 2007;
12). In theory this definition can be used to determine production shifts in response to GHG mitigation policies. Empirically, however, there is little evidence of such shifts on a signifi- cant scale (Peters / Hertwich 2008a). For the global climate, it is less relevant if a policy change in an Annex I country caused production to increase in a non-Annex I country. What matters for global climate policy goals is the total amount of carbon consumption in industri- alised countries that is produced in countries without binding GHG emission targets and poli- cies in place.
5 Extensive reviews of environmentally extended MRIO studies have been published by Wiedmann et al.
(2007a; 2007b) and Wiedmann (2009).
6 For more information on the GRAM model, see www.seri.at/GRAM.
7 There are also uni-directional MRIO models. These are more appropriate for the analysis of single countries (Lenzen / Pade / Munksgaard 2004; Munksgaard et al. 2009).
8 The model used for the carbon calculations in this paper includes 35 out of 40 Annex I countries (excluding Liechtenstein, Monaco, Croatia, Belarus, and Ukraine). Annex I countries are industrialised countries with greenhouse gas emissions limitations or a reduction commitment as well as countries currently making a transition to a market economy.
Martin Bruckner / Christine Polzin / Stefan Giljum
8 German Development Institute / Deutsches Institut für Entwicklungspolitik (DIE)
2.3 Data sources
The two key data sources for the Global Resource Accounting Model (GRAM) model adapted to the purpose of this paper are the International Energy Agency (IEA) and the OECD. Data on CO2 emissions for all countries are obtained from the IEA. The energy balances of the IEA (2008a; 2008b) contain physical data on the use of energy carriers in kilo tonnes oil equiva- lents (ktoe) for 68 economic sectors. One assumption of the model is that energy-related CO2
emissions per unit of energy carrier do not vary between different economic sectors.
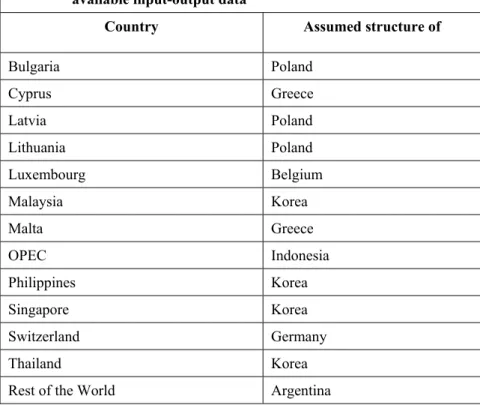
To conduct a detailed multi-regional input-output analysis highly harmonised economic data sets are essential (Peters 2008), including input-output data for every country and reliable data on bilateral trade. This data is generally available for most OECD countries, but only for a few non-OECD countries. The model uses the international input-output (IO) tables published by the OECD (Yamano / Ahmad 2006). This dataset covers 30 out of 31 OECD countries and 11 non-OECD countries (Argentina, Brazil, China, Estonia, India, Indonesia, Israel, Russia, Slovenia, South Africa, and Taiwan) with a resolution of 48 economic sectors. Input-output tables for 13 additional countries or regions were estimated under the assumption that they used the same technology as neighbouring countries or countries with a similar economic structure (see Table 2). In total, the model distinguishes 54 countries and world regions and 48 economic sectors. For most countries the OECD input-output tables are available for the years 1995, 2000 and 2005 (see OECD 2009). For some countries, however, data are only available for one or two of these three years or for different years.
The trade data for the multi-regional input-output models also comes from the OECD. Link- ing national input-output tables for cross-country analyses requires a consistent set of harmo- nised international bilateral trade data. Therefore, the Bilateral Trade Data (BTD, see OECD 2006) were harmonised with the IO tables of the OECD. They contain data on imports and exports for all OECD countries, broken down by 61 trading partners and 25 product groups as well as one aggregated service sector. Re-exports were fully integrated in the final demand data used in this analysis. Bilateral trade data are directly available for almost all countries in the model. In addition to most of the trade relations between OECD member states, the cur- rent OECD trade data set also comprises the trade flows between the most important trading partners such as China, India, Brazil, Russia, etc. Estimations based on international statistics were necessary only for the trade between six small Eastern EU member states as well as for the OPEC and the country group “Rest of the World”. For more information on the technical implementation of the model, see Bruckner et al. (2009).
Some of the trade data on which the modelling is based should be treated with caution as in- consistencies may distort the results. Such inconsistencies are known to exist with regard to re-exports and input-output tables. As re-exports are inconsistently reported to the OECD, this may create a bias in the results, especially for countries with high re-exports (such as Singa- pore, Luxembourg, or the Netherlands). Comprehensive documentation is available for the trade data used. In future research, this could be used to adapt the data and exclude all re- exports in order to achieve greater consistency.
Care should also be taken with regard to the data estimations of the countries and country groups with incomplete data (trade data and/or input-output tables), and whose input-output
Counting CO2 emissions in a globalised world: Producer versus consumer-oriented methods for CO2 accounting
German Development Institute / Deutsches Institut für Entwicklungspolitik (DIE) 9 structures were assumed to be the same as those of neighbouring countries or countries with similar economic characteristics (see Table 2).9 In this group of countries and regions, the results for the OPEC group, Mexico, and South Africa should be treated with caution because of their high share in global production-based CO2 emissions (6.6%).
Table 2: Assumed input-output structure for countries without available input-output data
Country Assumed structure of
Bulgaria Poland
Cyprus Greece
Latvia Poland
Lithuania Poland
Luxembourg Belgium
Malaysia Korea
Malta Greece
OPEC Indonesia
Philippines Korea
Singapore Korea
Switzerland Germany
Thailand Korea
Rest of the World Argentina
In GRAM the structure of the Argentinean economy is used for the group of “Rest of the World” (RoW) as Argentina is the country among the countries included in the OECD input- output dataset whose economic structure likely coincides best with the region RoW (Giljum et al. 2008). This assumption has led to a considerable overestimation of the production-based emissions of the G77 in the modelling results and therefore also in analysing embodied emis- sions in exports. Sensitivity analysis, i.e. testing different economic structures for RoW and their impacts could further clarify the dimension of this error.
3 Comparing consumption-based and production-based emissions
In this section we present selected results from the model calculations.10 Table 3 provides an overview of production-based and consumption-based carbon emissions, carbon trade bal- ances and the difference between consumption and production-based carbon emissions for the
9 Such estimations are needed to complete a multi-regional input-output model at the global level and are therefore common practice in MRIO modelling.
10 All data used for the calculations in this paper are available from the authors upon request.
Martin Bruckner / Christine Polzin / Stefan Giljum
10 German Development Institute / Deutsches Institut für Entwicklungspolitik (DIE) Table 3: Production and consumption-based emissions, carbon trade balances and shares in global
shifts of selected countries, 1995 and 2005 Production-based
emissions (Mt CO2)
Consumption-based emissions (Mt CO2)
Carbon trade bal- ance (Mt CO2)
Share in global carbon shifts (%) Country
1995 2005 1995 2005 1995 2005 1995 2005
Australia 265 359 300 469 35 109 1.5% 2.6%
Canada 389 497 415 547 26 50 1.1% 1.2%
France 340 366 496 641 157 275 6.5% 6.6%
Germany 861 805 1,023 1,061 162 257 6.7% 6.1%
Italy 379 430 532 610 153 180 6.3% 4.3%
Japan 1,099 1,193 1,530 1,573 431 380 17.8% 9.1%
Korea 304 460 360 496 56 36 2.3% 0.9%
Mexico 286 367 280 433 -6 66 -0.2% 1.6%
Netherlands 173 214 217 310 44 96 1.8% 2.3%
Spain 229 325 253 443 24 119 1.0% 2.8%
United Kingdom 514 596 737 827 222 232 9.2% 5.5%
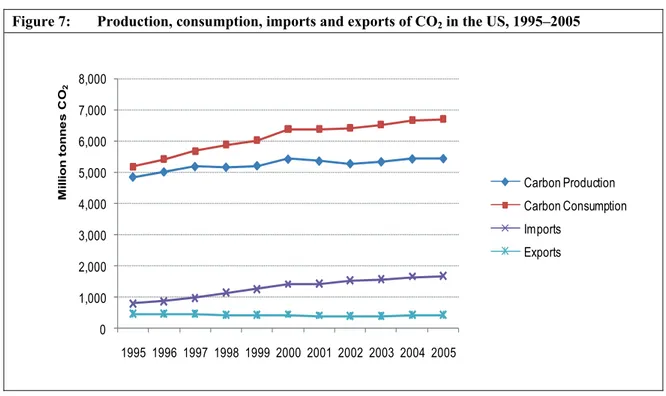
United States 4,841 5,447 5,181 6,702 340 1,255 14.1% 29.9%
Rest of OECD 1,282 1,403 1,627 1,903 345 500 14.3% 11.9%
OECD 10,962 12,461 12,951 16,014 1,989 3,553 82.2% 84.6%
Argentina 104 158 126 132 22 -27 0.9% -0.6%
Brazil 208 283 252 298 44 15 1.8% 0.4%
Chile 44 69 40 55 -4 -14 -0.2% -0.3%
China 3,079 4,748 2,473 3,757 -607 -990 -25.1% -23.6%
India 795 1,256 707 1,121 -88 -136 -3.6% -3.2%
Indonesia 180 308 241 342 61 33 2.5% 0.8%
Malaysia 104 226 75 124 -28 -102 -1.2% -2.4%
Philippines 53 76 60 68 7 -8 0.3% -0.2%
South Africa 239 323 212 293 -26 -30 -1.1% -0.7%
Thailand 136 283 145 190 10 -93 0.4% -2.2%
OPEC 863 1,171 1,074 1,703 210 532 8.7% 12.7%
Rest of G77 3,557 4,799 2,102 2,475 -1,454 -2,324 -58.9% -54.1%
G77 9,414 13,779 7,588 10,635 -1,826 -3,144 -75.5% -74.9%
Russian Federation 1,071 1,274 885 945 -186 -330 -7.7% -7.9%
Rest of the world 400 600 422 521 23 -79 0.9% -1.9%
World Total 21,847 28,115 21,847 28,115 0 0 0.0% 0.0%
Counting CO2 emissions in a globalised world: Producer versus consumer-oriented methods for CO2 accounting
German Development Institute / Deutsches Institut für Entwicklungspolitik (DIE) 11 years 1995 and 2005.11 Twelve members of the OECD and the G77 (a group of 130 develop- ing states), two of the major negotiation blocks in climate change talks, are shown in detail as well as the average figures for two regions, the Russian Federation and the Rest of the World.
The table also shows the development of the emissions of the world as a whole.
Some general patterns can be observed. Global carbon emissions have increased by 29% be- tween 1995 and 2005, from 21,800 Mt to 28,100 Mt. During this period, the global gap be- tween production-based and consumption-based CO2 emissions has also grown. CO2 emis- sions embodied in internationally traded goods accounted for 27% of all energy-related CO2
emissions in 2005, up from 22% in 1995.
Overall, the OECD countries had a positive carbon trade balance, with net imports of 3,600 Mt CO2 in 2005, compared to 2,000 Mt in 1995. In all OECD countries, consumption- based CO2 emissions are higher than production-based emissions. The OECD countries thus consume almost 30% more CO2 emissions than they produce. The growth of production- based emissions was smaller than that of consumption-based emissions (14% vs. 24%). Many OECD countries produce low carbon goods and services while importing and consuming car- bon-intensive goods (such as steel, iron, aluminium, and glass). In France, for example, con- sumption-based emissions exceeded production-based emissions by 75% in 2005. In Korea, this difference was only 8%. Especially smaller OECD countries which are highly dependent on trade have significantly larger emissions from consumption than from production. These trends are also reflected in global carbon shifts which describe the relocation of embodied carbon emissions worldwide. Thus, the share in global carbon shifts is the proportion of all global embodied emissions in trade imported or exported by a country or region. In 2005, the OECD imported 85% of all emissions embodied in trade. The largest share of traded emis- sions within the OECD (30% of all global embodied emissions in trade) was destined for the US.
The large majority of developing countries are net exporters of emissions. Using the produc- tion-based accounting approach, the G77 produced 11% more emissions than the OECD in 2005 (13,800 Mt CO2 vs. 12,500 Mt CO2). With a consumption-based approach, the G77 has about 60% fewer emissions than the OECD (10,600 Mt CO2 vs. 16,000 Mt CO2). The growth of emissions between 1995 and 2005 was larger when measured on a production basis than on a consumption basis (46% vs. 40%) but in both terms still significantly larger than in the OECD countries. This is also reflected in the carbon trade balance deficit, which increased significantly during this time. In 2005, the G77 had a combined CO2 trade deficit of 3,100 Mt and thus delivered almost all the net imports of the OECD countries. In 1995, this deficit was only 1,800 Mt CO2. In contrast to the OECD countries, the G77 countries consume 23% less CO2 emissions than they produce. In some G77 countries such as Argentina, the Philippines and Thailand, the carbon trade balance has turned from surplus into deficit between 1995 and 2005. National CO2 targets may be more difficult to achieve when a growing part of territorial emissions is caused by foreign demand. Measuring Thailand’s CO2 emissions on a consump- tion rather than production basis reduces the growth rate of emissions from 108% to 31% be- tween 1995 and 2005. In Argentina, consumption only caused an increase of 4.3% of CO2
11 Munksgaard and Pedersen (2001) developed the concept of ‘CO2 trade balances’. The carbon trade balance of a country is the difference between embedded CO2 emissions from imports and exports. A positive carbon trade balance means that more emissions were imported than exported. In contrast, when the ordinary trade balance is positive, the monetary value of exports exceeds that of imports.
Martin Bruckner / Christine Polzin / Stefan Giljum
12 German Development Institute / Deutsches Institut für Entwicklungspolitik (DIE)
emissions, while overall production emissions (including for exports) increased by more than 50%. The consumption-based emissions of the OPEC countries have grown faster than those from production between 1995 and 2005 (59% vs. 36%). In the G77, China is the largest net exporter of emissions, accounting for the export of almost one quarter of all global emissions embodied in trade.
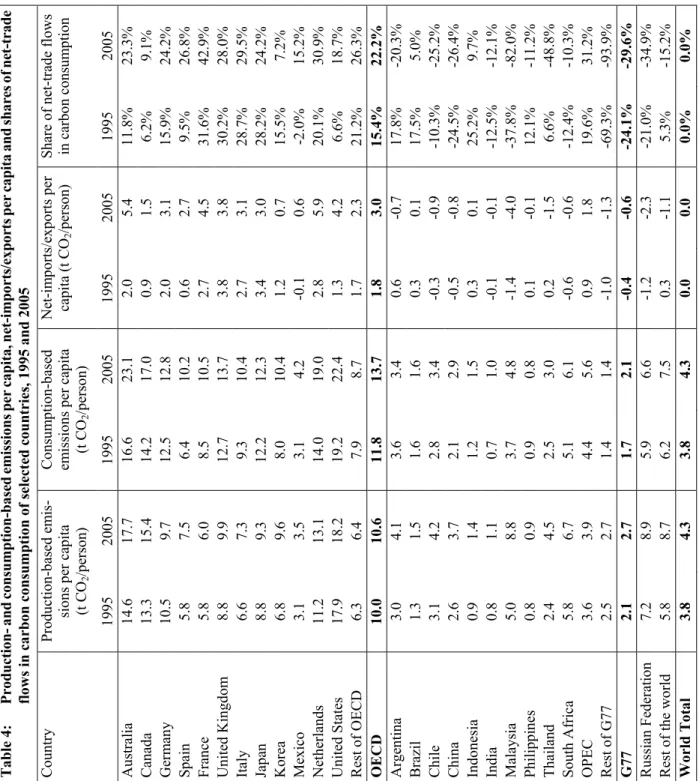
Table 4 shows the production and consumption-based CO2 emissions per capita, net imports or exports per capita as well as the share of net trade flows in carbon consumption. The global average per capita CO2 emissions were 4.3 t in 2005, an increase of 0.5 t from the year 1995.
The table again confirms that all OECD countries have higher consumption-based than pro- duction based CO2 emissions, also on a per capita basis. The largest per capita emissions in 2005 were produced by the US (18 t CO2/person), Australia (18 t CO2/person), and Canada (15 t CO2/person). The majority of G77 countries, in contrast, have lower emissions on a con- sumption basis than on a production basis per person. Between 1995 and 2005, the OECD’s net imports of CO2 per capita increased by 67% (from 1.8 to 3.0 t CO2/person). On average, the Netherlands import 5.9 t per person of embodied CO2 emissions, Australia 5.4 t, and France 4.5 t.
Most G77 countries have net exports per capita, but the values vary significantly. For exam- ple, China’s net exports of embodied CO2 emissions per capita are eight times higher than those of India (0.8 vs. 0.1 t CO2/person). Please note, however, that the data uncertainties for the G77 are comparatively high.
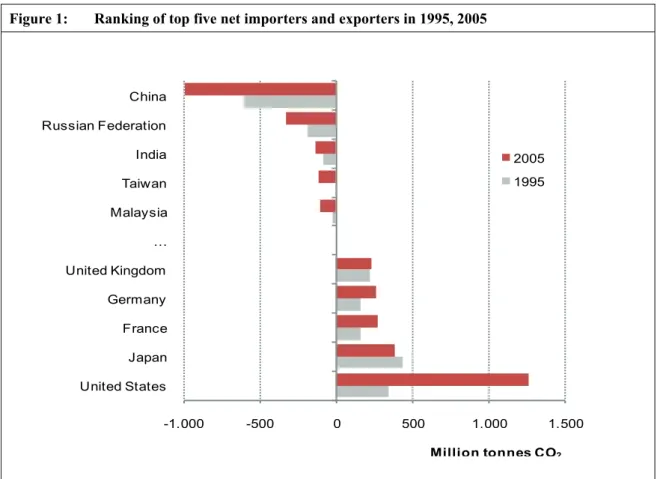
The top five net importers and exporters of embodied CO2 emissions are shown in Figure 1.
Together they accounted for 2,400 Mt of net imported CO2 in 2005 (up from 1,300 Mt in 1995). The largest net importer, the US, accounted for 1,255 Mt CO2 (about 30% of global net imports), followed by Japan (380 Mt) and the biggest European economies (France 275 Mt, Germany 257 Mt, and the UK 232 Mt). Most OECD countries increased net-imports from 1995 to 2005, most significantly the US, where the negative carbon trade balance increased by almost a factor of four. This can be explained by the rapidly growing imports of the US, in particular from China. In Japan, on the contrary, net-imports of CO2 emissions were slightly lower in 2005 compared to 1995 when it was still the largest net importer (431 Mt CO2).
Net CO2 exports were shared among a larger number of countries. While the top 5 net import- ers of CO2 accounted for 2,400 Mt of net imported CO2 (8.5% of global CO2 emissions, or 57% of global net imports), the top five net exporters accounted for 1,670 Mt of net exported CO2 in 2005 (up from 900 Mt in 1995). These net exports represented 6% of global CO2
emissions, or 40% of global net exports. The largest net exporters were China with 990 Mt CO2 (an increase of 63% compared to 1995), the Russian Federation (330 Mt) and India (136 Mt). Thus, net imports of CO2 emissions are relatively concentrated in a few highly industrial- ised countries while about half of all net exports are supplied by the large emerging econo- mies of China, the Russian Federation and India, and the other half is supplied by a larger number of countries from the G77.
Table 4: Production- and consumption-based emissions per capita, net-imports/exports per capita and shares of net-trade flows in carbon consumption of selected countries, 1995 and 2005 Production-based emis- sions per capita (t CO2/person) Consumption-based emissions per capita (t CO2/person)
Net-imports/exports per capita (t CO2/person)Share of net-trade flows in carbon consumption Country 19952005 19952005 1995 2005 19952005 Australia14.6 17.7 16.6 23.1 2.0 5.4 11.8% 23.3% Canada 13.3 15.4 14.2 17.0 0.9 1.5 6.2% 9.1% Germany10.5 9.7 12.5 12.8 2.0 3.1 15.9% 24.2% Spain 5.8 7.5 6.4 10.2 0.6 2.7 9.5% 26.8% France 5.8 6.0 8.5 10.5 2.7 4.5 31.6% 42.9% United Kingdom 8.8 9.9 12.713.7 3.83.8 30.2% 28.0% Italy 6.6 7.3 9.3 10.4 2.7 3.1 28.7% 29.5% Japan 8.8 9.3 12.2 12.3 3.4 3.0 28.2% 24.2% Korea 6.8 9.6 8.0 10.4 1.2 0.7 15.5% 7.2% Mexico 3.1 3.5 3.1 4.2 -0.1 0.6 -2.0% 15.2% Netherlands 11.2 13.1 14.0 19.0 2.8 5.9 20.1% 30.9% United States 17.9 18.2 19.2 22.4 1.3 4.2 6.6% 18.7% Rest of OECD6.3 6.4 7.9 8.7 1.7 2.3 21.2% 26.3% OECD 10.0 10.6 11.8 13.7 1.8 3.0 15.4%22.2% Argentina 3.0 4.1 3.6 3.4 0.6 -0.7 17.8% -20.3% Brazil 1.3 1.5 1.6 1.6 0.3 0.1 17.5% 5.0% Chile3.1 4.2 2.8 3.4 -0.3 -0.9 -10.3% -25.2% China 2.6 3.7 2.1 2.9 -0.5 -0.8 -24.5% -26.4% Indonesia 0.9 1.4 1.2 1.5 0.3 0.1 25.2% 9.7% India 0.8 1.1 0.7 1.0 -0.1 -0.1 -12.5% -12.1% Malaysia 5.0 8.8 3.7 4.8 -1.4 -4.0 -37.8% -82.0% Philippines 0.8 0.9 0.9 0.8 0.1 -0.1 12.1% -11.2% Thailand2.4 4.5 2.5 3.0 0.2 -1.5 6.6% -48.8% South Africa 5.8 6.7 5.1 6.1 -0.6 -0.6 -12.4% -10.3% OPEC3.6 3.9 4.4 5.6 0.9 1.8 19.6% 31.2% Rest of G77 2.5 2.7 1.4 1.4 -1.0 -1.3 -69.3% -93.9% G77 2.1 2.7 1.7 2.1 -0.4 -0.6 -24.1%-29.6% Russian Federation 7.2 8.9 5.9 6.6 -1.2 -2.3 -21.0% -34.9% Rest of the world 5.8 8.7 6.2 7.5 0.3 -1.1 5.3% -15.2% World Total3.8 4.3 3.8 4.3 0.0 0.0 0.0%0.0%
Martin Bruckner / Christine Polzin / Stefan Giljum
14 German Development Institute / Deutsches Institut für Entwicklungspolitik (DIE) Figure 1: Ranking of top five net importers and exporters in 1995, 2005
The country rankings of embodied emissions can also be evaluated in per capita figures (Figure 2).
Figure 2: Consumption-based CO2 emissions per capita, 2005
-1.000 -500 0 500 1.000 1.500
United States Japan France Germany United Kingdom
… Malaysia Taiwan India Russian Federation China
Million tonnes CO2
2005 1995
0 5 10 15 20 25
Tonnes CO2per person
Counting CO2 emissions in a globalised world: Producer versus consumer-oriented methods for CO2 accounting
German Development Institute / Deutsches Institut für Entwicklungspolitik (DIE) 15 In terms of consumption-based emissions per capita, Australia leads the ranking (23 t CO2), followed by the US (22 t CO2) and the Netherlands (19 t CO2). Mexico consumed the fewest emissions per capita in the OECD (4.2 t CO2) in 2005.
With an average of 2.1 tonnes per capita, consumption-based emissions are by a factor of 6 lower in the G77 region than in the OECD countries. With 2.9 tonnes per capita, China is still well below the world average of 4.3 tonnes per capita. India’s per capita consumption-based emissions were as low as 1 tonne.
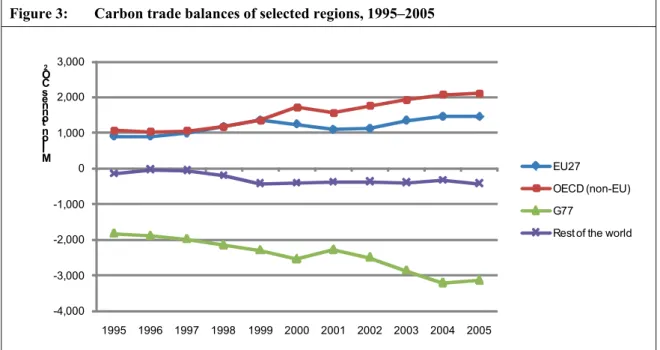
Figure 3 shows the developments of the carbon trade balance of selected countries from 1995 to 2005. This balance is also called ‘Balance of Emissions Embodied in Trade’ (BEET). Com- paring the developments in the industrialised countries it is noticeable that the growth of the carbon trade surplus was lower in the EU-27 than in the non-EU OECD countries between 2000 and 2005. In the EU-27 the carbon trade surplus grew from 903 Mt CO2 in 1995 to 1,455 Mt in 2005 (61%). In the other OECD countries the surplus grew from 1,071 Mt CO2 in 1995 to 2,114 Mt in 2005 (97%).
These emissions were largely produced by the G77 whose carbon trade deficit increased ac- cordingly from 1,826 Mt in 1995 to 3,144 Mt CO2 emissions in 2005 (72%). A small but con- siderably growing share of embodied emissions in trade came from the rest of the world.
Thus, the gap between net importers (EU27 and non-EU OECD) and net exporters (G77 and the Rest of the World) has clearly grown between 1995 and 2005.
Please note that these balances should not be interpreted as a value judgement (e.g. a country should export more emissions than it imports). For the global environment it may be more beneficial to produce goods where it is most resource efficient and where the embedded GHG emissions are lowest (Peters / Hertwich 2008c), and then trade these products internationally as long as efficiency advantages of production are not cancelled out by resource requirements and carbon dioxide emissions of transport. The environmental comparative advantage would then determine which countries have positive or negative carbon trade balances.
Figure 3: Carbon trade balances of selected regions, 1995–2005
-4,000 -3,000 -2,000 -1,000 0 1,000 2,000 3,000
1995 1996 1997 1998 1999 2000 2001 2002 2003 2004 2005 Mill
ion to nn es CO2
EU27 OECD (non-EU) G77
Rest of the world
Martin Bruckner / Christine Polzin / Stefan Giljum
16 German Development Institute / Deutsches Institut für Entwicklungspolitik (DIE)
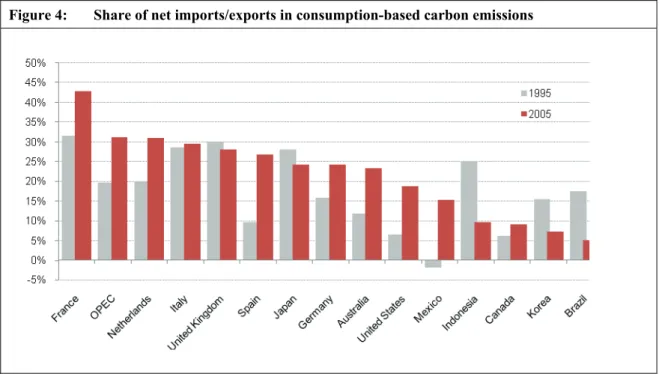
Figure 4 illustrates the shares of net imports or exports in carbon consumption in 1995 and 2005 for the 15 countries or regions with the highest net imports plus China and India in 2005. In France, the country with the highest proportion of carbon imports, 43% of all carbon emissions related to consumption were embodied in imports. France, the OPEC, the Nether- lands, Italy, Spain, Germany, Australia, the US and Canada increased their shares of net im- ports in consumption-based carbon emissions between 1995 and 2005. While Mexico was still a net exporter of consumption-based carbon emissions the country turned into the 11th biggest net importer in 2005. The UK, Japan, Indonesia, Korea and Brazil on the other hand de- creased their shares of net imports between 1995 and 2005. Both China and India are clear net exporters of CO2 emissions. In 2005, India’s share of net exports in carbon consumption was - 12% (up from -13% in 1995), and China’s share was -26% (down from -25% in 1995).
Figure 4: Share of net imports/exports in consumption-based carbon emissions
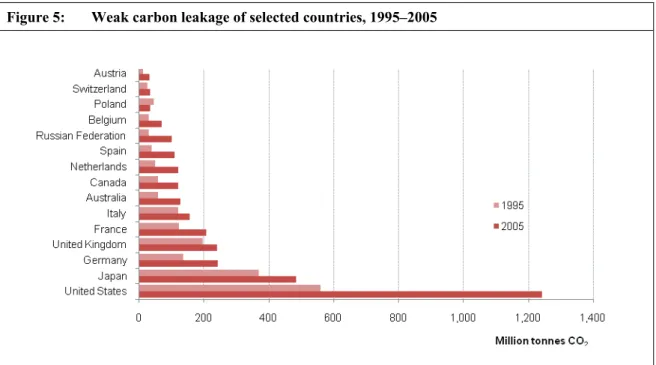
Figure 5 shows the weak carbon leakage from selected Annex I countries in 1995 and 2005, i.e. the imports of embodied CO2 emissions from non-Annex I to Annex I countries. There are notable differences in the total amounts of carbon leakage, especially among the large coun- tries leading the ranking. The highest carbon leakage occurred in the United States where 1,250 Mt CO2 (4.1 t CO2/person) from consumption originated from non-Annex I countries in 2005, an increase of 680 Mt compared to 1995. In Japan, second after the US, 485 Mt CO2
(3.8 t CO2/person) from consumption originated from non-Annex I countries in 2005 (an in- crease of 31% compared to 1995), in Germany carbon leakage amounted to 244 Mt CO2 (2.9 t CO2/person) (77% more than in 1995). In total, the European Union imported 1,450 Mt CO2
(3.0 t CO2/person) from non-Annex I countries. The growth rates of leakage from 1995 to 2005 also varied considerably between different countries: among the Annex I countries they ranged from -61% in Slovakia to 351% in Greece.
The results also confirm the global shift of CO2 emissions that is enabled by international trade (see Table 5). In 1995 the imports of embodied CO2 emissions in Annex I countries was about 2,100 Mt (10% of the global energy related CO2 emissions). By 2005 these emissions had increased to 3,600 Mt CO2 (12.8% of all global CO2 emissions). This means that around a
Counting CO2 emissions in a globalised world: Producer versus consumer-oriented methods for CO2 accounting
German Development Institute / Deutsches Institut für Entwicklungspolitik (DIE) 17 quarter of the emissions increase in non-Annex I countries between 1995 and 2005 was caused by the consumption in Annex I countries.
Table 5: Share of weak carbon leakage in production, 1995 and 2005
1995 2005 Difference
Total weak carbon leakage (in Mt) 2,096 3,603 1,507
Share in CO2 production 9.6% 12.8% 24.0%
Figure 6 shows the production, consumption, imports and exports of CO2 in China in 1995 and 2005. All of these emissions have increased during this time. Production-based emissions have risen steeply in China since 2001, not only because of growing exports but also due to higher domestic consumption. Total embodied emissions have constantly been larger in ex- ports than in imports, and the gap between the two has widened. According to the OECD (2009), industry accounted for 65% of China’s economic output in 2005. Energy-intensive industries such as steel, cement, and chemicals, provide inputs to China’s large export and construction sectors, which are still flourishing.
The increased production in China has also turned the country into a net oil importer. While China was still a net oil exporter during the 1980s, the country became a net oil importer in 1993 and has become increasingly dependent on foreign oil. According to the IEA World En- ergy Outlook (IEA 2009), China will overtake the US around 2025 to become the world’s biggest spender on oil and gas imports.
Figure 5: Weak carbon leakage of selected countries, 1995–2005