From Poverty Reduction to Mutual Interests?
Svea Koch
The debate on differentiation in EU
development policy
development policy
Svea Koch
DIE Research Project
“EU Development Policy to 2020
Meeting Internal and External Challenges”
Bonn 2012
Die deutsche Nationalbibliothek verzeichnet diese Publikation in der Deutschen Nationalbibliografie;
detaillierte bibliografische Daten sind im Internet über http://dnb.d-nb.de abrufbar.
The Deutsche Nationalbibliothek lists this publication in the Deutsche Nationalbibliografie; detailed bibliographic data is available in the Internet at http://dnb.d-nb.de.
ISBN 978-3-88985-556-5
Svea Koch is a social scientist and researcher at Department I “bi- and multilateral development cooperation” of the German Development Institute / Deutsches Institut für Entwicklungspolitik (DIE) since 2011. Her main research focus is on the effectiveness of European development policy.
E-mail: svea.koch@die-gdi.de
© Deutsches Institut für Entwicklungspolitik gGmbH Tulpenfeld 6, 53113 Bonn
+49 (0)228 94927-0 +49 (0)228 94927-130 E-mail: die@die-gdi.de http://www.die-gdi.de
This paper looks into the issue of how European Union (EU) development policy can respond to a changing development landscape that is characterised by a different geography of power and wealth and a changing geography of global poverty. The question of how to differentiate its partnerships and how to best engage with middle-income countries (MICs) has been among the most discussed issues in the ongoing process of modernising EU development policy. The analysis in this paper puts the question of aid to MICs in the context of two interlinked challenges: (i) the need to reconceptualise dominant approaches to global poverty reduction that prioritise national income as a key guiding criterion to classify countries, and (ii) the growing range of global challenges that require development policy to diversify its objectives. With regards to the implications for EU development policy, the paper draws two main conclusions. First, tackling global poverty needs a better coordinated cross-country division of labour at the EU level to avoid marginalising countries that have become wealthier in per capita terms but that continue to experience internal development challenges. Second, addressing challenges related to complex global public goods requires EU development policy to continue its engagement with emerging economies and other increasingly powerful developing countries. Such diversification of objectives, however, will increase the coordination challenges of EU development policy and other European external policies substantially.
Svea Koch Bonn, September 2012
Abbreviations
1 Introduction 1
2 The debate on differentiation in the EU context so far 3
3 The changing development landscape 8
3.1 The changing geography of growth 8
3.2 The changing geography of poverty 12
4 Two evolving challenges 18
4.1 Poor countries or poor people? 19
4.2 A global rationale for development policy 25
4.3 The interrelatedness of poverty reduction and global challenges 28
5 Implications for EU development policy 31
Bibliography 37
Figure 1: Comparison of aid flows by income group: EC and DAC totals for 2009 6
Figure 2: Share of the global economy 1990–2030 10
Figure 3: The increase of MICs from 1990 to 2011 15
Table 1: Distribution of the global poor in 2007/2008 by country type (%) 13
ACP African, Caribbean and Pacific Group of States
ALOP Asociacion Latinoamericana de Organizaciones de Promocion / International Land Coalition
APRODEV Association of World Council of Churches Related Development Organisations in Europe
BMZ Bundesministerium für wirtschaftliche Zusammenarbeit und Entwicklung / Federal Ministry for Economic Cooperation and Development
CIDSE Coopération Internationale pour le Développement et la Solidarité / International Cooperation for Development and Solidarity
CIFCA Iniciativa de Copenhague para Centroamérica y México DAC Development Assistance Committee
DCI Development Cooperation Instrument
DIE Deutsches Institut für Entwicklungspolitik / German Development Institute DFID Department for International Development
DGM French Directorate-General of Global Affairs, Development and Partnerships
ECOSOC United Nations Economic and Social Council EDF European Development Fund
ENPI European Neighbourhood Policy Instrument EU European Union
FDI Foreign Direct Investment GNI Gross National Income GPG Global Public Good
LDC Least-developed Country LMIC Lower-middle-income Country LIC Low-income Country
MDG Millennium Development Goal MIC Middle-income Country MPI Multi-dimensional Poverty Index
OECD Organisation for Economic Co-operation and Development OLICs Other Low-income Countries
UNDP United Nations Development Programme UNFPA United Nations Population Fund
UNOFS United Nations Organization for Food Security
1 Introduction
The global development landscape is changing tremendously and presents the challenge for European development1 policy to change with it. The distinction between “developed”
and “developing” countries, the transfer of aid from the world’s wealthiest to the world’s poorest countries and the perception that poverty is predominantly the problem of poor countries have long been central to development policy. However, separating the world into “poor” and “rich”, “North” and “South”, and “donors” and “recipients” has become increasingly ill-suited to capture the changing relationships among countries. Over the last two decades, many developing countries have seen considerable economic growth, which has resulted in a changing geography of wealth and power with geopolitical ramifications.
In this increasingly heterogeneous and differentiated development landscape, only 36 countries remain classified as “low-income”2 (the most widely used term for a poor country), while the number of countries with higher per capita incomes has increased significantly. As countries become richer in per capita terms, they are also becoming less dependent on aid; development assistance typically accounts for a marginal share of the national budget and a country’s gross national income (GNI). Against this background, it is increasingly being questioned whether it is still appropriate to provide EU aid to countries that appear wealthy enough to fund their own development without external financial assistance.
But even if income disparities between developing countries and those in the Organisation for Economic Co-operation and Development (OECD) are on the decline, the challenges of poverty reduction and inequality remain unresolved. In many developing countries, rapid economic growth was accompanied by an increase in social inequalities and insufficient reductions in poverty. A widely read study of Sumner (2010b) highlighted that more than 70 per cent of the world’s poorest people – what he calls a “new bottom billion”
– do not live in low-income countries, but rather in middle-income countries (MICs).
Development agencies in the EU and OECD countries that have committed themselves to global poverty reduction are still coming to terms with this new geography of wealth and power on the one hand, and the new geography of poverty on the other.
At the same time, global development challenges beyond poverty reduction have gained importance. Intensifying globalisation and the frequency and intensity of global crises in recent years have revealed the increasing interconnectedness of the world and the global nature of development challenges. In such a globalised world, major challenges such as climate change, food insecurity, financial instability, communicable diseases, migration, conflict and insecurity are not only challenges that potentially affect us all; they also ultimately depend on the development paths of developing and emerging countries and their commitments and cooperation in global governance processes. Development policy
1 For the purpose of this paper, the term “EU development policy” is used rather than solely referring to the European Commission. The degree of independence of a supranational actor such as the European Commission is limited due to the influence on decision-making of the member states (Tallberg 2002;
Furness 2010). However, the focus of this paper does not include bilateral aid programmes of member states but refers to aid that is spent through Community Institutions in Brussels.
2 This is according to the latest World Bank classifications of 2012.
can play an important role in addressing these complex challenges. Its objectives, therefore, need to diversify and new forms of cooperation with influential non-OECD countries need to be sought.
For EU development policy, the concomitance of these developments poses significant challenges. On the policy level, the EU has so far emphasised the primacy of poverty reduction in its development programmes – an approach that has become increasingly incompatible with the large and increasingly heterogeneous partner country portfolio of the EU. Recognising the need to adapt its policies and objectives to a changing international environment, the EU is currently in the process of modernising its development policy. The need for greater differentiation between partner countries and the extent to which MICs should continue to receive EU aid are key points of the EU’s new development policy agenda3 and the negotiations on the next EU multi-annual financial framework.4 According to the European Commission’s Communication and the Council Conclusions of 14 May 2012,5 the EU plans to withdraw its bilateral development cooperation programmes from 19 developing countries6 that have either reached upper- middle-income status or account for 1 per cent of global GNI. On a more conceptual basis, the EU aims to better calibrate and target partner engagements and to include strategically- oriented policy objectives alongside a strict poverty reduction remit. In other words, the argument for differentiation is that development cooperation with more advanced countries should shift focus from poverty reduction to global challenges and mutual interests (Gavas et al. 2011).
So far, research has mainly focussed on analysing the changing distribution of wealth (e.g.
Spence 2011; OECD 2010; Rodrik 2011), the increasingly global rationale of development policy (e.g. Severino / Ray 2009; van Lieshout et al. 2010) or the question of aid to MICs on a conceptual basis (e.g. Alonso et al. 2007; Kanbur 2010; Fenton 2008;
Sumner 2011a; Kanbur / Sumner 2011). These discussions have not yet been combined and analysed from the specific perspective of EU development policy. This paper contributes towards filling this gap by synthesising existing debates and by outlining the implications of a changing development landscape for the EU’s engagement with MICs. It does not attempt to provide an in-depth analysis of the restructuring of the global economy, geopolitical power shifts, global challenges or the changing patterns of global poverty. Rather, it aims to identify the main trends of a changing development landscape that need to be considered in the strategic reorganisation of EU development cooperation with MICs.
The remainder of this paper will outline the challenges of such a reorientation of EU development policy.The paper argues that the question of development cooperation with MICs needs to be answered in the context of two interlinked challenges: (i) the need to reconceptualise dominant approaches to global poverty reduction that prioritise national
3 “Increasing the impact of EU development policy: an agenda for change” (COM (2011) 637 final).
4 “Global Europe: a new approach to financing EU external action” (COM (2011) 865 final).
5 See: http://www.consilium.europa.eu/uedocs/cms_Data/docs/pressdata/EN/foraff/130243.pdf.
6 Argentina, Brazil, Chile, China, Colombia, Costa Rica, Ecuador, Kazakhstan, India, Indonesia, Iran, Malaysia, the Maldives, Mexico, Panama, Peru, Thailand, Venezuela and Uruguay.
income as a key guiding criterion to classify countries and to design poverty-efficient aid allocations, and (ii) the growing range of global challenges that require development policy to diversify its objectives and to seek continued engagement with anchor countries and emerging economies.7 It argues that both challenges are interrelated and that, even from a global governance perspective, the EU should remain concerned about a recipient country’s internal development challenges. With regards to the implications for EU development policy, the paper derives two main conclusions. First, contributing to global poverty reduction will require a better coordinated cross-country division of labour at the EU level to ensure that countries with higher per capita incomes – but significant internal development challenges – are not left alone in their fight against poverty and social inequality. Second, addressing complex challenges relating to global public goods requires the EU to increasingly adopt a global development approach and to reorganise its development cooperation with anchor and emerging countries accordingly. This, however, will also increase the coordination challenges among European donor agencies and other European external policies substantially.
The paper starts off in Chapter 2 by analysing the past debate on aid to MICs at the EU level and the EU’s current approach. In Chapter 3, it analyses the main trends of the changing geographies of growth and poverty that require the EU to rethink and adapt its approaches and strategies towards MICs. The fourth chapter analyses two resulting challenges that need to be considered in discussions about continued or discontinued development cooperation with MICs: (i) the need to reconceptualise the poverty focus, and (ii) the global rationale for development policy. The last chapter outlines the implications of both challenges for EU development policy.
2 The debate on differentiation in the EU context so far
The question of how to best adapt development policy to the specific needs of countries with advanced development and higher levels of average income is not entirely new.8 Thus far, the reactions and strategies of European donors basically have fallen into two categories based on different rationales for providing aid: a narrow definition of development policy, which prioritises poverty reduction as the overarching objective for
7 In this paper, a distinction is made between anchor countries and emerging economies. Even though most anchor countries fall within the group of emerging economies, this is not necessarily the case.
Emerging economies are characterised by increasing per capita income, high growth rates and growing weight in global governance processes. Anchor countries, on the other hand, are characterised according to their economic and political weight in their respective regions (Stamm 2004).
8 In 2003, for example, DFID and the Spanish Agency for International Cooperation commissioned a study with the objective to outline the rationale for aid to MICs (Eyben et al. 2004). In 2005, DFID published a special strategy for their engagement in MICs titled “Achieving the Millennium Development Goals: the middle-income countries” (DFID 2005). The UN held a series of international conferences on development cooperation with middle-income countries between 2007 and 2009 and published a number of reports and resolutions exclusively dedicated to the question of how to undertake development cooperation with MICs (UN 2007, 2009). In 2007, the World Bank issued a special evaluation of its role in MICs (World Bank IEG 2007). In 2008 Oxfam commissioned a study with the aim to rethink the role of MICs in the development process, as it became clear that income status graduation cannot be considered as an endpoint to development (Fenton 2008).
development programmes and aid allocation to the poorest countries. By focussing mainly on the poorest countries, these donor agencies expect to have the greatest impact on poverty alleviation. The United Kingdom’s Department for International Development (DFID) and its 90/10 rule (90 per cent of aid resources for low-income countries (LICs) and 10 per cent for MICs) is the most prominent example of this approach. It is based on the dominant thinking at that time that there is less concentration of poverty in countries with higher average per capita incomes, and that poverty is predominantly a problem of poor countries. MICs, on the other hand, are expected to have greater access to international capital markets due to their better developed institutions and sound policies (Dollar / Pritchett 1998; Dollar / Levin 2004). As a consequence, these donors markedly reduced – or even withdrew – their aid to MICs.9
Other European donors have emphasised the need to conceptualise development policy beyond the narrow poverty reduction remit towards a global outlook on development. In this view, accelerating globalisation processes and the increasing interconnectedness of the world require development policy to focus on global challenges and key issues of global governance (Messner 2001; Faust / Messner 2006). Such a broad definition of development policy aims to contribute towards solving regional and global challenges in cooperation with non-OECD countries. For some EU donors, this has led to a diversification of the objectives of development policy: Germany and Sweden, for example, have increasingly shifted their strategies from “traditional” development policy and a focus on poverty reduction towards global structural policy or policy for global development.10
The latter shift of principles and objectives has also led to a different approach towards MICs and emerging economies. Rather than withdrawing from these countries, it was considered important to continue development cooperation but in a different manner (Altenburg / Stamm 2005). Germany’s “anchor country concept”11 (BMZ 2004) can be seen as a pioneering element in this respect and shaped the discussion at an early stage. It highlighted the external capacities of countries to create regional and global spillover
9 DFID’s 2011 bilateral aid review has led to a further concentration of aid in 27 partner countries and to a decision to end the bilateral relationship with 16 countries, of which 12 are MICs; see:
http://www.dfid.gov.uk/Media-Room/News-Stories/2011/The-future-of-UK-aid/. This process has been accompanied by a controversial debate about the continuation of UK aid to India (House of Commons 2011) and by a discussion about new partnerships with emerging economies; see:
http://www.chathamhouse.org.uk/files/18611_150211mitchell.pdf. In the Netherlands, a recent revision of Dutch development cooperation has led to a reduction in the number of partner countries from 33 to 15, of which only four are MICs. Upper-middle-income countries, for example, were excluded from the partner country selection from the beginning.
10 In Germany, the term “global structural policy” was introduced in the coalition treaty under the chancellorship of Gerhard Schröder in 1998. The objective of global structural policy was to take development policy out of its niche of project aid and interventions at the local level and to aim at working towards structural changes at the national and global levels. In 2003, Sweden announced a bill to introduce its “policy for global development”, which required not only the development ministry but all Swedish ministries to take due account of sustainable global development in all their policies and actions.
11 According to the updated definition of Leininger et al. (2009), “anchor countries are developing countries which, due to their economic weight in regional terms and due to their international role have the potential to create far-reaching spill-over effects and the state capacity to pro-actively influence regional and global processes” (ibid., 3).
effects as well as their central importance in global governance processes. A new cooperation approach was developed that was aimed at recognising the countries’
increased self-confidence, their economic and political roles in regional and global terms, and the importance of moving towards mutual interests in solving global development challenges. Internal development challenges and poverty reduction, on the other hand, received less attention and were considered to be the country’s own responsibility.
The EU can be considered a latecomer in these debates and has only started to address the issue of differentiation in its recent modernisation process. The EU’s current approach can thus best be described as a mismatch between policy objectives and partner country portfolio. The European Consensus on Development12 clearly states that the eradication of poverty is the primary and overarching objective of EU development cooperation, benchmarked against the Millennium Development Goals (MDGs). On a legal basis, this is also enshrined in the Lisbon Treaty (Art. 208), which has narrowed the focus and objective of EU development policy by making poverty reduction the central goal (Art.
208).13 The European Consensus furthermore states that official development assistance (ODA) allocations should prioritise support to least-developed countries (LDCs) and low- income countries (LICs). At the same time, it is also made clear that “[d]evelopment aid will continue to support poor people in all developing countries, including both low- income and middle-income countries (MICs)” (Article 10) and that “the EU also remains committed to supporting the pro-poor development of middle-income countries (MICs), especially the lower MICs […]” (Article 24).
Unlike those EU donors for whom a clear focus on poverty reduction has been accompanied by a strong concentration of aid to the poorest countries, the EU has so far not adapted its partner country portfolio or aid allocations. For the time being, the EU’s partner country portfolio includes 145 countries.14 In 2009, the European Commission allocated more of its aid budget (incl. the European Development Fund, EDF) to MICs (EC 54 per cent, DAC average 41 per cent) and less to LICs than the Development Assistance Committee (DAC) average (EC 46 per cent, DAC average 59 per cent). While spending in LDCs does not differ greatly from the DAC average (EC 39 per cent, DAC average 43 per cent), the biggest contrast relates to spending in upper-middle-income countries (EC 19 per cent, DAC average 9 per cent) (see Figure 1).
12 The 2005 “European Consensus on Development”, as a successor to the 2000 policy statement “The European Community’s development policy”, for the first time sets out a common vision and objectives that guide both the member states’ and the EU’s development policies.
13 This clear focus is a significant change to the language of the preceding Treaty of Nice (Art. 177), which mentioned three objectives on equal footing: the sustainable economic and social development of the developing countries, the smooth and gradual integration of the developing countries into the world economy and the campaign against poverty reduction in the developing countries.
14 There are 124 countries that receive ODA from the DCI and the EDF. Apart from the DCI and the EDF, the ENPI covers Europe’s 16 closest neighbours in Eastern Europe, the Mediterranean and the Caucasus, while the Instrument for Pre-Accession covers both candidate and potential candidate countries in the Western Balkans, Turkey and Iceland. The funds within both instruments are to a large extent ODA eligible. However, the rationale for “aid” to these countries is based on the EU’s own strategic interests rather than pure developmental outcomes. The ENPI and the Instrument for Pre- Accession can be considered as “the most strategically refined aid instruments that are most precisely attuned to EU interests” (Holden 2009, 183).
This above-average funding for MICs is one of the most frequent criticisms of EU development policy and is considered as a lack of focus on poverty (Booth / Herbert 2011;
Orbie / Versluys 2009; Dollar / Levin 2004). The 2007 DAC / Peer Review of the European Community echoes this criticism and states that “the Community has been under pressure from some Member States to increasingly concentrate on LDCs and other low-income countries, partly as a way to retain the poverty focus of its assistance” (OECD / DAC 2007, 40). One key challenge for the EU is therefore to concentrate its aid funds in better accordance with its overall objective of poverty reduction, but to do so based on a thorough understanding of changing patterns of poverty (see Section 3.1).
In doing so, the EU is confronting different obligations and framework conditions than member states. This relates particularly to a potential reduction of its partner country portfolio. The Cotonou Agreement provides the legal framework for governing the EU’s partnership with the African, Caribbean and Pacific (ACP) group of states. Due to the contractual nature of the Cotonou Agreement, any cuts in aid or stalling of bilateral development cooperation will have to pass the dialogue principle and be mutually agreed by the EU and the ACP. This is the main reason why the debate on differentiation has so far mainly focussed on countries in Latin America, Asia and Central Asia, the Gulf region and South Africa that are funded by the Development Cooperation Instrument (DCI). In addition, the EU is expected to act in complementarity vis-à-vis member states’ bilateral programmes, and one of its identified comparative advantages is to maintain global presence: “The Commission is present as a development partner in more countries than even the largest of the Member States, and in some cases is the only EU partner substantially present […] covering practically every developing country and region […]”
(European Parliament / Council / Commission 2006, 8). Thus, a potential partner country reduction has to include a discussion about the EU’s role vis-à-vis member states’
programmes and the extent to which the mandate of a global presence requires an adaptation of the strategic orientation of EU development policy.
Figure 1: Comparison of aid flows by income group: EC and DAC totals for 2009
Source: Own based on http://stats.oecd.org/Index.aspx?DatasetCode=ODA_DONOR
The central mismatch that has evolved in EU development policy relates to its formal adoption of one overarching policy objective in its policies and programmes on the one hand, and its global presence on the other. In order to respond to an increasingly heterogeneous and differentiated development landscape, the narrow focus on poverty reduction has proven to be too limited. This became particularly evident with the example of the DCI. Many countries that are covered by the DCI have achieved higher per-capita income, meaning that the instrument now has a strong MIC focus.15 Yet, its regulation requires all programmes to be consistent with the overall objective of poverty reduction.
The limitations of this approach became particularly visible during the mid-term review of the DCI. During this process, the European Parliament raised concerns that some of the actions programmed under the DCI’s geographic programmes would not meet ODA criteria. They added that the actions programmed were not sufficiently oriented towards the poverty eradication objective and the pursuit of the MDGs before they called for the withdrawal of these measures. The Commission, on the other hand, argued that it is becoming increasingly important to have the scope to fund measures beyond ODA in emerging economies such as China, Brazil and India and in several dynamic developing countries.16
Looking at country programming, one can see that in most emerging economies and countries with higher levels of development, the EU is currently in a transition phase.
While maintaining the traditional focus on poverty reduction, most Country Strategy Papers of emerging economies increasingly include a more strategic orientation towards areas of mutual interest. In India, the EU follows a “two-pronged approach”. While still committed to fighting poverty, the EU’s objectives have become more strategic, moving
“away from the aid rhetoric that had no objective beyond poverty reduction” (Coulon 2008). Traditional development assistance is thus increasingly moving towards trade, economic and cultural cooperation, and areas of mutual interest such as energy, transport and the environment (ibid.). The Country Strategy Paper for China 2007–2013 notes that China is moving away from being a traditional ODA recipient and that the cooperation programme is an important mechanism to support the EU’s own major economic and political interests in China’s development. Poverty reduction objectives (mostly by supporting social protection mechanisms and the decent work agenda) are therefore combined with mutual interests such as climate change, the improvement of financial services and trade cooperation. The Country Strategy Paper for Brazil 2007–2013 acknowledges the limited impact that the EU can have on poverty reduction – given the low aid dependency of Brazil – and emphasises that ODA is not the key to Brazil’s development. Moreover, the 2009 Communication of the Commission “The European Union and Latin America: Global Players in Partnership” highlights the need to increasingly integrate activities of mutual interest alongside activities aimed at poverty reduction, in particular in emerging economies and MICs in the region:
15 According to the list of countries in the amended regulation of 14 October 2009 and comparing this list with the 2011 World Bank classifications, most countries receiving funds from the DCI are either lower- middle-income countries (LMICs) (47 per cent) or upper-middle-income countries (UPMICs) (33 per cent), while low-income countries account for only 20 per cent.
16 “Mid-term review of the financial instruments for external actions” (COM (2009) 196 final).
„The merits of significantly diversifying the instruments and targets of EC cooperation should be explored. While concentrating financial resources on the poorest countries, the EU should look for new forms of cooperation with countries with higher levels of development. For all countries, this may entail putting more emphasis on cooperation in areas such as climate change (mitigation and adaptation), higher education, multi- lingualism research, science and technology, including energy efficiency and renewable energy, to complement joint efforts” (European Commission 2009b, 9)
A second challenge for the EU therefore relates to reconceptualising its development cooperation, increasingly targeting a portfolio of strategic objectives and refocusing its assistance to countries with higher levels of development. So far, a gradual shift in individual partner countries has not been accompanied by a strategy for global development and a coherent strategy on how to work with more advanced countries to this end. Moreover, discussions thus far have not included a clear strategy on how to shape a gradual transition from a focus on poverty to areas of mutual interest or how to potentially combine both strategic objectives.
Approaches to tackling both challenges – concentrating EU aid funds where there are likely to have the greatest impact on poverty reduction, and reconceptualising development cooperation with emerging economies and countries with higher levels of development – need to be based on a thorough understanding of the key changes in the development landscape.
3 The changing development landscape
One could rightly argue that there has been nothing more constant than change in the international development landscape. The fundamental nature of the current transformation, however, indicates that the developments over the last decade or two have been of historical significance and have created an international environment that is significantly different from the post–Second World War or post–Cold War period.
3.1 The changing geography of growth
From a development perspective, the world had been viewed for a long time as a two- polar, binary order with a few rich countries surrounded by a majority of poor countries.17 The distribution of income was mainly divided according to these two poles: most of the world’s population lived either in rich or in poor countries, with few in between (Harris et al. 2009).18 This dividing line between high-income and low-income countries also mirrored the distribution of global poverty. According to estimates, in 1990, 93 per cent of
17 The most prominent theoretical foundation for dividing the world into a dichotomist structure are the dependency theories first developed in the late 1950s by Paul Prebisch (then Director of the UN Economic Commission for Latin America, CEPAL), and further developed by Andre Gudrun Frank (1966). Dependency theories were an attempt to explain the underdevelopment and persistent poverty of many nations as a direct consequence of the interactions and economic activities of developed countries.
18 This distinction into “developed” and “developing” does not neglect the tripartite division of the world into first, second and third world during the Cold War. The reference to a two-polar world-order relates in particular to the distribution of wealth and the distribution of global poverty without drawing on political criteria that have shaped the relations between countries at that time.
the global poor lived in LICs (Sumner 2010b). Poverty was thus predominantly a low- income-country problem – aid transfers from the world’s wealthiest countries to the world’s poorest ones were a key element of the development agenda. This, in turn, has characterised the relationship between countries and distinguished them as either “donors”
or “recipients”, while the approaches and actions of the development business became
“aid-centric” (Harris et al. 2009, 7).
However, the perception that the world can, from a development perspective, be explained by a dichotomous distinction into “developed” and “developing”, “donor” and “recipient”,
“North” and “South” is today even more debatable than it was in the mid 1990s. With the exception of the rise of the Asian Tigers, the 1980s represented a “lost decade” triggered by financial crises and instability for mainly two regions: Latin America and sub-Saharan Africa. However, starting in the 1990s and accelerating in the 2000s, much of the developing world has seen strong economic growth, resulting in tremendous changes in the geography of growth and wealth distribution (Rodrik 2011; Spence 2011). For the first time in the post–Second World War period, growth in developing countries has outpaced that of industrialised countries; by 2010 developing countries (including former socialist countries) accounted for half of the world economy (Rodrik 2011). The 2010 OECD report interprets these dynamics as “shifting wealth” (OECD 2010) and points out that the world’s economic centre of power has gradually shifted away from the OECD and towards the emerging economies. According to the report, the number of converging countries – countries with double the average per capita growth than the high-income OECD countries – more than quintupled, while the number of poor countries more than halved.19
While this does not mean that the gap between developing countries and industrialised countries has closed or that growth was equally distributed among developing countries, it shows a clear trend towards convergence: “[T]he huge asymmetries between advanced and developing countries have not disappeared, but they are declining, and the pattern for the first time in 250 years is convergence rather than divergence” (Spence 2011, 4). This is also confirmed by the OECD report. Acknowledging that economic growth occurred in varying degrees and with widely disparate outcomes, the report clearly states that “[t]his re-alignment of the world economy is not a transitory phenomenon, but represents a structural change of historical significance” (OECD 2010, 2).
Will this trend towards convergence continue? The OECD report is positive and estimates that the situation in 1990 – when OECD countries had a 62 per cent share of the world economy – is likely to be reversed by 2030, with developing countries’ share projected to rise to 57 per cent (see Figure 2).
19 This analysis of the OECD is based on a classification that categorises the world economy into four speeds and into four groups of countries accordingly: (i) “affluent”: high-income countries according to the World Bank’s grouping; (ii) “converging”: countries with double the GDP per capita growth of high-income OECD countries; (iii) “struggling”: middle-income countries whose GDP per capita growth is less than double than that of high-income OECD countries; (iv) “poor”: low-income countries whose GDP per capita growth is less than double than that of high-income OECD countries (OECD 2010, 33).
Figure 2: Share of the global economy 1990–2030
Note: These data apply Maddison’s long-term growth projections to his historical PPP-based estimates for 29 OECD member countries and 129 non-member economies. Dotted lines indicate projections.
Source: OECD (2010)
Others are more cautious. They point towards previous experiences with fast economic growth that – in most developing countries – has hardly ever been sustained. Rodrik (2011), for example, expects that many countries are unlikely to sustain current growth rates and that rapid convergence is possible in theory but unlikely to happen in practice.
The main reasons he identifies are the failure to promote economic diversification and to initiate structural change from low-productivity sectors (e.g. agriculture and other informal sectors) to higher-productivity sectors. In the same vein, Page (2009) refers to the expected unsustainability of current growth rates. He argues that recent growth, especially in Africa, has largely been driven by commodity booms and better macroeconomic policies; it has hardly been accompanied by increased productivity, export diversification or investment.
But even if large income disparities prevail, it is important to acknowledge that the dividing line between the “developed” and the “developing” world has become increasingly blurred and that the current development landscape is considerably different from the landscape of just one or two decades ago. Not only has the group of countries with higher per capita income averages increased steadily since the 2000s (see Section 3.2), the characteristic differences attributed to the former demarcation line between developed and developing countries have also become increasingly redundant. This relates as much to the “internal attributes of nations (political and economic systems, rates of economic growth)” as to their “external relationships” (Harris et al. 2009). In fact, many countries are now considered “intermediate” – in between the old categories of
“developed” and “developing”. A particular set of countries within this group combine characteristics formerly attributed to either developing or developed countries. Despite having large numbers of poor people, these countries have experienced fast economic growth and gained significant geopolitical influence. Harris et al. (2009) describe this as a mismatch of relational and income characteristics. Schmitz and Messner (2008) refer to
these countries (mainly China and India) as “poor but powerful” and argue that these are increasingly distinct from other low- and middle-income countries as well as OECD countries.
Another key element of changing growth patterns is the fact that South-South economic, trade and aid flows have gained significant importance vis-à-vis North-South flows.
South-South foreign direct investment (FDI) flows (largely from Brazil, China, India, South Africa and the East Asian Tigers) have risen faster than North-South flows (OECD 2010). Aid flows from non-DAC members rose by 63 per cent between 2006 and 2008, reaching a 10 per cent share of global aid flows in 200820 (ECOSOC 2008). Many countries that were formerly considered “aid recipients” have thus become important
“donors” themselves and are currently both recipients and providers of aid (Grimm et al.
2009). These changing patterns of financial flows have important repercussions for the current aid system, making new financial opportunities available for developing countries, creating new actors on the scene and providing an increasingly diverse marketplace of ideas and approaches.
Even more important for the analysis in this paper is the fact that “shifting wealth” and the growing economic weight of anchor and emerging countries has led to geopolitical ramifications and an increasingly multi-polar world order with new demands for global decision-making. In this increasingly globalised, interconnected and multi-polar world, global challenges such as climate change and reducing CO2 emissions; security and stability; migration; financial stability; and communicable diseases cannot be addressed without the involvement of emerging and developing countries (Zoellick 2010). As the (re-) emergence of the G20 suggests, this is not only about China and India, but increasingly about countries such as Brazil, Mexico, Indonesia, Turkey, Argentina, Russia and South Africa. The evolving international roles of these dynamic players are particularly important in the areas of global governance reform and for the provision of global public goods (GPGs). In fact, these power shifts provide an “important impetus for a new understanding of development policy as global public policy,” which would shift
“development interests beyond ODA and the alleviation of absolute poverty to include other instruments such as trade, technology and investment transfer, protection and valorisation of national resources in a more coherent manner” (Gleichmann / Kloke-Lesch 2010, 13) (see Section 4.2).
The challenge many donors – and in particular the EU – are now facing is to adapt their development policies to a development landscape that has become much more differentiated, heterogeneous and complex. On the one hand, many countries have seen rapid economic growth, gained significant political and regional influence and are now indispensable for global and regional problem-solving. Economically and politically, they are increasingly meeting European countries on equal terms – or have at least recognised their common interests and mutual dependence. In times of scarce ODA resources, it is being questioned more often – and rightly so – whether or not it is appropriate and
20 Non-OECD donors do not provide “aid” in the classical sense as defined by OECD/DAC criteria. The UN Economic and Social Council’s calculations are therefore defined to the greatest extent possible on the same terms as OECD/DAC ODA.
legitimate to continue to provide EU aid to countries that appear wealthy enough to fund their own development.
Any rethink of this approach, however, has to consider more than just the dramatic shifts in the patterns of growth and geopolitical power shifts. Looking only at growth rates and increasing average income levels provides a rather incomplete picture of the changing development landscape. Most importantly, it overlooks social and human development and the extent to which countries have reduced poverty as they have climbed the ladder of economic development and gained influence on the global political stage. Any new strategy involving middle-income or emerging countries therefore needs to take account of another trend that has accompanied shifting patterns of wealth: the changing geography of poverty.
3.2 The changing geography of poverty
Since poverty has been considered predominantly a low-income-country problem for a long time, the decision for donors about where to prioritise assistance in order to reduce poverty was significantly less complex. Evidently, aid has always served other purposes besides poverty reduction; commercial, strategic and political reasons have been – and still are – just as decisive for aid allocations (Holden 2009; Barder 2009). But if donors prioritised poverty reduction – a paradigm that gained ground in the development community throughout the 1990s – a focus on poor countries was the logical consequence.
In 2007, Paul Collier’s widely read book The Bottom Billion re-emphasised this focus on prioritising aid for poor countries (Collier 2007). Collier acknowledged that the world can no longer be portrayed as “5 billion poor” and “1 billion rich”, so he divided the world roughly into 1-4-1: 1 billion people living in affluent, developed countries; 4 billion people living in countries experiencing rapid economic growth whose living standards are converging with those of the rich; and 1 billion poor people living in mostly fragile countries suffering from stagnating economic growth. Economic growth plays a key role in Collier’s concept and the lack thereof is considered a decisive factor for these countries to be stuck in poverty: “The problem of the bottom billion has not been that they had the wrong type of growth, it is that they have not had any growth” (ibid., 11).
As pointed out before, Collier’s viewpoint – to focus aid on low-income and mostly fragile countries and to phase it out for those countries in the “middle” – has been influential with a number of donors, most notably DFID,21 which has set funding priorities and programmes accordingly. It has also reinforced the view that aid spending in MICs is perceived as aid that is poorly targeted at poverty reduction.
However, the redistribution of global growth has had important repercussions on the global geography of poverty and challenges the view that poverty is predominantly a low- income-country problem. First of all, there is the success story. The share of the population living in extreme income-poverty (below US$ 1.25 a day) fell tremendously
21 According to a 2009 DFID White Paper, half of all new bilateral funding would be allocated to fragile states. This was reconfirmed during the bilateral aid review in 2011.
between 1981 and 2008 from 52 to 22 per cent. This progress, however, has been very uneven between regions. The sharp decline in global income poverty is mainly attributed to progress in China and East and South-East Asia, while sub-Saharan Africa has only seen a modest decline in income poverty (World Bank 2012).
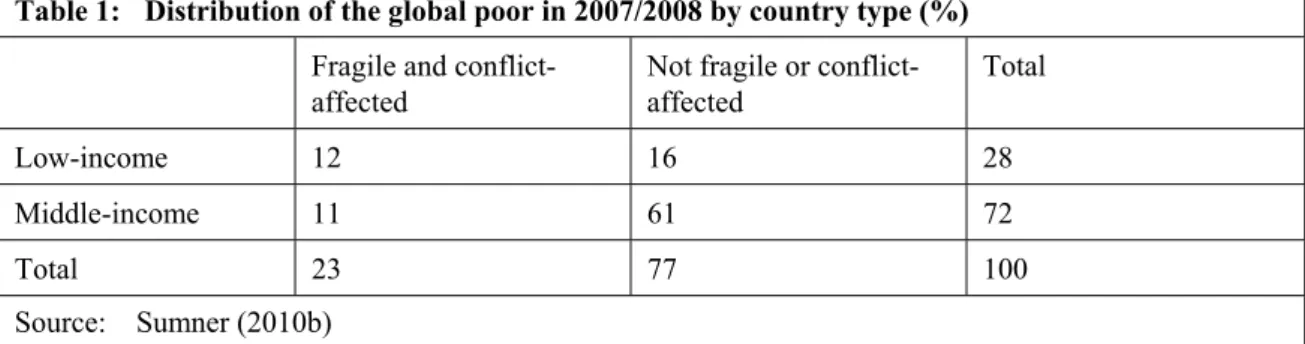
Moreover, not all countries that have seen fast economic growth rates over the last century have combated poverty with urgency. Many countries have become wealthier in per capita terms and crossed the middle-income threshold, while large parts of the population continue to live below the poverty line. This has now led to a situation in which the majority of extreme income-poor, or a “new bottom billion” (Sumner 2010b), live in MICs. Sumner estimates that 72 per cent of the world’s income-poor22 do not live in the poorest countries that Collier terms the “Bottom Billion” but in countries that have generated significant economic growth and crossed the MIC threshold. Of this 72 per cent, 61 per cent live in stable MICs and only 28 per cent of the world’s poor live in LICs, whereas fragile low-income countries account for only 12 per cent (see Table 1).
At the same time, this recent shift in the global geography of poverty has to be treated with some caution. A closer look at how this change came about reveals that it is closely related to the transition of five populous countries to MIC status: China (graduated in 1999), Indonesia (2003), India (2007), Nigeria (2008) and Pakistan (2008). If China and India are removed, the figure decreases from 72 per cent of poor people living in MICs to 22 per cent (while Nigeria, Pakistan and Indonesia account for much of the remaining 22 per cent). Yet, it is a significant increase compared to 1990, when only 9 per cent of the global poor lived in MICs (Sumner 2010b).
Sumner’s findings are nonetheless relevant, in particular since they point towards an important trend in the changing nature of poverty. One of the key differences between Collier’s and Sumner’s findings relates to the emphasis given to inequality and poverty and income disparities within countries. Collier calculated the billion poor people by counting the total population of his 58 Bottom Billion countries and not only the countries’ poor populations. Sumner, on the other hand, puts the emphasis on poor people in non-poor countries, and thus on distributional challenges within – rather than between – countries. So whereas the key challenge identified by Collier relates to how LICs can generate growth in order to reduce poverty, Sumner draws attention to the fact that many
22 The calculations of Sumner refer to absolute poverty and the US$ 1.25 poverty line using data from 2007/2008 World Development Indicators.
Table 1: Distribution of the global poor in 2007/2008 by country type (%) Fragile and conflict-
affected
Not fragile or conflict- affected
Total
Low-income 12 16 28
Middle-income 11 61 72
Total 23 77 100
Source: Sumner (2010b)
countries have taken off economically, while at the same time large proportions of their populations continue to live below the poverty line.
This shift has sparked a new discussion about where to focus development assistance in order to tackle global poverty. In particular, it has raised questions regarding the viability of the prevailing paradigm that aid has a strong poverty focus if it is spent exclusively in the poorest countries. The challenges of Collier’s Bottom Billion – mainly badly governed, fragile and conflict-affected poor countries – have been widely documented and researched (see e.g. Chauvet / Collier 2004; Chauvet et al. 2007; Collier 2009; Torres / Anderson 2004; Duffield 2005; Picciotto 2004), as these challenges have dominated the debate on poverty reduction for the last decade. This discourse obviously remains very important, as development progress proves particularly challenging in conflict-affected countries. According to the World Bank, no fragile country has yet achieved a single MDG (World Bank 2011b).
However, according to current figures, the challenges of the Bottom Billion countries apply to a decreasing number of developing countries and to a limited share of the world’s poor population. Sumner (2010b) estimates that the number of poor people living in fragile and conflict-affected countries accounts for around 300 million people, a 23 per cent share of the world’s poor population. Moreover, a number of countries that were considered “trapped and falling behind” at the beginning of the 2000s have generated significant economic growth in recent years. Of Collier’s 58 Bottom Billion countries, 11 were considered as “converging” by the 2011 OECD report, meaning that they are currently generating GDP per capita growth rates that are twice as high as those of high- income OECD countries. The shift in global poverty – namely the people who make up the 77 per cent share of the world’s poor population, who do not live in fragile or conflict- affected countries, and the 61 per cent of these who live in stable MICs – thus confronts development practitioners and researchers with new challenges and requires a fresh look on poverty and social inequality in economically thriving countries.
A key question in these discussions is therefore whether or not Sumner describes a situation that only results from the transition of five populous countries to MIC status. In other words, is the continuation of poverty and rising inequality in countries that have generated fast economic growth a trend that characterises a significant change in the poverty problem that is likely to continue in the mid-term, if not over the long-term?
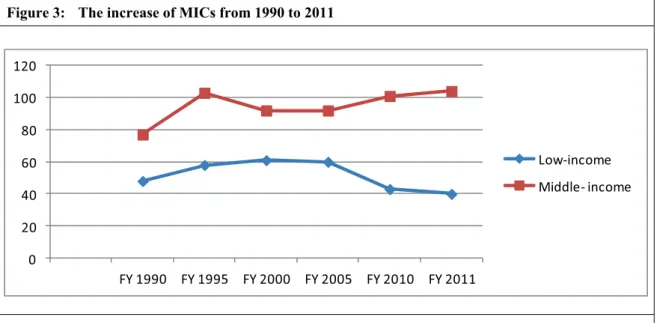
Any estimation of whether or not the majority of poor people will continue to live in MICs is complex.23 However, there are two important factors to consider. The first is to look at the extent to which we can expect the number of MICs to either rise or decrease over the next years. In 1988, there were only 77 MICs, whereas this number increased to 104 in 2009. On the contrary, while the number of LICs increased significantly during the 1990s
23 According to Kanbur / Sumner (2011) these factors include “growth projections for individual countries;
assumptions on exchange rate evolution; assumptions on international inflation and other aspects of the Atlas methodology for classifying countries as LICs or MICs; the evolution of income distribution within each country; any re-evaluation of PPPs in each country (and influence on $ 1.25 poverty) and population growth in individual countries” (ibid.).
0 20 40 60 80 100 120
FY1990 FY1995 FY2000 FY2005 FY2010 FY2011
Lowincome Middle income
– from 48 in 1988 to 63 in 2000 – the latest World Bank classification data indicate that this number fell to 35 in 2011.
Recent projections indicate that this trend is indeed likely to continue and that the number of LICs might continue to fall significantly. Calculating the World Bank’s International Development Association24 future client base, Moss and Leo (2011) estimate that the International Development Association will probably lose half of its client countries by 2025 because countries will become too wealthy to qualify. According to these estimates, only 31 countries will remain eligible for International Development Association assistance in 2025 and the total population covered by the lending facility will be reduced by two-thirds.
The second important factor is to look at the extent to which countries have reduced poverty as they have reached MIC status. In general, leaving distributional issues aside, countries should have made remarkable progress in reducing poverty by the time they reach MIC status. The average income threshold a country must exceed in order to be classified “middle income” by the World Bank roughly corresponds to US$ 2.70 per capita per day,25 which is above the two commonly used income poverty lines of US$ 1.25 and $ 2 (Kanbur / Sumner 2011). Overall, findings suggest that the incidence of extreme income poverty in MICs is generally lower than in LICs.26 Including other aspects of social and human development beyond income poverty, MICs, by and large, seem to be
24 According to Moss / Leo (2011), the International Development Association follows two objectives: (i) to provide finance to countries that cannot borrow because of low-income or lack of creditworthiness, and (ii) to help countries grow wealthier and improve their policies so that they can turn to commercial markets or the World Bank’s hard window for their capital needs (ibid., 2).
25 Using 2008 exchange rates.
26 According to Sumner (2011b), the average incidence of income poverty in low-income countries for 2002–2007 is almost twice as high (52.4 per cent) as in lower-middle-income countries (27.1 per cent) and 10 times higher than in upper-middle-income countries (5.2 per cent).
Figure 3: The increase of MICs from 1990 to 2011
Source: World Bank: http://data.worldbank.org/about/country-classifications/country-and-lending- groups#Low_income
better off than LICs (Sumner 2011b). This general positive correlation is also confirmed if multi-dimensional poverty is considered. According to Alkire (2010), there is an encouraging disconnect between higher average income levels per capita and the multi- dimensional poverty index (MPI).27
However, what those aggregate figures mask is the fact that there are tremendous differences across countries and that the group of MICs and the progress made is actually significantly more disparate than these overall findings indicate. The argument that all MICs achieve broader human development can easily be rejected by the fact that 12 LMICs are still considered least-developed countries.28 This incongruent development progress is also reflected in the varying poverty rates of MICs. As emphasised by a recent UN report, the incidence of poverty in MICs ranges from 2 per cent to more than 60 per cent of a country’s population (UNDP / UNFPA / UNOFS 2011, 3). Comparing the poverty reduction efforts of the 23 countries29 that have achieved MIC status since 2000, it becomes obvious that there are countries that have even seen rising poverty levels as their average GNIs per capita increased (Sumner 2011b). Some countries, e.g. Botswana, have seen substantial income increases but poverty reduction rates that are falling only slowly.
Others such as Ghana have translated comparatively modest economic growth into a significant decline in poverty (Fosu 2011). There are countries that continue to have higher levels of poverty than LICs, despite achieving MIC status. Zambia, for example, (which has only very recently been granted LMIC status) has a higher extreme poverty per capita ratio (64.3 per cent) than a poor LIC such as Mali (51.4 per cent).30 And there are extreme examples such as Equatorial Guinea, a high-income country where 76.8 per cent of the population continues to live below the national poverty line.31 Even India, which has had impressive annual GDP growth rates, has not matched its good economic performance with equally high rates of poverty reduction (Fosu 2011) and continues to account for more of the world’s extreme income-poor (450 million) than the entire African continent (377 million).32
The relationship between growth and poverty reduction is thus more complex. While there is an overall agreement that growth is a necessary precondition for poverty reduction (Lopez 2010), the assumption that the incomes of the poor increase one-for-one if a country generates economic growth (Dollar / Kraay 2002) is difficult to sustain against the backdrop of persistent poverty in MICs. In fact, there seems to be little correlation
27 The MPI is a new international measure that goes beyond measuring income poverty by taking into account the multi-dimensionality of poverty. It identifies overlapping deprivations that members of a household experience based on three dimensions: health, education and standard of living. A household is considered as multi-dimensionally poor if it is deprived of an equivalent of 30 per cent of the weighted indicators (Alkire / Santos 2010).
28 See: http://www.unctad.org/Templates/Page.asp?intItemID=3641&lang=1.
29 Angola (2006), Armenia (2004), Azerbaijan (2005), Bhutan (2008), Cameroon (2007), Congo (2007), Cote d’Ivoire (2010), Georgia (2005), India (2009), Indonesia (2005), Lesotho (2007), Moldova (2007), Mongolia (2009), Nicaragua (2007), Nigeria (2010), Pakistan (2010), Sao Tome and Principe (2010), Senegal (2011), Sudan (2009), Ukraine (2004), Uzbekistan (2011), Vietnam (2011), Yemen (2011).
30 Data processed from the Demographic Health Survey 2007.
31 According to World Bank data from 2006.
32 According to the Demographic Health Survey 2005.
between a country’s progress towards reducing poverty and its economic growth (Lopez / Page 2003; Fosu 2009, 2011).33 While the OECD report highlights the general positive correlation of growth and poverty reduction,34 it explicitly states that there are tremendous differences across countries, and that countries with rapidly growing economies were not necessarily the ones to achieve the greatest poverty reductions.35 Some countries have translated relatively strong economic growth into a significant decline in poverty, while others have generated more GDP growth but only achieved modest poverty reduction rates (Fosu 2011). The same can be said for the link between growth performance and wider social and human development. Bourguignon et al. (2008), for example, found that “the correlation between GDP per capita growth and non-income MDGs is practically zero,”
which led them to conclude that “these results do not invalidate the argument that growth is necessary to achieve the MDGs, for instance by generating needed budget resources, they suggest that growth alone is not enough” (ibid., 9).
Rising inequality and distributional challenges are therefore crucial in explaining the diverse outcomes related to poverty reduction. In a broad range of countries, economic growth has been accompanied by increasing inequality (OECD 2010; Lopez / Page 2003;
Saith 2006). According to the OECD report, since 1990 the decrease in income inequalities between countries – due to the strong growth performance of many developing countries – has occurred at the same time that income inequalities within many countries have been steadily increasing. The Gini coefficient – the most commonly used index to measure inequality – has risen in most developing countries across all world regions except Latin America. In particular in Asia, Gini coefficients have been rising significantly during the last 20 years (e.g. by 10 percentage points in China).
This does not invalidate Collier’s viewpoint that poor countries need sustained growth in order to reduce poverty. However, it reaffirms Sumner’s assumption that distributional issues are as significant in characterising the poverty problem as the total lack of resources. National progress and national aggregates such as average income per capita can be misleading as entire regions and social groups have been de-linked from the positive developments in the same country.
This is also the case if multi-dimensional poverty is considered. Assessing an MPI sample of 28 countries, Rippin36 identifies tremendous differences across regions within the same country. The Callao region in Peru, for instance, ranks third with an MPI of close to zero, while the Huancavelica and Huánuco regions rank 230 and 232, respectively, with an MPI
33 Looking in particular into the long-term relationship between economic growth and poverty reduction, Lopez / Page (2003) found that the impact of economic growth on poverty outcomes differs significantly across countries and regions. Of a sample of 54 countries, the poor failed to achieve income growth in 21 countries, and in a number of countries, long-term growth even led to increases in poverty.
34 According to the report, a 1 per cent rise in real per capita GDP is, on average, equivalent to a 1.1 per cent reduction in the absolute poverty rate (OECD 2010).
35 Taking a set of 24 countries, out of which 16 are converging countries, the report found that, by and large, the growth elasticity of poverty reduction in converging countries is rather modest compared to countries with less economic growth (OECD 2010).
36 Data not yet published by Nicole Rippin (mimeo).
of more than 0.23. LICs are no exception to unequal distribution of wealth within the same country. Nairobi in Kenya, for example, has one of the lowest MPIs (0.04), while the north-eastern region accounts for one of the highest MPIs (0.68) of the sample. India, known for its regional poverty disparities, has regions where multi-dimensional poverty is relatively low (Kerala (0.05) and Delhi (0.06)), while other regions such as Jharkhand (0.44) and Bihar (0.48) are in the bottom quintile of the sample. This challenge of widening gaps in income and social development distribution within countries is also acknowledged by Vandemoortele (2011), one of the main architects of the MDGs, who emphasises that “the world is off-track, not because of insufficient economic growth but mostly because people in the bottom quintiles have benefited disproportionately little from national progress. As long as the world continues to turn a blind eye to the growing inequities within countries, the MDGs will be mission impossible” (Vandemoortele 2011, 1).
What these findings clearly show is that poverty can no longer be seen as a problem only of LICs and that economic growth, even though important, is not a sufficient condition for countries to reduce poverty. It is therefore important to acknowledge that countries have made very uneven progress in reducing poverty as they climbed the ladder of economic development. The increase in average per capita income and the transition to middle- income status can therefore not be considered as end points to development or equated with reduced levels of poverty or higher human development.
This, of course, raises the question whether or not the EU has the right strategies to respond to this changing development landscape. The concomitance of the resulting challenges – the changing geography of growth, geopolitical ramifications and the increasingly global nature of development challenges on the one hand, and the changing nature of poverty and increasing inequities within countries on the other – further complicates the question of how to undertake development cooperation in an ever more heterogeneous and differentiated development landscape.
4 Two evolving challenges
Both shifting wealth and changing patterns of poverty have given new momentum to the debate on aid to MICs and emerging economies. The growing number of MICs; the fact that the majority of poor people currently live in MICs; geopolitical power shifts and the re-emergence of the G20; the succession of global crises; and the growing consciousness about the need to find joint solutions to global challenges have sparked new debates among scholars (Sumner 2010a, 2011a; Kanbur / Sumner 2011; Glennie 2011; van Lieshout et al. 2010) and donors (DGM 2011; DFID 2011; BMZ 2011).
On the one hand, the changing geography of poverty has provoked a new discussion on the rationale of aid in tackling national development challenges and supporting poverty reduction efforts in countries that have surpassed a certain income threshold. On the other, the trend and need to expand the objectives of development policy beyond poverty reduction and the classical “aid relationship” has increased markedly due to the frequency