Postprint
Digitization in Outbound Logistics – Application of an Industry 4.0 Maturity Model for the Delivery Process
Felch, Vanessa; Asdecker, Björn; Sucky, Eric
Institutionelles Repositorium der Universität Bamberg OPUS, 2018
Quelle: Felch, Vanessa; Asdecker, Björn; Sucky, Eric (2018): Digitization in Outbound Logistics – Application of an Industry 4.0 Maturity Model for the Delivery Process, in: Stentoft, Jan (Ed.) (2018): Proceedings of the 30th Annual NOFOMA Conference: Relevant Logistics and Supply Chain Management Research. Kolding: Syddansk Universitet, S. 113–128.
https://doi.org/10.20378/irbo-54684
DIGITIZATION IN OUTBOUND LOGISTICS –
APPLICATION OF AN INDUSTRY 4.0 MATURITY MODEL FOR THE DELIVERY PROCESS
Vanessa Felch, Dr. Björn Asdecker and Prof. Dr. Eric Sucky
University of Bamberg, Feldkirchenstr. 21, 96050 Bamberg, Germany
ABSTRACT Purpose
Available maturity models in the context of Industry 4.0 primarily focus on manufacturing processes. A research gap exists with regard to outbound logistics. This paper applies a maturity model that has been designed to support the digitization of the outbound logistics processes. The validation of the model in business practice completes the model’s development.
Design/methodology/approach
This work embraces a qualitative research design approach. In this context, it conducts a single case study. The case refers to a large multinational manufacturer of industrial electric equipment, which considers itself as one the most digitized companies in the industry.
Findings
The model appears to be applicable (1) to describe the status quo of the enterprise’s digitization capabilities in outbound logistics, (2) to develop a corporate vision for delivery logistics excellence, (3) to provide guidance on the development path, and (4) to compare capabilities between different company sites.
Research limitations/implications
The model has solely been applied to two sites of one company. However, it seems applicable to other organizations as well. Nonetheless, additional case studies are necessary to verify the model’s generalizability.
Practical implications
The case study provides an example of how to develop a roadmap towards delivery process excellence in the digital age ahead.
Original/value
The applied maturity model complements approaches that focus on digitization of the manufacturing processes as well as logistics maturity models. The case study is of value for organizations that intend to build Industry 4.0 capabilities in outbound logistics, which has played a minor role so far.
Keywords: Industry 4.0, digitization, maturity model, outbound logistics, delivery process
1. INTRODUCTION
Digitization affects all parts of the business world and disruptively changes the process of value creation (Kagermann et al., 2013). At the heart of this development is the interconnection of the real and the virtual world through innovations in the information and telecommunications technology. In business practice, digitization is particularly advanced in the production process.
Most notably Cyber-Physical Systems (CPS) and the Internet of Things (IoT) are shaping a fourth industrial revolution to which various authors refer to as “Industry 4.0” (e.g., Almada- Lobo, 2015; Gökalp et al., 2017; Hermann et al., 2016). However, digitization is by no means limited to manufacturing but will inevitably expand to other processes. If the vision of Industry 4.0 is to be realized, the entire supply chain has to evolve towards a connected and smart ecosystem (Pan et al., 2017). Herein, the logistics processes play an integral role as connecting elements (Pujo and Ounnar, 2018; Strandhagen et al., 2017; Glistau and Coello Machado, 2018;
Nicoletti, 2018).
On their way towards supply chain ecosystems companies require tools that help identifying transformation gaps. Herein, maturity models can be of great support. Over the past years, various CPS, IoT, and Industry 4.0 maturity models have been developed and presented in literature (e.g., Leyh et al., 2016; Katsma et al., 2011). However, there is a research gap with regards to maturity models in logistics (Gilchrist, 2016), particularly if they are to take the current digitization trends into account. This is of particular interest as McCormack et al. (2008) found that the delivery process’s maturity has a higher impact on business performance than other supply chain processes. This prevalent research gap motivated the development of the Delivery Process Maturity Model (DPMM) 4.0. As an integral part of the development process, which was guided by de Bruin et al. (2005), it is necessary to validate the model in business practice. This final development step is achieved with this work. Herein, we conduct a case study, which is by far the most common method to validate maturity models and is “[…] able to deliver useful results” (Wendler, 2012, p. 1332).
This study contributes to the available literature by incorporating digitization efforts into maturity models for logistics. Besides, it complements the existing CPS, IoT, and Industry 4.0 maturity models and thus represents a further step towards a fully digitized supply chain. It also contributes to case study research in general by providing insights into the current outbound logistics digitization efforts at one of the world’s leading electric equipment manufacturers.
The remainder of this paper is structured as follows: The second chapter provides the theoretical background with a focus on Industry 4.0 and logistics. The third chapter briefly introduces to the DPMM 4.0. Thereafter, the case study as the chosen method to validate the maturity model is introduced. Chapter 5 outlines the results of the DPMM 4.0 application. The paper summarizes the findings, points out theoretical and managerial implications, and proposes future research opportunities.
2. THEORETICAL BACKGROUND The concept of Industry 4.0
The term “Industry 4.0” has been created by the German Federal Ministry of Education and Research and indicates a new era of industrialization (Oesterreich and Teuteberg, 2016).
Thereby, Industry 4.0 is enabled by CPS and IoT technologies, which are integrated in industrial processes (Gökalp et al., 2017). Apart from these two, other essential Industry 4.0 technologies are cloud computing, big data, augmented reality, machine learning, cyber security, autonomous robots and simulation (Gökalp et al., 2017; Gilchrist, 2016). Through the interplay of these technologies the automation and digitization of the manufacturing processes are
increased and “[…] a highly flexible production model of personalized and digital products and services, with real-time interactions between people, products and devices during the production process” (Zhou et al., 2015, S. 2147) is facilitated. Overall, Industry 4.0 depicts a new concept to reach higher information transparency and flexibility with a “[…] significant impact on supply chains, business models and processes […]” (Gökalp et al., 2017, S. 129).
Logistics in the context of Industry 4.0
Logistics comprises the “[…] process of strategically managing the procurement, movement and storage of materials, parts and finished inventory (and the related information flows) through the organization and its marketing channels in such a way that current and future profitability are maximized through the cost-effective fulfilment of orders.” (Christopher, 2016, p. 2). Ernst and Kamrad (2000) distinguish between inbound and outbound logistics (Ernst and Kamrad, 2000). The former concentrates on the material flow that supplies the production processes, while the latter focuses on the delivery to the customer (Ernst and Kamrad, 2000).
McCormack et al. (2008) emphasize that the delivery process’s maturity has a higher impact on business performance than other supply chain processes.
Digitization also affects logistics (Strandhagen et al., 2017; Glistau and Coello Machado, 2018;
Nicoletti, 2018). It has the potential to significantly improve efficiency when matching demand and supply through the seamless integration of several logistics actors. Some authors refer to this as cyber-physical logistic systems (e.g., Pujo and Ounnar, 2018), which pursue the goal of increasing process intelligence, connectedness and responsiveness. This pursued state of excellence requires embedded, linked, autonomously acting IT-systems to achieve end-to-end supply chain transparency and self-regulation (Hofmann and Rüsch, 2017; Göçmen and Erol, 2018; Pujo and Ounnar, 2018).
3. THE DELIVERY PROCESS MATURITY MODEL (DPMM) 4.0
To develop into the next generation of logistics systems, decision-makers require tools that support the realignment, reconfiguration, and renewal of existing capabilities. In general, maturity models contribute to these purposes. While several available models cover digitization on the strategic level (Klötzer and Pflaum, 2017), others refer to CPS and IoT in manufacturing (e.g., Ganzarain and Errasti, 2016; De Carolis et al., 2017) and IT capabilities (e.g., Leyh et al., 2016; Weber et al., 2017). The existing logistics maturity models have not taken into account current digitization trends (e.g., Van Landeghem and Persoons, 2001; Battista et al., 2012).
Motivated by this research gap the authors developed a model with a focus on outbound logistics: the Delivery Process Maturity Model (DPMM) 4.0. The development process was methodologically guided by de Bruin et al. (2005). While the first four stages (scope, design, populate, and test) are extensively documented in a separate essay (Asdecker and Felch, 2018), this paper is supposed to verify the model in business practice, which is the final development step (populate). Therefore, the model will only be briefly introduced before being applied in a case study.
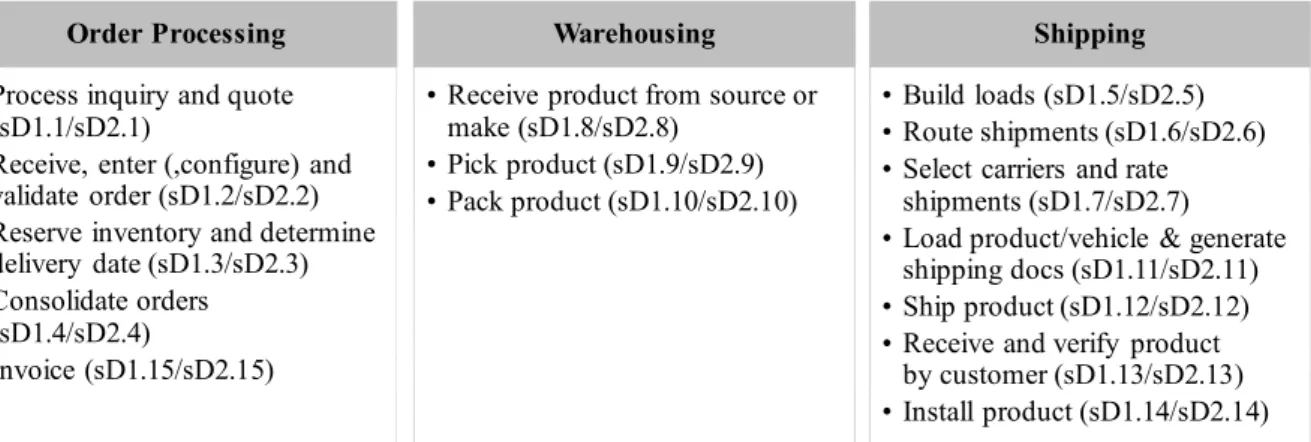
The peculiarity of the DPMM 4.0 is its flexibility of the modelling architecture. Unlike other models, it can be adapted to the specific needs of a supply chain, which is derived from its reference to the Supply Chain Operations Reference (SCOR) framework (SCOR, 2017). The structure of SCOR follows a modular principle. It contains six top-level process types that can be further subdivided into more detailed process categories and process elements (SCOR, 2017). The DPMM 4.0 adopts the delivery process elements and distinguishes between three activity dimensions: order processing, warehousing, and shipping (Figure 3.1).
Figure 3.1 Overview of the three dimensions and their respective elements
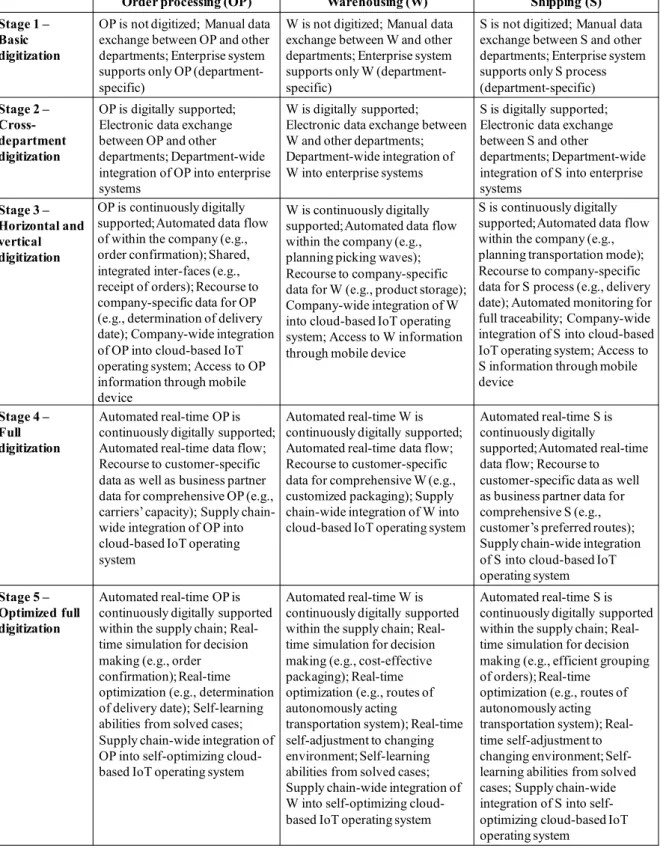
For each of the three dimensions a vision for the highest maturity stage is derived, which is based on available literature and own empirical work. The content of the lower levels has been derived according to these three principles: the lower the maturity stage, (1) the more human interventions are necessary, (2) the lower is the inter- and intra-organizational integration, and (3) the less automatized are data and information flows. Thereafter, the populated model’s comprehensibility, comprehensiveness, relevance, consistency, systematic structure, detailedness, conceptual reliability, and applicability were empirically tested with satisfactory results. Figure 3.2 summarizes the final DPMM 4.0.
During a maturity assessment, participants are presented specific statements for their relevant process elements that have to be rated on a four-tiered Likert scale (0=”not implemented”;
1=”partly implemented”; 2=”for the most part implemented”; 3=”fully implemented”). To provide a deeper insight into the assessment Table 3.1 provides exemplary assessment statements of one of the most fundamental activities in outbound logistics: the picking process (sD1.9/sD2.9 Pick product).
Table 3.1 Exemplary assessment statements to measure the process element sD1.9/sD2.9 Statement ID Statements
sD1.9/sD2.9-01 Automated real-time retrieve of the required order and determination of inventory availability
sD1.9/sD2.9-02 Automated real-time planning of picking waves in cloud-based IoT operating system
sD1.9/sD2.9-03 Use of carrier information (e.g., carrier’s expected arrival time) for automated scheduling of picking waves
sD1.9/sD2.9-04 Automated real-time rescheduling of picking waves in case of delay (e.g., delay of production or carrier)
Order Processing
• Process inquiry and quote (sD1.1/sD2.1)
• Receive, enter (,configure) and validate order (sD1.2/sD2.2)
• Reserve inventory and determine delivery date (sD1.3/sD2.3)
• Consolidate orders (sD1.4/sD2.4)
• Invoice (sD1.15/sD2.15)
Warehousing
• Receive product from source or make (sD1.8/sD2.8)
• Pick product (sD1.9/sD2.9)
• Pack product (sD1.10/sD2.10)
Shipping
• Build loads (sD1.5/sD2.5)
• Route shipments (sD1.6/sD2.6)
• Select carriers and rate shipments (sD1.7/sD2.7)
• Load product/vehicle & generate shipping docs (sD1.11/sD2.11)
• Ship product (sD1.12/sD2.12)
• Receive and verify product by customer (sD1.13/sD2.13)
• Install product (sD1.14/sD2.14)
Figure 3.2 Overview of the final model
The assessments are transferred into maturity scores based on the following procedure. First, the relevant SCOR process elements in the dimensions i
1,2,3
are assigned the consecutive index j i 1,..., ( )J i . Second, the provided kj i
1,...,K j i
assessment statements are evaluated on the previously mentioned four-tiered Likert scale. Third, the assessmentsOrder processing (OP) Warehousing (W) Shipping (S)
Stage 1 – Basic digitization
OP is not digitized; Manual data exchange between OP and other departments; Enterprise system supports only OP (department- specific)
W is not digitized; Manual data exchange between W and other departments; Enterprise system supports only W (department- specific)
S is not digitized; Manual data exchange between S and other departments; Enterprise system supports only S process (department-specific) Stage 2 –
Cross- department digitization
OP is digitally supported;
Electronic data exchange between OP and other departments; Department-wide integration of OP into enterprise systems
W is digitally supported;
Electronic data exchange between W and other departments;
Department-wide integration of W into enterprise systems
S is digitally supported;
Electronic data exchange between S and other
departments; Department-wide integration of S into enterprise systems
Stage 3 – Horizontal and vertical digitization
OP is continuously digitally supported; Automated data flow of within the company (e.g., order confirmation); Shared, integrated inter-faces (e.g., receipt of orders); Recourse to company-specific data for OP (e.g., determination of delivery date); Company-wide integration of OP into cloud-based IoT operating system; Access to OP information through mobile device
W is continuously digitally supported; Automated data flow within the company (e.g., planning picking waves);
Recourse to company-specific data for W (e.g., product storage);
Company-wide integration of W into cloud-based IoT operating system; Access to W information through mobile device
S is continuously digitally supported; Automated data flow within the company (e.g., planning transportation mode);
Recourse to company-specific data for S process (e.g., delivery date); Automated monitoring for full traceability; Company-wide integration of S into cloud-based IoT operating system; Access to S information through mobile device
Stage 4 – Full digitization
Automated real-time OP is continuously digitally supported;
Automated real-time data flow;
Recourse to customer-specific data as well as business partner data for comprehensive OP (e.g., carriers’ capacity); Supply chain- wide integration of OP into cloud-based IoT operating system
Automated real-time W is continuously digitally supported;
Automated real-time data flow;
Recourse to customer-specific data for comprehensive W (e.g., customized packaging); Supply chain-wide integration of W into cloud-based IoT operating system
Automated real-time S is continuously digitally
supported; Automated real-time data flow; Recourse to customer-specific data as well as business partner data for comprehensive S (e.g., customer’s preferred routes);
Supply chain-wide integration of S into cloud-based IoT operating system Stage 5 –
Optimized full digitization
Automated real-time OP is continuously digitally supported within the supply chain; Real- time simulation for decision making (e.g., order confirmation); Real-time optimization (e.g., determination of delivery date); Self-learning abilities from solved cases;
Supply chain-wide integration of OP into self-optimizing cloud- based IoT operating system
Automated real-time W is continuously digitally supported within the supply chain; Real- time simulation for decision making (e.g., cost-effective packaging); Real-time optimization (e.g., routes of autonomously acting
transportation system); Real-time self-adjustment to changing environment; Self-learning abilities from solved cases;
Supply chain-wide integration of W into self-optimizing cloud- based IoT operating system
Automated real-time S is continuously digitally supported within the supply chain; Real- time simulation for decision making (e.g., efficient grouping of orders); Real-time
optimization (e.g., routes of autonomously acting transportation system); Real- time self-adjustment to changing environment; Self- learning abilities from solved cases; Supply chain-wide integration of S into self- optimizing cloud-based IoT operating system
, ,
i j i k j i
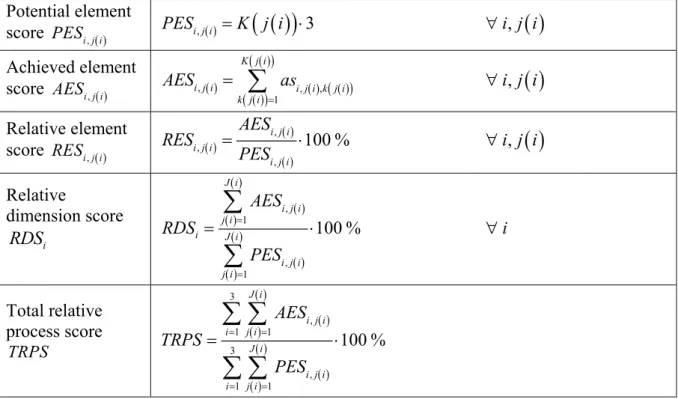
as are converted into percentage scores for each model element, dimension, and the entire process. Table 3.2 provides the calculation formulas.
Table 3.2 Maturity stage calculation Potential element
score PESi j i, PESi j i, K j i
3 i j i,
Achieved elementscore AESi j i,
, , ,
1
,
K j i
i j i i j i k j i
k j i
AES as i j i
Relative element
score RESi j i,
, ,
,
100 % ,
i j i i j i
i j i
RES AES i j i
PES
Relative
dimension score RDSi
1 ,
1 ,
100 %
J i
i j i j i
i J i
i j i j i
AES
RDS i
PES
Total relative process score TRPS
3
1 1 ,
3
,
1 1
100 %
J i
i j i i j i
J i
i j i i j i
AES TRPS
PES
Fourth, the scores are converted into a maturity stage. With the five stages describing a path towards excellence, the scale is evenly distributed. The first stage corresponds to a score between 0 and 20 %, the second stage to a score between 20 and 40 %, the third stage to a score between 40 and 60 %, the fourth stage to a score between 60 and 80 %, and the fifth stage to a score between 80 and 100 %. The following case study will further illustrate the model’s applicability.
4. MODEL EVALUATION METHODOLOGY
Helgesson et al. (2012) suggest three maturity model evaluation types. Type 1 (evaluation by the authors) and type 2 (evaluation by practitioners) were already conducted during the development of the DPMM 4.0. So far, the application in business practice, which represents type 3 in the evaluation process, is still missing (Helgesson et al., 2012). The main purpose is both to improve and to demonstrate the applicability of the model. For this step, Helgesson et al. (2012, p. 437) recommend “[…] analyzing the effect on one organization in a case study”.
While other method approaches are possible, case studies are most frequently used (Wendler, 2012).
Yin (2009, p. 18) defines a case study as an “[…] empirical inquiry that investigates a contemporary phenomenon in depth and within its real-life context, especially when the boundaries between phenomenon and context are not clearly evident”. Case studies differ from other research methods in their (1) particularity, (2) complexity and (3) real-time circumstances (Yin, 2009; Stake, 2005).
Before conducting a case study, a research question must be formulated, which reads in this paper: How can the DPMM 4.0 be used in business practice and identify potentials for improving the degree of digitization in outbound logistics? This question determines the design of the case study with regards to the following four factors: (1) subject, (2) purpose, (3) approach, and (4) process (Thomas, 2011). Table 4.1 shows the classification of our case study according to these factors. For our purpose, we use it as a supportive tool for testing the applicability of the DPMM 4.0.
Table 4.1: Case study design
(1) Subject Key case
(2) Purpose Instrumental
(3) Approach Testing a theory / maturity model (DPMM 4.0) (4) Process Single case study with two embedded units
In the following, the company, the objects of investigation, and the respondents were identified.
The company was selected for two reasons: (1) the company’s corporate strategy and (2) already implemented Industry 4.0 projects as an indicator of digitization experience. The participating company is a leading multinational manufacturer of electric equipment with more than 300.000 employees. Multiple Industry 4.0 initiatives have been successfully implemented and documented on the “Plattform Industrie 4.0” website (https://www.plattform-i40.de/). The company considers itself as one of the most digitized organizations in the industry. Therefore, we are confident that there is sufficient Industry 4.0 knowledge to contribute to this case study.
As part of the corporate strategy the company is continuously looking for opportunities to take advantage of the possibilities of digitization. Therefore, it sought to apply the DPMM 4.0.
The authors decided to evaluate two heterogeneous delivery processes of the multinational manufacturer, which can be interpreted as two subcases. Both factories produce the majority of their products on the basis of a make-to-order production strategy. Factory A is located in Germany with approximately 2,000 employees. The factory generates annual sales between 500 million and one billion euros. Factory B is situated in the United States, employs about 500 people, and generates annual sales between 100 and 250 million euros.
Respondents, as the main source of information, were expected to have sufficient knowledge of both Industry 4.0 and the delivery process. It proved difficult to meet this requirement, but in the end an employee was found who was well enough qualified to carry out the assessment.
The participating manager has been dealing with the Industry 4.0 concept for around two years and was able provide in-depth information on the delivery processes in both plants.
In February 2018, the corresponding author visited the manager in the German plant. To reduce subjectivity and in an attempt to triangulate the data, the outbound logistical processes were jointly inspected before the actual assessment. During the plant tour, the modular structure of DPMM 4.0 was introduced, which proved to be straightforward, as the manager was already aware of and familiar with the SCOR framework. The participating manager named twelve relevant process elements that were consistent with the insights gained during the factory tour:
sD2.1, sD2.2, sD2.3, sD2.5, sD2.6, sD2.7, sD2.8, sD2.9, sD2.10, sD2.11, sD2.12, and sD2.15.
Factory B was not visited, but due to the plausible and verifiable assessment of plant A, we are confident that the information provided also reflects reality. According to the manager,
loads (sD2.5), route shipments (sD2.6), select carriers (sD2.7), and ship the product (sD2.12).
Moreover, packing (sD2.10) has been outsourced to a third party service provider. Overall, sD2.1, sD2.2, sD2.3, sD2.8, sD2.9, sD2.11, and sD2.15 were considered relevant.
The manager then carried out the assessment for both factories. He went through the statements of each relevant element and evaluated them using the predefined Likert scale. During the assessment, he explained why he chose an answer option. Finally, we asked the respondent about the suitability of the model and possible implementation barriers. The results of the maturity model’s assessment are presented in the next paragraph.
5. RESULTS OF THE DPMM 4.0 APPLICATION WITH A MULTINATIONAL MANUFACTURER
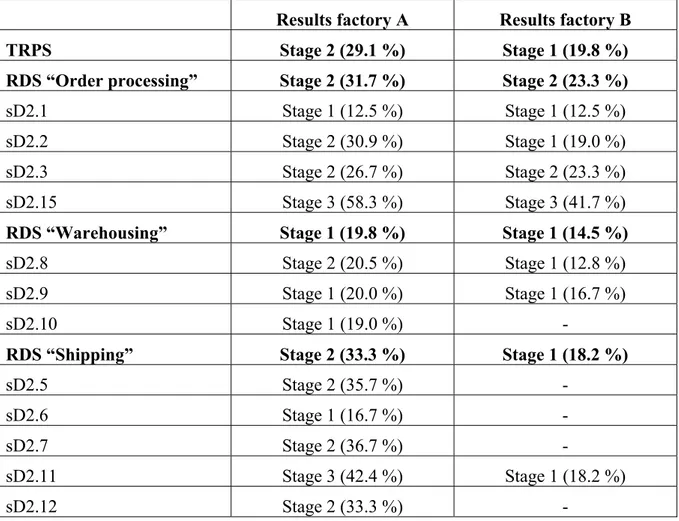
Upon completion of the questionnaire, the maturity scores and stages were determined according to the formulas described in chapter 3. The results were then evaluated and interpreted by the authors. Table 5.1 summarizes the individual maturity scores for both factories neglecting the one that do not take place in the factories.
Table 5.1 Assessment results for both factories regarding their delivery processes Results factory A Results factory B
TRPS Stage 2 (29.1 %) Stage 1 (19.8 %)
RDS “Order processing” Stage 2 (31.7 %) Stage 2 (23.3 %)
sD2.1 Stage 1 (12.5 %) Stage 1 (12.5 %)
sD2.2 Stage 2 (30.9 %) Stage 1 (19.0 %)
sD2.3 Stage 2 (26.7 %) Stage 2 (23.3 %)
sD2.15 Stage 3 (58.3 %) Stage 3 (41.7 %)
RDS “Warehousing” Stage 1 (19.8 %) Stage 1 (14.5 %)
sD2.8 Stage 2 (20.5 %) Stage 1 (12.8 %)
sD2.9 Stage 1 (20.0 %) Stage 1 (16.7 %)
sD2.10 Stage 1 (19.0 %) -
RDS “Shipping” Stage 2 (33.3 %) Stage 1 (18.2 %)
sD2.5 Stage 2 (35.7 %) -
sD2.6 Stage 1 (16.7 %) -
sD2.7 Stage 2 (36.7 %) -
sD2.11 Stage 3 (42.4 %) Stage 1 (18.2 %)
sD2.12 Stage 2 (33.3 %) -
In general, the delivery process in factory A is more mature than in factory B. No process element scores higher in factory B than in factory A and thus confirms the heterogeneity of the processes. However, the assessment revealed great potential for improvement in factory A. The most digitized process element is “invoice” (sD2.15) for both sites. The least digitized element
is the “inquiry and quote” (sD2.1). The tabular results can be visualized, which is particularly useful in practice. Radar charts are used for this purpose (see Figure 5.1).
Figure 5.1 Radar chart for factories A (left) and B (right)
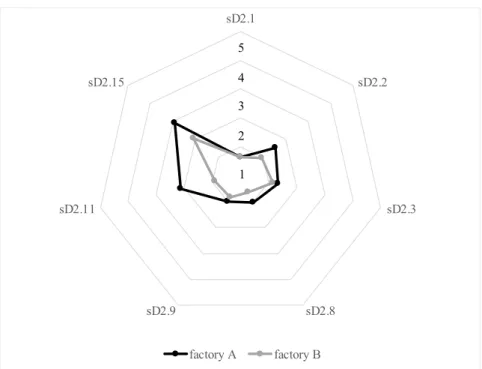
Figure 5.2 helps decision-makers to see at first glance how their factories compare with respect to the process elements present at both sites. The reasons for the differences were discussed in the accompanying interview. The manager provided two possible explanations: Whereas performance measurement in plant B focuses on order lead and production lead times, factory A regards customer satisfaction as the most important key performance indicator. This may have served as an incentive to perform well in the customer-bound delivery process. Moreover, as already mentioned, the two factories work on different Incoterms. This leads to different perceptions of relevance within the factories and is reflected by the assessment results.
Figure 5.2 Radar chart for internal benchmarking of both factories
sD2.1
sD2.2
sD2.3
sD2.5
sD2.6
sD2.7 sD2.8
sD2.9 sD2.10 sD2.11
sD2.12 sD2.15
1 2 4 3 5
sD2.1
sD2.2
sD2.3
sD2.8 sD2.9
sD2.11 sD2.15
1 2 4 3 5
sD2.1
sD2.2
sD2.3
sD2.8 sD2.9
sD2.11 sD2.15
factory A factory B 1
2 3 4 5
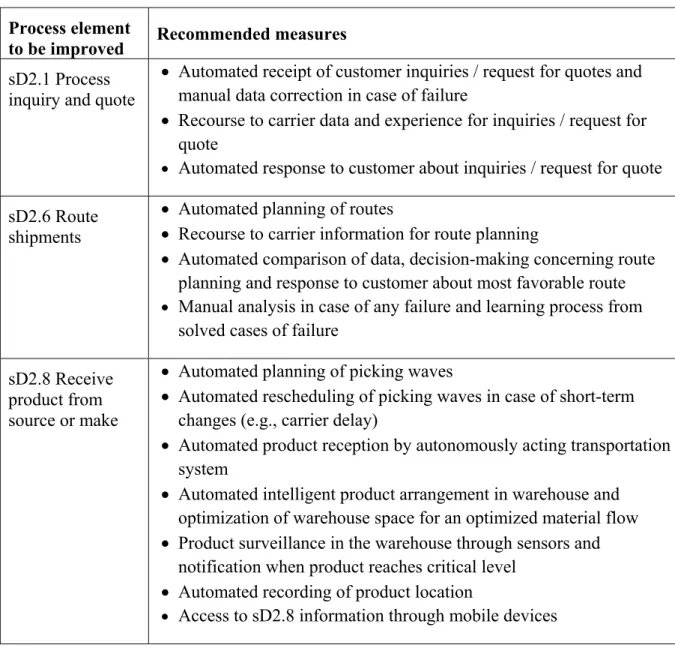
When deriving a development path, it is recommended to concentrate on the process elements with the lowest scores, which in turn have the greatest digitization deficits. To derive appropriate measures for closing existing gaps within the process elements, the next level of maturity used. Thus, factory A should improve the two process elements with the lowest relative scores, sD2.1 and sD2.6 followed by sD2.8, sD2.9 and sD2.10. Table 5.2 outlines suitable measures for the process elements mentioned.
Table 5.2 Recommended measures for factory A Process element
to be improved Recommended measures sD2.1 Process
inquiry and quote
Automated receipt of customer inquiries / request for quotes and manual data correction in case of failure
Recourse to carrier data and experience for inquiries / request for quote
Automated response to customer about inquiries / request for quote sD2.6 Route
shipments
Automated planning of routes
Recourse to carrier information for route planning
Automated comparison of data, decision-making concerning route planning and response to customer about most favorable route
Manual analysis in case of any failure and learning process from solved cases of failure
sD2.8 Receive product from source or make
Automated planning of picking waves
Automated rescheduling of picking waves in case of short-term changes (e.g., carrier delay)
Automated product reception by autonomously acting transportation system
Automated intelligent product arrangement in warehouse and optimization of warehouse space for an optimized material flow
Product surveillance in the warehouse through sensors and notification when product reaches critical level
Automated recording of product location
Access to sD2.8 information through mobile devices
sD2.9 Pick product
Automated retrieval of the required order and determination of inventory availability
Automated planning of picking waves
Automated rescheduling of picking waves in case of short-term changes (e.g., carrier delay)
Product collection by picker supported through wearables (especially glasses)
Manual analysis in case of any failure and learning process from solved cases of failure
sD2.10 Pack product
Automated sorting and combing of products to efficient bundles
Automated configuration of an efficient and resource-saving packaging / package units
Recourse to carrier information for product packaging and efficient bundles
Manual recombining of bundles or rescheduling of picking waves in case of short-term changes (e.g., carrier delay)
Manual analysis in case of any failure and learning process from solved cases of failure
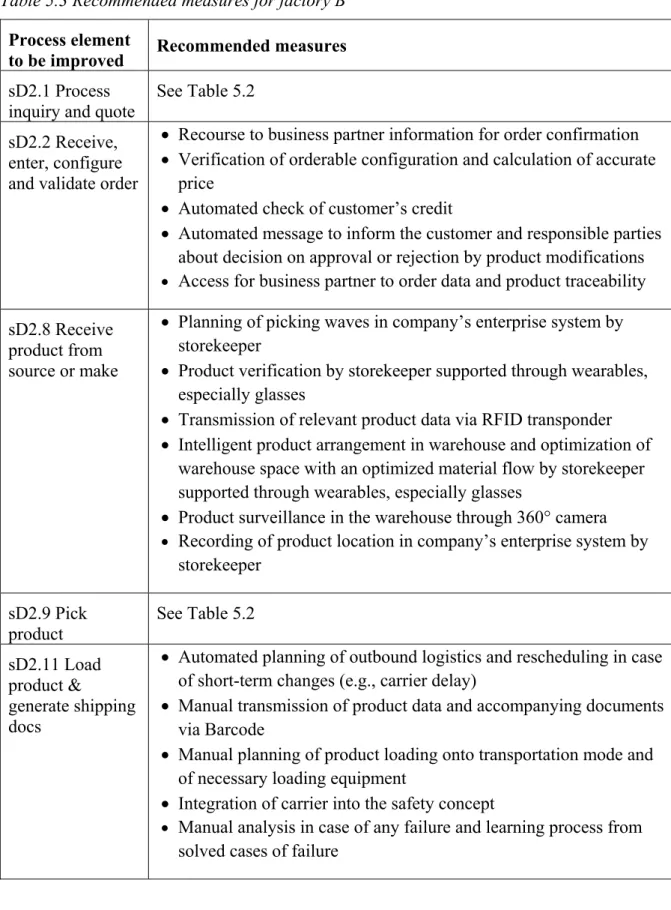
Accordingly, factory B is recommended to focus on the process elements sD2.1, sD2.8, and sD2.9. However, priority should be given to elements sD2.2 and sD2.11, which have slightly higher scores. Because factory A has reached higher stages at the process elements sD2.2, sD2.8, and sD2.11, it can serve as a role model and guide the transformation process. In particular, process element sD2.11, which records the highest absolute difference of all values, would benefit from such an exchange between the factories. Besides, since both factories perform poorly in the elements sD2.1 and sD2.9, it might be useful to improve the process together. Table 5.3 summarizes the measures for improving the respective process elements.
Overall, the measures derived indicate that the degree of automation must be increased in both plants. In addition, data and information flows, especially between factory and business partners, need to be automated to get closer to Industry 4.0 process excellence. Automated data and error analysis is required to enable machine learning as the next step. The measures listed in Table 5.2 and Table 5.3 can be interpreted as a short list for process development. It must be ensured that they are in line with both the corporate and the supply chain strategy. The participating manager ensured that this would be the case for all proposed measures. Before a suggested measure is selected and implemented, company-specific cost-benefit analyses must be carried out. To achieve this, quotes must be sought and compared with potential benefits such as a faster, more reliable, cheaper delivery.
Table 5.3 Recommended measures for factory B Process element
to be improved Recommended measures sD2.1 Process
inquiry and quote
See Table 5.2 sD2.2 Receive,
enter, configure and validate order
Recourse to business partner information for order confirmation
Verification of orderable configuration and calculation of accurate price
Automated check of customer’s credit
Automated message to inform the customer and responsible parties about decision on approval or rejection by product modifications
Access for business partner to order data and product traceability sD2.8 Receive
product from source or make
Planning of picking waves in company’s enterprise system by storekeeper
Product verification by storekeeper supported through wearables, especially glasses
Transmission of relevant product data via RFID transponder
Intelligent product arrangement in warehouse and optimization of warehouse space with an optimized material flow by storekeeper supported through wearables, especially glasses
Product surveillance in the warehouse through 360° camera
Recording of product location in company’s enterprise system by storekeeper
sD2.9 Pick product
See Table 5.2 sD2.11 Load
product &
generate shipping docs
Automated planning of outbound logistics and rescheduling in case of short-term changes (e.g., carrier delay)
Manual transmission of product data and accompanying documents via Barcode
Manual planning of product loading onto transportation mode and of necessary loading equipment
Integration of carrier into the safety concept
Manual analysis in case of any failure and learning process from solved cases of failure
Furthermore, the participating manager was asked for suggestions to improve the DPMM 4.0, especially for practicability. He particularly praised comprehensiveness and the customizability of the assessment. Within a short time, detailed and complete results were achieved for both factories. Evaluation results corresponded to the company’s perception about its current Industry 4.0 capabilities with regards to the delivery process. The manager stressed that it would
be desirable to have additional external benchmarks of companies in the same industry and with a similar number of employees to get feedback on the company’s relative position in the market.
Despite the positive feedback, the participating manager stressed the importance of shedding light on some potential blind spots of the assessment due to the adaptability. He referred to factory B which is currently working on an EXW policy. For this reason, several shipping process elements were omitted during the assessment (see Table 5.1). However, the corresponding process steps continue to take place – not at the evaluated sites but with the respective external service providers. It is therefore necessary to evaluate these steps in collaboration with the supply chain partners. When a company works with multiple service providers, it is unrealistic to collect data from everyone. In these cases, exemplary service providers should be selected to conduct the assessment.
6. IMPLICATIONS AND OUTLOOK
This paper presents a case study at two sites of one of the world’s leading electric equipment manufacturers to complete the development process of the DPMM 4.0 as proposed by de Bruin et al. (2005). While such validation step is required with regards to a methodologically rigorous development process it also provides theoretical and managerial implications.
First, this research contributes to a more detailed understanding of the current digitization efforts in business practice. With a focus on outbound logistics it adds a complementary perspective to the often investigated manufacturing process (e.g., Leyh et al., 2016; Katsma et al., 2011). This is important as manufacturing processes are by no means the only supply chain processes to be digitized. Second, this work also contributes to the available logistics maturity models (e.g., Battista et al., 2012). The existing models do not account for the current digitization trends and are therefore of little use for decision-makers, who want to prepare for the digital age ahead. Third, this work adds to the emerging literature of cyber-physical logistics systems (CPLS). The final DPMM 4.0 maturity stage describes a process that is fully transparent to all actors involved with embedded, linked IT-systems that autonomously act and interact with the environment, which reflect the concept of CPLS. So far, CPLS have only been described (e.g., Pujo and Ounnar, 2018), whereas our paper provides an example as of how to improve towards a state of excellence.
With regards to business practice, this work provides managers with valuable insights into how to approach the digitization of outbound logistics, which is particularly relevant as it involves direct customer contact. Such effort would most certainly not be too late as the case study reveals low digitization levels with regards to outbound logistics, although the company sees itself as one the most digitized companies in the industry. Our results indicate that logistics processes could become a critical bottleneck on the path towards a connected and smart supply chain. Decision-makers who want to evolve their supply chains should therefore take a more balanced approach and not just focus on manufacturing.
A major limitation of this paper is that the model has only been applied to two factories of one company. Nevertheless, it appears applicable to other enterprises because of the high flexibility of the model’s architecture and the positive feedback received during the case study. Moreover, the data within the case came from a single source within the company and the corresponding author’s visit at the assessed production sites. In terms of data triangulation (Denzin, 2006), it would have been desirable to further increase the number of sources (time, space, and person).
However, the number of persons with sufficient expertise concerning the digitization of the logistics processes is limited. This applies in particular to large companies with highly specialized job profiles. For these reasons, we call for future investigations to replicate our
data sources. Against this background, studies using a mixed-method approach also appear promising.
While this case study concludes the model development, it is by no means the end of the project.
We are currently working on an online DPMM 4.0 assessment tool to collect data about the actual status quo of digitization in outbound logistics. These data may serve as reference points for external benchmarks and give companies a quick first impression of how they compare. The successful model application can also motivate the development of other process-based maturity models, for example for the sourcing process, which is necessary to fully realize the vision of a seamless, transparent, and efficient value creation network that remains competitive in the digital age.
REFERENCES
Almada-Lobo, F. (2015), “The Industry 4.0 revolution and the future of Manufacturing Execution Systems (MES)“, Journal of Innovation Management, Vol. 3 No. 4, pp. 16–
21.
Asdecker, B. and Felch, V. (2018), “Development of an Industry 4.0 maturity model for the delivery process in supply chains”, Journal of Modelling in Management (submitted, under review).
Battista, C., Fumi, A. and Schiraldi, M. M. (2012), “The Logistic Maturity Model: guidelines for logistic processes continuous improvement”, in Proceedings of the XXIII World POMS Conference, Chicago.
Christopher, M. (2016), Logistics and Supply Chain Management, Pearson, Harlow.
De Bruin, T., Freeze, R., Kaulkarni, U. and Rosemann, M. (2005), “Understanding the Main Phases of Developing a Maturity Assessment Model”, in 16th Australasian Conference on Information Systems, Sydney, pp. 8–19.
De Carolis, A., Macchi, M., Negri, E. and Terzi S. (2017), “A Maturity Model for Assessing the Digital Readiness of Manufacturing Companies”, in Lödding, H., Riedel, R., Thoben, K.D., von Cieminski, G. and Kiritsis, D. (Ed.), Advances in Production Management Systems. The Path to Intelligent, Collaborative and Sustainable Manufacturing. APMS 2017. IFIP Advances in Information and Communication Technology, Springer, Cham, pp. 13–20.
Denzin, N. K. (2006), Sociological Methods: A Sourcebook, Aldine Transaction, New Brunswick, N.J..
Ernst, R. and Kamrad, B. (2000), “Evaluation of supply chain structures through modularization and postponement”, European Journal of Operations Research, Vol. 124 No. 3, pp. 495–
510.
Ganzarain, J. and Errasti, N. (2016), “Three stage maturity model in SME’s toward industry 4.0”, Journal of Industrial Engineering and Management, Vol. 9 No. 5, pp. 1119–1128.
Gilchrist, A. (2016), Industry 4.0: The Industrial Internet of Things, Apress, New York, NY.
Glistau, E. and Coello Machado, N. I. (2018), “Industry 4.0, Logistics 4.0 and Materials - Chances and Solutions”, Materials Science Forum, Vol. 919, pp. 307–314.
Göçmen, E. and Erol, R. (2018), “The Transition to Industry 4.0 in one of the Turkish logistics company”, International Journal of 3D Printing Technologies and Digital Industry, Vol. 2 No. 1, pp. 76–85.
Gökalp, E., Şener, U. and Eren, P.E. (2017), “Development of an Assessment Model for Industry 4.0: Industry 4.0-MM”, in Mas, A., Mesquida, A., O'Connor, R., Rout, T. and Dorling, A. (Ed.), Software Process Improvement and Capability Determination. SPICE 2017. Communications in Computer and Information Science, Vol. 770, Springer, Cham, pp. 128–142.
Helgesson, Y. Y. L., Höst, M. and Weyns, K. (2012), “A review of methods for evaluation of maturity models for process improvement”, Journal of Software: Evolution and Process, Vol. 24 No. 4, pp. 436–454.
Hermann, M., Penetek, T. and Otto, B. (2016), “Design Principles for Industrie 4.0 Scenarios”, in 2016 49th Hawaii International Conference on System Sciences (HICSS), pp. 3928–
3937.
Hofmann, E. and Rüsch, M. (2017), “Industry 4.0 and the current status as well as future prospects on logistics”, Computers in Industry, Vol. 89, pp. 23–34.
Kagermann, H., Wahlster, W. and Helbig, J. (2013), “Recommendations for implementing the
strategic initiative Industrie 4.0”, available at:
http://www.acatech.de/fileadmin/user_upload/Baumstruktur_nach_Website/Acatech/roo t/de/Material_fuer_Sonderseiten/Industrie_4.0/Final_report__Industrie_4.0_accessible.p df (accessed 19 April 2018).
Katsma, C., Moonen, H. and van Hillegersberg, J. (2011), “Supply chain systems maturing towards the Internet-of-Things: a framework”, in 24th Bled eConference eFuture:
Creating Solutions for the Individual, Organisations and Society Proceedings, Bled, pp.
478–494.
Klötzer, C. and Pflaum, A. (2017), “Toward the development of a maturity model for digitalization within the manufacturing industry’s supply chain”, in 2017 50th Hawaii International Conference on System Sciences, Waikoloa Village, 2017, pp. 4210–4219.
Leyh, C., Schäffer, T., Bley, K. and Forstenhäusler, S. (2016), “SIMMI 4.0 – A Maturity Model for Classifying the Enterprise-wide IT and Software Landscape Focusing on Industry 4.0”, in Federated Conference on Computer Science and Information Systems, Gdansk, pp. 1297–1302.
McCormack, K., Ladeira, M.B. and Valadares de Oliveira, M.P. (2008), “Supply chain maturity and performance in Brazil”, Supply Chain Management: An International Journal, Vol.
13 No. 4, pp. 272–282.
Nicolletti, B. (2018), Agile Procurement - Volume I: Adding Value with Lean Processes, Palgrave Macmillan, Cham.
Oesterreich, T. D. and Teuteberg, F. (2016), “Understanding the implications of digitisation and automation in the context of Industry 4.0: A triangulation approach and elements of a research agenda for the construction industry”, Computers in Industry, Vol. 83, pp. 121–
139.
Pan, S., Trentesaux, D. and Sallez, Y. (2016), “Specifying self-organising logistics system:
openness, intelligence, and decentralised control”, in Borangiu, T., Trentesaux, D., Thomas, A., Leitão, P. and Oliveira, J-B. (Ed.), Proceedings of Service Orientation in
Pujo, P. and Ounnar, F. (2018), “Cyber-Physical Logistics System for Physical Internet”, in Borangiu, T., Trentesaux, D., Thomas, A. and Cardin, O. (Ed.), Service Orientation in Holonic and Multi-Agent Manufacturing, Springer, Cham, pp. 303–316.
SCOR (2017), Supply Chain Operations Reference Model – Version 12.0, Cypress.
Stake, R. E. (1995), The art of case study research, Thousand Oaks, Sage.
Strandhagen, J. O., Vallandingham, L. R., Fragapane, G., Strandhagen, J. W., Stangeland, A.
B. H. and Sharma, N. (2017), “Logistics 4.0 and emerging sustainable business models”, Advances in Manufacturing, Vol. 5 No. 4, pp. 359–369.
Thomas, G. (2011), How to do your case study: a guide for students and researchers, Sage, Los Angeles.
Van Landeghem, R. and Persoons, K. (2001), "Benchmarking of logistical operations based on a causal model", International Journal of Operations & Production Management, Vol.
21 No. 1/2, pp. 254–267.
Weber, C., Königsberger, J., Kassner, L. and Mitschang, B. (2017), “M2DDM – A Maturity Model for Data-Driven Manufacturing”, Procedia CIRP, Vol. 63, pp. 173–178.
Wendler, R. (2012), “The maturity of maturity model research: A systematic mapping study”, Information and Software Technology, Vol. 54 No. 12, pp. 1317–1339.
Yin, R. K. (2003), Case study research: design and methods, Thousand Oaks, Sage.
Zhou, K., Liu, T. and Zhou, L. (2015), “Industry 4.0 - Towards future industrial opportunities and challenges”, in 2015 12th International Conference on Fuzzy Systems and Knowledge Discovery, Zhangjiaji, 2015, pp. 2147–2152.