Research Collection
Doctoral Thesis
Shaping Physical Landscape
Point cloud modeling as a site-specific design method in landscape architecture applied to a case study in Singapore
Author(s):
Urech, Philipp R.W.
Publication Date:
2021
Permanent Link:
https://doi.org/10.3929/ethz-b-000476616
Rights / License:
In Copyright - Non-Commercial Use Permitted
This page was generated automatically upon download from the ETH Zurich Research Collection. For more information please consult the Terms of use.
Shaping Physical Landscape
Philipp RW Urech
Doctoral Thesis ETH Zurich 2021
DISS. ETH NO. 27236
Shaping Physical Landscape
Point cloud modeling as a site-specific design method in landscape architecture applied to a case study in Singapore
A thesis submitted to attain the degree of Doctor of Sciences of ETH Zurich (Dr. sc. ETH Zurich)
presented by
Philipp Rudolf Walter Urech
MSc ETH in Architektur
born on 11.7.1982
citizen of Switzerland, Seon AG
accepted on the recommendation of Prof. Christophe Girot (Supervisor) Chair of Landscape Architecture ETH Zurich
Prof. Adrienne Grêt-Regamey (Co-Supervisor) Chair of Planning Landscape and Urban Systems ETH Zurich
Prof. Bradley Cantrell (Co-Supervisor) Chair of Landscape Architecture
University of Virginia School of Architecture
2021
Abstract
The design of large-scale urban landscapes is often developed without topographical context and fails to establish a cohesive relation between terrain, vegetation cover and urban space. This dissertation devises a practical design method that enables proficiency to shape the physical form of the landscape by drawing from the well-established technique of laser-scanning. The method involves producing geo-referenced point cloud models from site data and manipulating them to invent new landscape forms. Three-dimensional modeling of this data allows the physical shape of a site to be integrated into the design process, and transformed according to a topological approach. The application of the method is demonstrated using the Rail Corridor in Singapore as a case study.
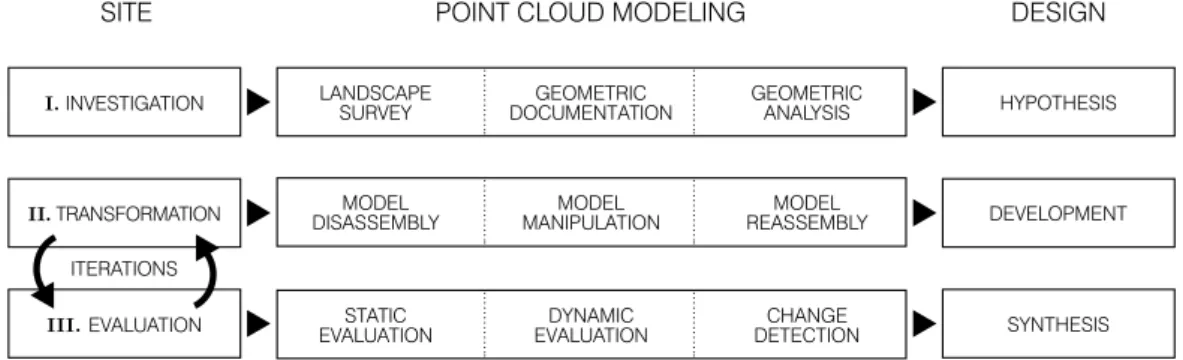
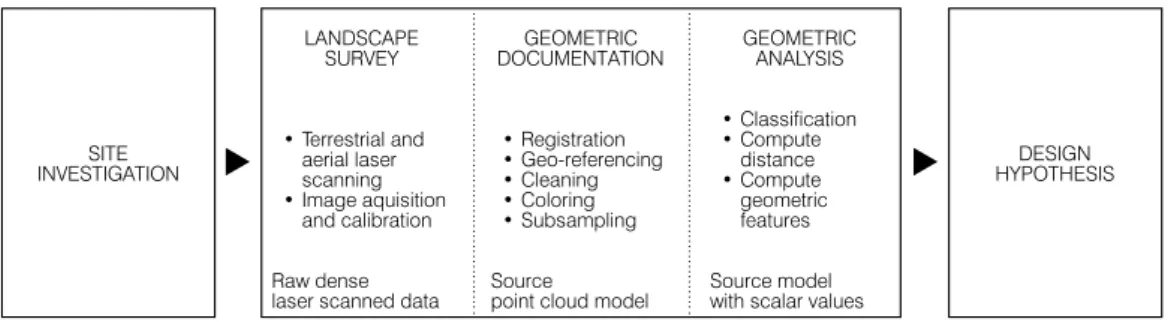
Three phases structure the application of the method and correspond to the investigation, transformation and evaluation of point cloud models. In the phase of investigation, the site survey results in a geometric documentation in the form of a point cloud model, which is analyzed to incorporate site-specific logic into the design process.
The phase of transformation uses digital modeling to guide design development by selectively transforming the laser-scanned model. In the phase of evaluation, design scenarios represented by transformed point cloud models are iteratively tested for their performance, highlighting opportunities for improving the design. The three phases support the hypothesis, development and synthesis of the design process.
The methodological steps of point cloud modeling allow for a better understanding
and shaping of landscapes, establishing a close link with the site and the context. The thesis
argues to consolidate a common ground for disciplines related to the form of urban
landscapes, to establish a design expertise with topography, to foster a topological approach
in digital landscape design that encourages a cultural accumulation on the site, and to form
an understanding of the landscape that is both holistic and idiosyncratic. By strengthening
three-dimensional thinking at a variety of scales, the design method with point cloud
modeling strengthens the disciplinary core of landscape design and contributes to
imagining new landscapes that respond to global change and specific site conditions.
Résumé
La conception de paysages urbains à grande échelle est souvent développée hors du contexte topographique et ne parvient pas à établir une relation cohérente entre le terrain, la couverture végétale du sol et l'espace urbain. Cette thèse élabore une méthode pratique de conception qui permet de modeler la forme physique du paysage en s'inspirant de la technique bien établie de la lasergrammétrie. La méthode consiste à produire des modèles de nuages de points géoréférencés à partir des données d’un site et à les manipuler pour inventer de nouvelles formes de paysage. La modélisation tridimensionnelle de ces données permettent d'intégrer la forme physique d'un site dans le processus de conception, et de la transformer selon une approche topologique. L'application de la méthode est démontrée en utilisant le corridor ferroviaire de Singapour comme étude de cas.
Trois phases structurent l'application de la méthode et correspondent à l'investigation, la transformation et l'évaluation des modèles de nuages de points. Dans la phase d'investigation, le relevé du site produit une documentation géométrique sous la forme d'un modèle de nuage de points dont l’analyse intègre une logique propre au site dans le processus de conception. La phase de transformation utilise la modélisation digitale pour guider l'élaboration de la conception en transformant de manière sélective le modèle scanné par laser. Dans la phase d'évaluation, des scénarios de conception représentés par des modèles de nuages de points transformés sont testés itérativement pour leur performance, mettant en évidence les possibilités d'améliorer le projet. Les trois phases appuient l'hypothèse, le développement et la synthèse du processus de conception.
Les étapes méthodologiques de la modélisation par nuages de points permettent de
mieux comprendre et de façonner les paysages, en établissant un lien étroit avec le site et le
contexte. La thèse soutient la consolidation d'un terrain commun pour les disciplines liées
à la forme des paysages urbains, l'établissement d'une expertise de conception avec la
topographie, la mise en œuvre d'une approche topologique dans la conception digitale du
paysage qui encourage l'accumulation culturelle sur le site, ainsi que la formation d'une
compréhension du paysage qui est à la fois holistique et idiosyncrasique. En renforçant la
pensée tridimensionnelle à diverses échelles, cette nouvelle méthode de conception
renforce le noyau disciplinaire de la conception paysagère et contribue à imaginer de
nouveaux paysages capables de répondre au changement planétaire et aux conditions
spécifiques du site.
To my parents
Acknowledgement
First of all, I would like to thank my mentor, Prof. Christophe Girot, for his inspiration and support. I am deeply grateful to him for having guided me throughout my research and for having given me the extraordinary opportunity to investigate new methods by teaching design and developing them with my personal view. I would like to express my gratitude to my co-advisor, Prof. Adrienne Grêt-Regamey, who opened up to me a new perspective with precious discussions and stimulating insights that were a great source of inspiration. I would like to offer special thanks to Prof. Bradley Cantrell for his inspiring work and his enthusiasm for my research, despite our meetings were, albeit, not possible in person in a time of worldwide lockdown.
I would like to thank Prof. Erwin Viray and Prof. Joshua Comaroff for the fruitful
collaboration with the Singapore University of Technology and Design, that was essential
for elaborating the landscape designs described in this thesis. I would like to acknowledge
my colleagues at the Chair of Prof. Christophe Girot, especially Magdalena Kaufmann,
Benedikt Kowalewski, Fujan Fahmi, Dennis Häusler, for their precious support in the
Design Studio. My thanks also go to my students, in particular, Nabila Larasati Pranoto,
Melissa Mak Li Ping, Michael Zhi Wei Yeow, Zayar Lin, Sandrine Badoux, Niels Galitch
and Kelly Man for their hard work and keenness to experiment with a novel design
approach. I am very grateful to Gerhard Schrotter for his help in liaising to gather the
geospatial data needed to run the studios. I gratefully acknowledge the Singapore Land
Authority for providing the 2014 Aerial Laser Scan data along the Rail Corridor in
Singapore.
To my friends and colleagues Dr. Aurel von Richthofen, Dr. Ervine Lin, Dr. Yazid Ninsalam, Dr. Andreas Kalpakci, Ben Gitai, Dr. Ilmar Hurkxkens, Dr. Susan Ahn, Sebastian Linsin for the precious discussions and feedback on the topic of ‘levitating’ points.
I would like to thank my colleagues at the module Ecosystem Services in Urban Environments at the Future Cities Laboratory for the friendly environment and, in particular Angela Dissegna and Dr. Muhammad Omer Mughal for their simulations on the designs scenarios and Dr. Daniel Richards for his support with the laser-scanning surveys.
I also would like to thank architects Maurizio and Salvatore Dello Buono for letting me experiment in previous years with modeling techniques that were essential for developing the design method described in this thesis. My thanks go to Professor Andreas Georgopoulos for his references on geometric documentation and to architect Penne Hangelbroek for his kind explanations about his project at Fort Vechten. To Yiqiu Liu, Srilalitha Gopalakrishnan, Taku Suzuki, for helping me gather information on the 2015 competition of the Rail Corridor.
My affection goes to my family, especially my parents Claudia and Maurice and my brother Nicolas and his wife Lucia, for their special support during this three-year exodus in Asia and their welcoming places during my returns to Europe.
This research project would not have been possible without the financial support of
the Singapore’s National Research Foundation (FI 370074011), under the Campus for
Research Excellence and Technological Enterprise Programme, and without the necessary
environment provided by the Future Cities Laboratory.
Content
Abstract 3
Résumé 4
Acknowledgement 7
Introduction 11
1. State of the art 15
1.1. Shaping landscape 16
1.2. Design with maps 19
1.3. Replicating the landscape form 22
1.3.1. Documentation of topographic form 22
1.3.2. Above the topographic base 24
1.3.3. Measuring the form with laser-scanning 27
1.4. State of the art in design practice 30
1.4.1. Design competition for the Rail Corridor 30
1.4.2. Design competition for the One North district 33
2. Methodological approach 36
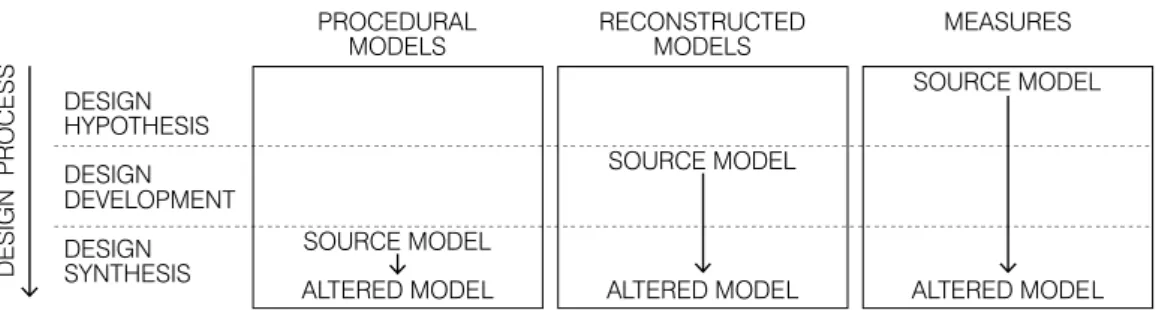
2.1. Design through modeling 36
2.1.1. The source model 37
2.1.2. The altered model 38
2.1.3. Point cloud modeling 39
2.2. Designing the Rail Corridor 41
2.2.1. Design Research Studio 41
2.2.2. Site and context 42
2.2.3. Application of the design method 43
3. Investigation 45
3.1. Context 46
3.1.1. Applications of geometric documentation 47
3.1.2. Applications of geometric analysis 48
3.2. Methodological steps 49
3.2.1. Geometric survey of the Rail Corridor 50
3.2.2. Geometric documentation in landscape design 52
3.2.3. Geometric analysis of landscape features 57
3.3. Application 60
3.3.1. A multi-contextual method 61
3.4. Outcomes 63
4. Transformation 65
4.1. Context 66
4.2. Methodological steps 67
4.2.1. Disassembly 68
4.2.2. Manipulation 70
4.2.3. Reassembly 71
4.3. Application 73
4.3.1. Forming topography 74
4.3.2. Topographic placement 77
4.3.3. Staging the form of urban landscapes 79
4.4. Outcomes 80
5. Evaluation 83
5.1. Context 85
5.1.1. The dynamic nature of landscapes 86
5.1.2. Performance in landscape design 86
5.2. Methodological steps 87
5.2.1. Static evaluation 88
5.2.2. Dynamic evaluation 95
5.2.3. Change detection in landscape transformations 100
5.3. Application 106
5.3.1. Designing with evidence 109
5.4. Outcomes 110
6. Discussion and conclusion 112
6.1. A holistic and site-specific design attitude 114
6.1.1. Point cloud modeling in Topology 114
6.1.2. Idiosyncratic modeling 115
6.1.3. Shaping landscape as a cultural project 116
6.2. The art and science of surface manipulation 117
6.2.1. The generative role of topography 118
6.2.2. Thinking across scales and functions 120
6.3. Final Reflections 121
7. Appendix 124
7.1. Bibliography 124
7.2. List of figures 144
7.3. List of Acronyms 152
7.4. Curriculum Vitae 153
Introduction
Motivation
Since the 1950s, globalization and the ensuing rapid urbanization around the world have resulted in radically new settlement types and land use patterns being superimposed upon, rather than integrated with, existing ones.
1Economic, legal and functional contexts have contributed to fragmenting spatial entities that characterize the reality of edge cities, urban hinterland and transitional landscapes.
2This tendency is in part linked to widespread zoning practices that attribute divisions and functions to areas incompatible with the physical environment. Land-use plans and master plans condescend in positivist planning approaches that fail to elucidate the spatial shape of the physical environment. As a result, the design of large-scale urban landscapes is regularly developed without building a strong relationship with the existing site. The urban form then ensues from arbitrary contexts in which administrative and cadastral information prevails over physical realities. Despite the development of techniques to represent forms, such as the perspective, figure-ground maps and contour lines, it remains unclear how the complex morphology of the environment in the design process should be handled. A limitation of current methods for designing urban landscapes lies in the lack of topographic inclusion. The topography is too often taken as a disconnected backdrop among many interchangeable layers, instead of being used as an interface for balancing the ecological, cultural and spatial issues of landscape design. The topography is not observed with adequate analysis and representational tools; it is instead forcefully represented with cartographic means developed for static objects such as buildings.
Any design, however, confronts the reality of the site at some point between the phases of conceptualization and implementation. Insufficient contextual knowledge at the outset does not prevent implementing the design but may come at a high cost to the site or the project. Instead, early consideration of landscape features enables critical design decisions and allows the formal characteristics of the site to contribute to the production of the design. In this way, site transformations can be kept to the minimum necessary to implement the project, thus avoiding disrupting natural cycles, losing the aesthetic qualities
1 Antrop, “Why Landscapes of the Past Are Important for the Future.”
2 Berger, Drosscape, 26–33.
of the site, inflating costs of terrain displacement and breaking the cohesion of large-scale environments. Dynamics of climate, soil, vegetation and human impact need to be negotiated on the topographic surface. Surprisingly, topography has played a secondary role in the process of shaping modern cities. The lack of topographic inclusion in design approaches prevents the achievement of a coherent relationship between terrain, land cover and urban space. This doctoral thesis aims to devise a method in landscape design that integrates formal features of the physical environment into the design process. The design method consists of manipulating geo-referenced data in the form of 3D point cloud models.
Designs are produced by following methodological steps of point cloud modeling through the phases of investigation, transformation and evaluation. This new design method allows designers to acquire the skill necessary to shape the physical form of the landscape by drawing from the formal structure of an existing site.
Structure of the thesis
The six chapters of the thesis develop the arguments for using geometric survey data to create landscape designs. Chapter 1 presents the state of the art, and exposes an existing gap for how to include topographic information during design development. The limitations of current methods are illustrated with examples of recent competitions and implementations in the urban landscape of Singapore. Chapter 2 introduces a new methodological approach for landscape design. A design method with point cloud modeling is proposed as a way to interact with the physical form of the environment. The design of the Rail Corridor in Singapore is taken as a case study to explain the three phases constituting the method. Chapter 3 details the investigative phase of the design method.
Survey and analysis of the site are used in the development of the design hypothesis.
Chapter 4 exposes the transformative phase of the method. The transformation of point cloud models is explained in the context of design development. Chapter 5 describes the evaluative phase of the method and illustrates how point cloud modeling can be integrated with performance testing to develop landscape designs. The process uses an iterative loop that leads to a design synthesis. Chapter 6 answers the two research questions of the thesis and discusses the outlook of the work in general. The discussion includes the generative role of topography and the potential of the design method.
Research questions
The main objective of this research is to invent a method in landscape design that integrates formal features of the physical environment into the design process. This objective can be achieved by articulating the research through the following two research questions:
• How can point cloud models be used to shape landscape designs with topological intent?
• In what ways does point cloud modeling integrate the landscape form in a new
process of shaping the landscape?
Research methods
This research means to consolidate the position of landscape design as a creative discipline for formal, functional and aesthetic composition. The research questions are answered by developing a design method in three phases that combines geospatial data with three- dimensional modeling techniques. Each phase of the method has a technical component with methodical steps to interact with point cloud models, and an applied component that contextualizes the approach in the field of landscape design.
The technical component is developed through a cross-disciplinary transfer of methods from other fields that handle laser-scanned data, towards technical steps useful in the field of landscape design. The transfer is complemented by the inclusion of literature from environmental fields such as archaeology, remote sensing and environmental sciences. Techniques of surveying and geometric documentation were refined during the 6th CIPA summer school in 2019 in Gyeongju, Republic of Korea, organized by the ICOMOS CIPA Heritage Documentation and Digital Heritage Lab, KAIST. The technical workflow to evaluate the performance of designs was developed in collaboration with researchers and engineers in the module “Ecosystem Services in Urban Landscapes” at the Future Cities Laboratory (FCL) in Singapore, led by Prof. Peter Edwards.
The applied component was developed through a series of experimental design and elective courses, under the Chair of Landscape Architecture at the ETH Zurich, Prof.
Christophe Girot, which acted as catalysts to integrate laser scan data into the design process. Innovative instruments and techniques were tested at the Landscape Visualization and Modeling Lab (LVML) and were applied in design assignments. The process has been tested in Design Research Studios (DRS) involving bachelor’s and master’s students in architecture on various sites, one of which in Singapore is used as a case study in this research. The studios allowed the verification of the research hypothesis that consists of implementing the modeling of laser scan data as a method to solve design assignments.
Case study
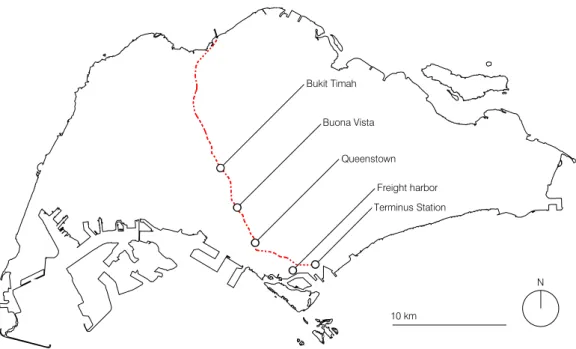
This research uses the Rail Corridor in Singapore as a case study site. A design competition about the corridor was held in 2015 and shows how the site is approached with design methods currently in use. The new design method presented in this thesis was applied to the same site through two Design Research Studios that took place in 2018. The studios were respectively conducted at the Swiss Federal Institute of Technology in Zurich (ETH), led by Prof. Christophe Girot, and at the Singapore University of Technology and Design (SUTD), taught jointly by Prof. Joshua Comaroff and the author.
Cumulative doctoral thesis
This thesis incorporates papers that have been published or submitted for publication in
peer-reviewed journals. For journals that do not allow further use of the final manuscript,
the original submission has been used according to the publishing agreement.
The published papers are:
Urech, Philipp R. W. 2019. “Point-Cloud Modeling: Exploring a Site-Specific Approach for Landscape Design.” In Journal of Digital Landscape Architecture, 290–97. Wichmann Verlag. https://doi.org/10.3929/ethz-b-000345621.
Urech, Philipp R. W. 2020. “Editing Cumulated Landscapes: Point Cloud Modeling as a Method of Analysis in Landscape Design.” Urban Planning 5 (2): 296–306.
https://doi.org/10.17645/up.v5i2.2885.
Urech, Philipp R. W., Maria Angela Dissegna, Christophe Girot, and Adrienne Grêt-Regamey.
2020. “Point Cloud Modeling as a Bridge between Landscape Design and Planning.”
Landscape and Urban Planning 203 (November): 103903.
https://doi.org/10.1016/j.landurbplan.2020.103903.
The submitted papers are:
Urech, Philipp R. W., Aurel von Richthofen, and Christophe Girot. Submitted. “Restoring Relevance to Topography into the Design of Urban Landscapes with Point Cloud Modeling.”
Urech, Philipp R. W., and M. O. Mughal, Carlos Bartesaghi-Koc. Submitted. “A performance-
based framework to iteratively analyze and shape the urban landscape using point cloud
modeling.”
1. State of the art
How landscape design became flat
The form of the landscape is a considerable challenge for designers to represent and to work with.
3Techniques currently in use represent the reality of the environment by using graphical symbols relative to the scale of investigation and levels of detail. The interaction with formal characteristics of the site is insufficient and affects the design sensitivity needed to enhance spatial qualities. Current design methods predominantly represent the physical landscape in two dimensions and use planar projections to develop and communicate design intentions. Winning proposals of landscape design competitions, such as the 2001 design for Freshkills Park in New York and the 2011 design for the conversion of Tempelhof Airport in Berlin, presented master plans as the primary document to explain project ideas and visions. On master plans, the landscape design is represented with surfaces that indicate buildings and roads, areas textured by use or material, and contour lines with height indications to explain the topography. This graphical convention comes from the long-standing practices of ichnography and cartography, which were developed to represent the environment to scale on a geometrical projection.
Maps were initially produced to store survey data. Still, they grew in significance in the field of landscape design to become regularly used in the prospective form of presentation plans, overlay maps, figure-ground drawings and mappings. Although different maps suggest fundamentally different approaches for prospective action, they all share the same planar projection on the Cartesian plane and use similar graphical symbols to express topographic survey data. In consequence, the cartographic representation abandons the ground as design material, and its morphological character is treated in a technical and inarticulate manner.
4Losing direct relation to the spatial context is intrinsic to planar representations, as they preclude forming and arranging elements in the vertical dimension of the landscape.
In addition to maps, there are types of drawings used in contemporary design, such as perspective, sections and diagrams, which represent particular aspects of the landscape.
These media became specialized as intermediate support between the site and a project in
3 Kullmann, “Hyper-Realism and Loose-Reality.”
4 Secchi, “Progetto di suolo.”
Hegemony of the maps
Representation of topographic form
the making. Instead of using surrogates in design development, Renaissance gardens were shaped with a spatial composition closely related to the site by using measuring tools such as ropes, levels and other surveying devices. The question developed in this chapter addresses how these media represent the landscape form and how they convey it to the design process. Techniques for topographic documentation have been developed over history. Yet, contemporary design methods fail to fully leverage the generative potential of the ground in shaping urban landscapes because many media do not represent the measure of physical forms. A better understanding of the site is necessary to mend contemporary cities that are fragmented, among other things, by functionalist planning practices.
51.1. Shaping landscape
The tradition of shaping land goes back to the establishment of sedentary societies and their first practices of agriculture and horticulture. The German word Landschaft conveys communal connotation to the verb schaffen, meaning ‘to create.’
6The term landscape (landscap in Middle Dutch) shares the same origin and adds to a cultural significance that refers to the pictorial representation of the land.
7The Renaissance marked the establishment of a new consciousness of landscape with the introduction of the first pictorial representations of landscapes, in which the character and the scenery of the landscape express human ideas, thoughts and beliefs.
8The Renaissance revolutionized the way space is comprehended in the west with the development of linear perspective, first demonstrated as a geometrical method by Brunelleschi in his mirror experiment and subsequently theorized in Della Pittura by Leon Battista Alberti in 1435 and in De Prospectiva pingendi by Piero Della Francesca by around 1474. Landscape, like the practical sciences of the Renaissance, was founded upon scientific theory and knowledge and first emerged as a way of seeing the external world.
9From the Renaissance to the present day, landscape design has evolved through survey and representation techniques and has led to different approaches to transform the environment.
The new consciousness of landscape that emerged from the divulgence of perspective during the Renaissance allowed landscape design to develop beyond agriculture and horticulture and to become a discipline of the arts. The Italian Renaissance garden, which subsequently influenced the French formal gardens and the English baroque garden, represented a new way to comprehend and shape the landscape. The approach was influenced by the classical Roman model and strove for a stylistic composition made of symmetries, terraces, steps and visual unity between the villa and its garden. Alberti’s treatise De Re Aedificatoria was instrumental in establishing the style of the Italian
5 Girot, “Vision in Motion.”
6 Kühne, Landscape and Power in Geographical Space as a Social-Aesthetic Construct, 50–51.
7 Corner, “Eidetic Operations and New Landscapes.”
8 Antrop, “A Brief History of Landscape Research.”
9 Cosgrove, Geography and Vision.
Compositions of the Renaissance
Renaissance garden. It refers to the architectural principles of Vitruvius (ca. 80-70 BC–ca.
15 BC) and quotes Pliny the Younger (61 AD–ca. 112 AD) to explain aesthetical and practical rules to organize a garden. Pliny’s descriptions of the Villas Tuscum and Laurentium contributed to an understanding of the visual interrelationship between building, garden and landscape. Alberti argues that a villa should be placed above the garden, where it could be seen, and the owner could look down into the garden. This visual composition was first found in Villa Medici in Fiesole near Firenze, built by Michelozzo di Bartolomeo between 1458 and 1461. The villa is situated uphill, and the slope determines the structure of the garden, cut into a stony hillside with terraces and steps to create distinct geometrical spaces each with particular views.
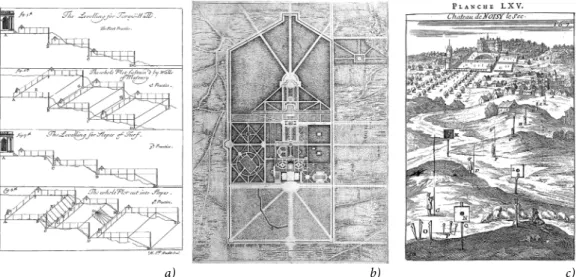
10The geometric plan of the Italian Renaissance using the discovery of the perspective was most influential for the garden style in France. By making use of the principles of perspective, French formal gardens were shaped with visual arrangements of trimmed rows of trees or of narrowing alleys, used with the purpose of adjusting sightlines and creating the illusion of greater distance. Another visual construction was the Ha-ha, or saut-de-loup, which consists of a trench to conceal fences and to remain invisible to the viewer in the distance. In his treatise Théorie et pratique du jardinage, published in Paris in 1709, Dezallier D'Argenville (1680-1765) described for the first time design principles of the French formal garden in the wake of the Gardens of Versailles designed by André Le Nôtre (1613-1700). Text and illustrations explain how to trace out with a cord the geometric figures in parterres and how to lay out avenues, lawns and entwined latticework. The treatise describes practical principles in geometry to shape the terrain, which is used for building terraces (Figure 1a).
11The earthworks are conducted with tools such as squares, plummets, cords and stakes that allowed one to determine a profile in the terrain for leveling. The modeled terrain included the construction of stairs and of supporting walls and the placement of hydraulics necessary to operate the jeux d'eau. The French formal gardens were designed without the aid of topographic maps. In the practice described by D'Argenville, the imagined geometry of the garden was marked in the field, while the actual plans of the designs were drawn after the garden was already in construction (Figure 1b).
The methods to build level terraces were adopted by Le Nôtre from the advances of military science, which had developed to move large amounts of earth rapidly.
12Modern siege warfare used wheelbarrows, carts and wagons to dig trenches and to build walls and earth fortifications. French engineer and cartographer Alain Manesson-Mallet (1630–1706) described practical applications of geometry. He used views of gardens to illustrate principles of geometry and perspective with the use of measuring instruments in the landscape, such as the proportional compass or the semicircle
13(Figure 1c). The connection
10 Antrop and Van Eetvelde, “The History of Landscape Research,” 345–46.
11 Dézallier d’Argenville, James, and Le Blond, The Theory and Practice of Gardening, 117.
12 Prévôt, Histoire des jardins, 167.
13 Manesson-Mallet, La Géometrie Pratique, 167.
Shaping the formal garden
between mathematics and the practice of gardening described by Manesson-Mallet influenced authors writing on gardening during the eighteenth century, including Stephen Switzer (ca. 1682–1745) in his Ichnographia Rustica of 1718 and Batty Langley (1696–1751) in his New Principles of Gardening of 1728. The work of Manesson-Mallet brought Switzer to discuss tasks of practical geometry for measuring, mapping and transposing straight and curved lines. Switzer argued that the aesthetic experience of a garden should not be limited to the ornamental grounds of an estate, but must include the extensive landscape of the countryside.
a) b) c)
Figure 1. The practice of geometry influences the interaction with the landscape. The illustration from the manual of D'Argenville, p.117, shows the leveling of a hill. The form is directly traced out and implemented on the site (a). Israël Sylvestre drew the plan of Vaux-le-Vicomte in 1660, shortly after the construction of the garden started (b). Manesson-Mallet illustrates in his manual, p.167, how stakes and focus points are used to draw lines in the landscape (c).
William Hogarth described the expression of naturalness that both Switzer and Langley recognized in winding lines.
14Both the serpentine line—or line of beauty—and the picturesque style from landscape paintings became references for the design of landscape gardens in the 18
thcentury and public parks in the 19
thcentury. The landscape paintings of Claude Lorrain were instrumental for staging the composition of Stourhead and other English landscape gardens. Coining the term landscape garden in his writings, Humphry Repton (1752–1818) used “before and after” paintings of rural landscapes to illustrate the change and beautification of a series of scenes. The picturesque style in landscape gardening was a conscious manipulation of landscape perspectives to compose a selection of formal elements in the foreground, middleground, and background of a view. The practice of shaping the landscape with a perspectival composition of sightlines was further developed with the French landscape garden. The decline of the formal garden brought architect Jean- Marie Morel (1728–1810) to explore a new approach of gardening, with asymmetry and
14 Hogarth and Reeves, The Analysis of Beauty.
Design with the picturesque style
irregular shapes for sites with natural topography to be kept or imitated. In his book La Théorie des Jardins,
15the emphasis on the landform shows the central role of the terrain in creating a landscape character and in developing a landscape design. Thanks to his prior education as engineer and surveyor, Morel had the necessary understanding to translate a design into operations of grading and leveling, and to apply it to his claims on the natural landscape. In his view, the natural process that created landform, which in turn defined the landscape character, falls to the landscape designer who must work following the generative operations that created the site.
16In landscape architecture, methods of measuring and of triangulation were fundamental to imagine designs that took into account the existing context. Fieldwork remains a fundamental asset for developing perspective effects and for infusing a human scale and a sense of belonging into landscape designs.
New engineering techniques enabled civil engineers to implement the construction of roads and dikes in the territory, as much as they enabled landscape designer Capability Brown (1716–1783) to dike the river of Blenheim Palace Park for creating a lake, and to narrow the topography at the height of the lake’s bridge in the 1760s. Topographic form and modification of the terrain is a major military asset. For example, the gardens of Versailles, through engineering and garden design activities, showcased French skills in designing a new landscape identity.
17Military engineer Marquis de Vauban (1633–1707) built a large number of scale-relief models under Louis XIV to study bastioned fortifications and topography used as a defense by castles and ports. Franz Ludwig Pfyffer (1716–1802), who came into contact with the French terrain modeling school, filled the gap of accurate terrain maps around Lake Lucerne in Central Switzerland by surveying and building a large terrain model to replicate the existing condition of the Alpine topography. However, during the 19
thand 20
thcentury, the use of relief models for military purposes declined, causing attrition in the practice of modeling.
1.2. Design with maps
In contrast to architects, who for hundreds of years had produced hand-constructed models to study and represent their design proposals, landscape architects relied principally on maps to design. Maps and plans at various scales, and very occasionally a section, became the standard tools for landscape design in the past century, and led to the horizontal dimension of the landscape to be considered more important than the vertical dimension.
18The significance of topography faded as design activities became increasingly dependent on maps. In the pre-modern western world, maps were produced to document rather than to transform the built environment. However, survey maps were used to plan transformations, as in the case of Charles Eliot who used sun prints to draw on survey maps
15 Morel, Théorie Des Jardins.
16 Disponzio, “From Garden to Landscape.”
17 Mukerji, Territorial Ambitions and the Gardens of Versailles.
18 Walker, “Modeling the Landscape.”
Scale models for military defense
of the Boston Metropolitan Park,
19and of Walter Burley Griffin whose new urban plan for Canberra in 1913 included existing contour lines. From the beginning of the 20
thcentury, design activity made regular use of maps as a prospective tool in the form of master plans, overlay maps, figure-ground drawings and mappings. The map-based methods continue to have a significant influence on major design ideologies as they frame contemporary design by specific projections, scales and graphic signs.
The prospective use of maps took hold in urban design with the appearance of master plans.
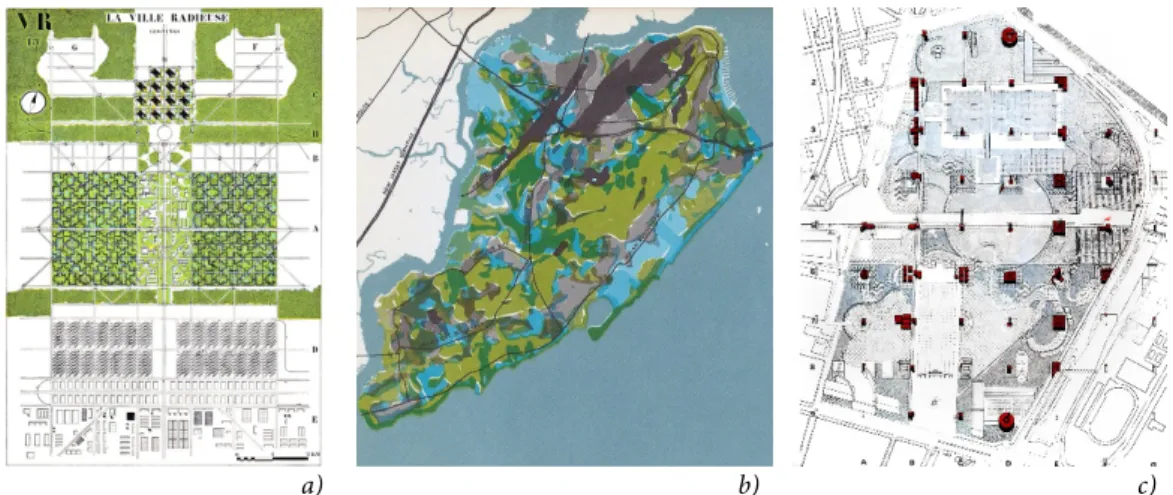
20Modernist urban design employed master plans favoring an attitude that superimposes clarity and functionalism on existing land structures. For example, the master plan presented as a zoning plan of the Radiant City
21omits indications about the terrain that is represented as a blank area without formal attributes (Figure 2a). This attitude, still implanted in contemporary urban design, is captured in Le Corbusier's famous plea for the straight line in urban design, regardless of the terrain.
22Contextual breaks ensuing from this design attitude induced the detriment of place identity and led subsequent approaches to concern themselves with local topography.
23Various map-based methods have been advanced to include survey information on urban form in the design activity. Kevin Lynch suggested a site planning approach that draws from topographic maps using graphical standards to represent ground forms, such as contour lines, elevation grids and slope hachures.
24The figure-ground technique, commonly used for urban plans, emphasizes the urban space at the street level by deliberately omitting information about the terrain.
25Another prospective method for landscape design consists of overlaying survey information to city and land use maps. Despite topographic indications not being necessarily shown on final plans, Frederick Law Olmsted and Charles Eliot used map overlays to integrate topographic and geological surveys as generative information for design. New cartographic techniques used by the United States Geological Survey (USGS) presumably inspired Eliot to represent landforms in plan view using contour lines, and to overlay them with different information drawn at the same scale.
26The map overlay technique using ecological surveys was explicitly cited by Jaqueline Tyrwhitt for the first time in 1950 and evolved in the 1960s to become a design method for ecological planning.
27The shift of the technique from a tool of analysis to a tool of planning was driven by the
19 Berrizbeitia, “Between Deep and Ephemeral Time,” 48; Nijhuis, “GIS-Based Landscape Design Research,” 60.
20 Nichols, “Maps and Meanings,” 214–33; Turner, City as Landscape, 52–57.
21 Le Corbusier, La Ville radieuse.
22 Le Corbusier, The City of To-Morrow and Its Planning, 5–12.
23 e.g., Frampton, “Towards a Critical Regionalism: Six Points for an Architecture of Resistance.”
24 Lynch, Site Planning, 19–24, 45–49.
25 Pollak, “Constructed Ground: Questions of Scale.”
26 Berrizbeitia, “Between Deep and Ephemeral Time.”
27 Steinitz, Parker, and Jordan, “Hand-Drawn Overlays.”
Maps in urban design
The method of overlay maps
prospective use of map overlays by Ian McHarg and Christopher Alexander.
28With the publication of Design with Nature in 1969, McHarg theorized how to investigate natural processes of biotic, abiotic and human origin by using overlay mappings. The maps collect information in a systematic order to reveal interactions and patterns of the landscape, as demonstrated on a study of Staten Island
29(Figure 2b). The information of thematic surveys was subsequently implemented as layers in computerized Geographic Information Systems (GIS) to study the layers and their mutual relation. The systematic analysis of landscape layers led the method to become an objective decision support for planning choices, and thus empowered planning ideologies such as landscape ecology and green infrastructure. The deterministic use of geographic information has instead become questionable for the design activity, since it does not support the creative process of shaping the landscape.
30a) b) c)
Figure 2. Prospective map-based methods include master plans, overlay plan and plan drawings. The master plan published in 1935 titled ‘La Ville Radieuse (Zoning)’ represents plain green spaces segmented by roads and buildings (a), © Fondation Le Corbusier. The Land Use Suitability Model for Staten Island is represented through an overlay of thematic maps (b), © Ian McHarg, 1969. The triple overlay of the winning design in the plan of Parc de la Villette is composed of points, lines and planes (c), © Bernard Tschumi, 1982.
Computer-aided design (CAD) initiated the expansion of 2D digital drawing into the realm of 3D modeling and found itself nested into a shifting discourse of postmodern ideology.
The iconic Deconstructivist landscape design of Parc de la Villette, built in Paris in the 1980s by Bernard Tschumi, introduced a variation of layered mapping by using the elements of point, line and surface to fabricate a notion of a space (Figure 2c). The method presented a design vocabulary of tracing in the form of structure and syntax, focusing on the deconstruction of structural elements inspired by the ideas of Jacques Derrida.
31Overcoming the positivist planning approach of the map overlay method, James Corner
28 Turner, City as Landscape, 57.
29 McHarg, Design with Nature, 103–15.
30 Turner, City as Landscape, 144–48.
31 Turner, 59.
The method of mappings
proposes a mapping method by combining Tschumi’s deconstructed reading of space with the structuring of interrelationships.
32The approach based on map-drawings holds that events have more influence on the environmental transformation than the composition of objects and surfaces. The mapping operations include layering and scaling, and enable the representation of temporal structures that subvert the conventions of static survey maps.
The complex interrelationships that structure space suggest that maps should be used as a process tool rather than as a neutral or descriptive tool.
33Mapping is thus used as an operational method that moves away from the former pictorial discourse.
34Stan Allen interprets the fluid evolution of cities not only as a metaphorical thick mat of buildings, infrastructures and ecosystems, but also as dynamic systems of climate, people and communication in permanent transformation.
35Charles Waldheim describes the task of landscape design as a shift from form-finding to a definition of relationships that support future urban design.
36However, the reliance on diagrams and maps is now criticized as a major shortcoming of landscape urbanism as they have limited capacity to engage design processes.
371.3. Replicating the landscape form
Like the relief models built under Louis XIV to use the topography for military purposes, scale models in architecture helped to explore design ideas. Terrain models representing geomorphological features have assisted in urban and landscape planning studies. Models enable new ways of perception and evolved from practices of interacting with the environment. The English word model was borrowed in the 16th century from the French word modèle, originating from the Latin modulus. Etymology connects model to “measure”
and “mould”, both related to the replication of the form of an object. In a conceptual sense, a model is a simplification of reality and has the purpose of both constructing and representing reality to predict or to explain.
38Brunet claims that the function of the specific spatial model—such as the representation of a structure or a form—is to grasp the object’s structure. The study of topographic conditions led surveyors and geographers to develop various methods of documentation.
1.3.1. Documentation of topographic form
Maps represent terrain forms using a series of graphical, hachuring and shading techniques.
Early maps used molehill pictographs and fish scales to represent mountain ranges in silhouette view. With the improvement of surveying instruments and consistent use of
32 Corner, “The Agency of Mapping,” 235–36.
33 Corner, 250–52.
34 Czerniak, “Challenging the Pictorial.”
35 Allen, “Mat Urbanism: The Thick 2-D,” 125.
36 Waldheim, The Landscape Urbanism Reader, 41–43.
37 Walliss and Rahmann, Landscape Architecture and Digital Technologies, 46.
38 Brunet, “Building Models for Spatial Analysis.”
triangulation and leveling methods, the density and accuracy of surveyed points forced the relief into planar projection.
39Topographic representation with slope and shadow hachures did not provide exact elevations until the appearance of contour lines. One of the oldest representations of terrain contours is recorded on a map of the river Spaarne drawn in 1584 that showed isobars to identify shallow waters.
40Contour lines on land were first used by Milet de Mureau on his fortification plans in 1749, and by Charles Hutton for documenting the survey of the Schiehallion hill in 1777.
41Contour lines are considered to be the only cartographic representation capable of capturing and conveying the geometric form of the terrain.
42They enabled the plotting of cross-section profiles from contour maps and definitively replaced the hachure system in the nineteenth century as the standard in cartography.
43Before exact topographic notation on maps, measures of the terrain form were documented using profiles. Archaeological and anatomical practices presumably influenced early architectural section drawings.
44Instruments like the telescope enabled Jean Picard to create a triangulation chain that led him to measure the shape and the size of the earth
45and enabled a survey practice for measuring transects,
46while depth sounding below the water level led to the production of bathymetric profiles. A maritime chart was drawn by Philippe Buache in 1737 documents the topography of the island Femao da Noronha with a maritime profile.
47Buache produced the first cross-section of Paris in 1742, contributing to the new perception of the city as a multi-layered entity of geology and infrastructure.
48Initially mainly collected for military advantage, topographic survey data at large scale became useful for territorial management. The collection of topographic information at regional scale was facilitated by aerial photogrammetry and stereoscopic plotting instruments that were developed since the 1920s and superseded traditional survey methods.
49Subsequent technologies, such as radar and laser altimeters, directly provided elevation measures. With the introduction of computers, uniformly gridded survey data is stored as digital terrain models (DTM) and processed as traditional contour lines with the support of computer-aided contour plotting.
5039 Imhof, Cartographic Relief Presentation, 1–14.
40 Fockema Andreae and van ’t Hoff, Geschiedenis der kartografie van Nederland, 75; Imhof, Cartographic Relief Presentation, 11.
41 Crone, Maps and Their Makers, 138.
42 Imhof, Cartographic Relief Presentation, 11, 111.
43 Collier, Forrest, and Pearson, “The Representation of Topographic Information on Maps.”
44 Lewis et al., Manual of Section, 26–27.
45 Brown, The Story of Maps, 246–47.
46 e.g., Manesson-Mallet, La Géometrie Pratique.
47 Crone, Maps and Their Makers, 138.
48 Picon, “Nineteenth-Century Urban Cartography and the Scientific Ideal,” 138.
49 Imhof, Cartographic Relief Presentation, 13, 17.
50 Doyle, “Digital Terrain Models.”
Documenting surveys
The dynamic nature of the environment involves deciding when a design actually takes place and which ephemeral or lasting elements it addresses. Approaches concerned with site design consider the present appearance of the site as a spatio-temporal point of reference. Topographic surveys therefore provide the necessary knowledge about the most recent terrain form to manipulate it further. In this way, the staking of a hill with the help of profiles made it possible to level baroque gardens. However, with increasing scale and density of topographic information, surveys had to be handled by state institutions rather than by private enterprise.
51The design activity developed accordingly, relying on intermediary mediums to enact design imaginations. Descriptive plans were drawn to produce prospective plans.
52The topography is thus integrated as a form of cartographic notation derived from descriptive maps.
The three-dimensional nature of terrain measures remains constrained by orthographic projections and prompts the use of media that simulates a spatial dimension.
Digital modeling plays a central role in visually integrating the third dimension during design development.
53Computer-Aided Design, introduced by Ivan Sutherland in 1963 to support design actions in virtual space, enabled interactive drawing to be combined with digital information. After that, topographic survey data was used to build digital replicas of the terrain, such as extruded contour lines and digital terrain models. A series of digital modeling techniques have emerged for topography and other polygon-based objects. These digital techniques include parallax mapping, lofting, generation and manipulation with editing tools for 3D geometry. Computer-Aided Design enabled designers to modify the digital topographic surfaces through digital manipulation,
54sculpting
55or model editing.
56Digital modeling of large topographic datasets is subject to computational constraints and often requires regular survey grids to be processed with polygon reduction and data thinning methods. The development of surface editing software for landscape design enables topographic modeling,
57grading for infrastructural work,
58and the inclusion of algorithms in the modeling process to support the design process.
591.3.2. Above the topographic base
The difficulty of relating prospective change within the full physical environment led to the communication of design intentions without explicit use of terrain measures. The change is instead expressed with visual techniques such as foldable illustrations for scenic
51 Imhof, Cartographic Relief Presentation, 8.
52 Treib, Representing Landscape Architecture, 113.
53 Antrop, “A Brief History of Landscape Research.”
54 Weibel, “On the Integration of Digital Terrain and Surface Modeling into Geographic Information Systems.”
55 Westort, “Methods for Sculpting Digital Topographic Surfaces.”
56 Ervin, “Digital Terrain Modeling.”
57 Cantrell and Yates, Modeling the Environment, 114–39.
58 Petschek, Grading.
59 Walliss and Rahmann, Landscape Architecture and Digital Technologies, 1–8.
Use of surveys in site design
Digital modeling
transformation,
60serial drawings to address urban aesthetics,
61or annotated hand-drawn perspectives.
62Since the development of Computer-Aided Design in the 80s, the same principles are used for image synthesis with digital 3D models to show imagined transformations of the landscape.
The three-dimensional representation of grain, size and shape of landscape features in Computer-Aided Design requires reconstructing polygon models.
63The models are reconstructed with 3D polygon modeling software that can process geospatial survey data.
The data is reconstructed as polygon symbols using modeling methods such as tracing, mapping, instancing, extrusion, scaling and interpolation. The topography is reconstructed as a three-dimensional surface with quotes from the digital terrain model (DTM).
64Buildings and trees are reconstructed as 3D symbols using manual or semi-automatic modeling methods.
65Building footprints provided by cadastral plans are aligned to the elevation of the digital terrain model and are extruded according to the digital surface model (DSM). Digital plants in the form of billboard images or 3D tree models are also aligned to the topographic surface and scattered randomly or according to vegetation maps.
66Models reconstructed from laser scan data may be geometrically rectified,
67modeled with polygonal surface reconstruction,
68based on parametric rules,
69generated with object instances,
70and restored from occluded areas.
71Reconstructed polygon models include city models,
72topographic landscape models
73and building information models (BIMs). They are suited to the visualization, inventory and simulation of the site and are built for specific scales since reconstruction techniques tend to simplify the physical shape of landscape features.
Reconstructed models have three major limitations for use in landscape design. First, digital reconstruction requires effort and time to model raw survey measures into 3D
60 Repton, Observations on the Theory and Practice of Landscape Gardening.
61 Cullen, Townscape.
62 Dee, Form and Fabric in Landscape Architecture.
63 Stoter et al., “State-of-the-Art of 3D National Mapping in 2016.”
64 Ervin, “Digital Landscape Modeling and Visualization,” May 25, 2001.
65 e.g., Deussen et al., “Realistic Modeling and Rendering of Plant Ecosystems”; Musialski et al., “A Survey of Urban Reconstruction”; Lintermann and Deussen, “Interactive Modeling of Plants.”
66 e.g., Ervin, “Digital Landscape Modeling and Visualization,” May 25, 2001; Favorskaya and Jain, Handbook on Advances in Remote Sensing and Geographic Information Systems, 299–303; Mach and Petschek, Visualization of Digital Terrain and Landscape Data, 165–87.
67 e.g., Lafarge and Mallet, “Creating Large-Scale City Models from 3D-Point Clouds.”
68 Nan and Wonka, “PolyFit.”
69 Murtha et al., “Beyond Inventory and Mapping.”
70 e.g., Macher, Landes, and Grussenmeyer, “From Point Clouds to Building Information Models.”
71 e.g., Cheng et al., “Three-Dimensional Reconstruction of Large Multilayer Interchange Bridge Using Airborne LiDAR Data.”
72 e.g., Müller Arisona et al., “Increasing Detail of 3D Models through Combined Photogrammetric and Procedural Modelling.”
73 For example, the official topographic landscape model of Switzerland, SwissTLM3D by Swisstopo, was reconstructed with the position and shape of natural and artificial digitally recorded objects and includes detailed information such as their type, usage and relation to other objects.
Reconstructing digital models
Limitations of reconstruction
polygon models before they can be used for designing. 3D models of large sites are therefore completed late in design development, and tend to be directly modeled as the transformed site instead of the existing site. This means that major design decisions have already been taken without the support of geospatial survey data. BIM models are typically used for detailing and manufacturing and therefore built once the design is done. They are often too rigid and sophisticated to contribute effectively to design development. Second, reconstructed models provide limited information about the form of landscape features.
For example, the accurate reconstruction of a tree grove with CAD tools would at least require designers to determine the type, size and age of plants, and to place corresponding 3D objects in the surveyed positions. Instead, trees, roads, buildings are usually reconstructed straight, smooth, with repetitions, in approximate positions, and in good and healthy conditions. Thus, the reconstruction is based on an interpretation of the environment, rather than on its real measure. Third, reconstructed models are distorted through simplifications of the geometry. By parameterizing or symbolizing building volumes and vegetation forms, the raw survey measures have been processed. This processed geometry makes reconstructed models inappropriate for precise site measures, analysis and development. As a result, reconstructed landscapes may appear artificial, repetitive or sterile. These limitations restrict the options to use reconstructed geometry as a source for landscape design. Reconstructed models have low value for analytical and aesthetic appreciation in landscape design. Their role in landscape design is usually limited to simulating the context in which a project is inserted by replacing the existing site.
A common application of reconstructed 3D models in landscape design is to visualize the site and insert projects that do not yet exist, similar to visualizations made with Computer-Aided Design in architecture.
74The purpose of such artists' impressions is to generate convincing images that allow the project to be favorably communicated to the public or to stakeholders.
75The synthetic images are produced with computer rendering, which is the process of synthesizing an image from a digital 3D model. Computer rendering makes it possible to mimic photo-realism,
76even when the exact form of the existing site and context is only imitated and not fully reconstructed. Sophisticated visualizations resort to implicit geometry by using scripted plant distributions, generated building forms and swept surfaces.
77Until implicit geometries are dissolved, they depend on specific software, which usually makes the 3D scene incompatible with other computer programs.
Alternatively, synthetic images are made with the diorama technique using a partially modeled scene supplemented with cut-out pictures.
78Such partial 3D models are built ad
74 Giddings and Horne, Artists’ Impressions in Architectural Design, 175–200.
75 Sheppard, “Guidance for Crystal Ball Gazers.”
76 Kingery-Page and Hahn, “The Aesthetics of Digital Representation”; Kullmann, “Hyper-Realism and Loose- Reality.”
77 Ensz, Storti, and Ganter, “Implicit Methods for Geometry Creation.”
78 Cantrell and Yates, Modeling the Environment, 36–44.
Models for artists’
impressions
hoc for the selected view and tend to have a decreasing level of detail from foreground to background. In other words, these models do not offer any transscalar potential to designers. The diorama technique helps save time in modeling and rendering, minimizing computational requirements, and addressing sites with missing survey data. Once the computer rendering is done, the partial model has served its purpose and is no longer needed.
Most current modeling methods for landscape design make limited use of 3D models, in a process to create “looks-like” visualizations instead of modeling the real composition. One reason is the disjunction between planar design approaches and the spatial dimension of the environment. A project developed on maps and planar drawings has limited knowledge of the spatial context. 3D modeling is then used to produce an artist’s impression that has limited spatial meaning and reduces the spatial development to a final effort of visualization, often outsourced to 3D modeling specialists. A second reason for the partial use of modeling is found in the technical challenge to replicate the complexity of the landscape. Dynamic systems, changes over time at various scales and the magnitude of landscape models meet limits for their representation in digital models. This imposes an abstraction of the visual realism and the physical laws that digital models can include.
79Despite the efforts to create a precise representation of the landscape, the documentation of the landscape form remains limited and raises questions about how to grasp the complex dimension of the environment. In landscape design practice, site documentation is collected to inform the design process.
80Designers record pictures, videos and sometimes sound with cameras, sound recorders or a drone during a site visit.
The actual survey of the terrain, instead, is carried out by professional surveyors trained with GPS land measuring instruments, who then produce a cadaster with the essential heights, distances and quotes requested by the designer. The rest of the available site documentation is usually surveyed and processed by independent or national agencies using remote-sensing techniques. The documentation is provided in processed formats, such as contour lines and GIS maps, and offers limited information of the three- dimensional form of the site. For this reason, current literature still proposes sketches and hand drawings as a means to better represent landscape features such as embankments, slopes, terraces, groves and meadows.
811.3.3. Measuring the form with laser-scanning
In research fields related to the physical form of the landscape such as forestry, archaeology, geomorphology and landscape planning, various data sources support a scientific and quantifiable investigation. Most of these disciplines rely on GIS to store, analyze and
79 Ervin, “Digital Landscape Modeling and Visualization,” May 25, 2001, 57–58.
80 Sharky, Thinking about Landscape Architecture, 48–50.
81 e.g., Dee, Form and Fabric in Landscape Architecture; Loidl and Bernard, Opening Spaces; Sullivan,
“Observation and the Analytical Representation of Space.”
Limitations of 3D visualization
Practice of site documentation
manage information on geographic locations. Hydrological modeling, cartographic modeling and map overlay allow the production of single-factor maps for analysis. In the late 90s, scientific investigations started to implement laser-scanning technology, or Light Detection and Ranging (LiDAR), for their need of more precise geospatial data of the environment. This technology has developed to become one of the most accurate remote sensing methods for large-scale data acquisition. Laser-scanning overcomes limitations of photogrammetric methods by creating precise digital terrain models in occluded areas, using waveforms or classification filters.
82Laser scan data is collected through the return of optical surface measures. The measured relation between physical objects and their digital counterpart is crucial for working with the geometry of the environment.
The laser scan data is stored in lists of XYZ coordinates that can be filtered to analyze the form of objects such as tree canopy, terrain or vegetation patterns. The measured form of shape, patterns and irregularities provide a base for analysis in various disciplines. The 3D-explicit data contained in laser-scanned profiles can be used for inventory measurement, canopy characterization and assessment of physical properties in forest science;
83for biodiversity, biomass and carbon storage analysis in ecology;
84and for mass movements detection, hazard assessment and landslide monitoring in earth science,
85to name a few. Thanks to the capacity to collect data essential to landscape management and planning, laser-scanning technology is now widely applied in geospatial disciplines. For this reason, laser scan data is being collected at city and country levels and openly distributed by institutes throughout the world, to develop research and gain precise information of the environment.
86The growing use of laser-scanning in all geospatial disciplines indicates that data is becoming a new common ground for any application that relies on analyzing the physical form of the landscape. The analyses are useful to investigate the development of landscapes; however, they are not yet integrated into the process of shaping them.
Laser scan data is generally perceived as raw data and needs to be processed for analytical, modeling or fabrication purposes. The data is processed into standard geometry formats for end-users, such as CAD drawings with building footprints and terrain contour
82 Liu, “Airborne LiDAR for DEM Generation”; Meng, Currit, and Zhao, “Ground Filtering Algorithms for Airborne LiDAR Data.”
83 Cabo et al., “Automatic Dendrometry”; Dassot, Constant, and Fournier, “The Use of Terrestrial LiDAR Technology in Forest Science”; Wulder et al., “LiDAR Sampling for Large-Area Forest Characterization.”
84 Bergen et al., “Remote Sensing of Vegetation 3-D Structure for Biodiversity and Habitat”; Popescu,
“Estimating Biomass of Individual Pine Trees Using Airborne LiDAR”; Schreyer et al., “Using Airborne LiDAR and QuickBird Data for Modelling Urban Tree Carbon Storage and Its Distribution—A Case Study of Berlin.”
85 Jaboyedoff et al., “Use of LiDAR in Landslide Investigations.”
86 Examples include the Netherlands eScience Center that made countrywide LiDAR accessible on an online platform (Martinez 2015), and the University of the Philippines that is collecting and classifying Open- LiDAR to map flood hazard on the archipelago (Tupas 2016). Automated detection allows the processing of laser-scanned models by running biomass measurements, building reconstruction or flood simulation.
Laser-scanning for remote-sensing
Processing laser scan data