Integrated Power Generation Solutions
Mitsubishi Hitachi Power Systems Europe supplies up-to-date, efficient products. We construct most modern power plants.
And we deliver reliable and cost-effective service solutions.
Our green technologies – in energy storage and biomass, for instance – are examples for our innovation capabilities.
Intelligent power generation solutions require know-how and experience. Mitsubishi Hitachi Power Systems has them both – making us a globally successful energy plant constructor
Joint Forces
Waste Incineration
Capturing of CO
2in Waste Incineration Plants towards Power2Fuel
Torsten Buddenberg and Christian Bergins
1. EU energy policy ...230
2. Electricity market and power-to-x technologies ...231
2.1. Power to methanol ...233
2.2. Carbon footprint in the transport sector ...235
2.3. Economy ...236
3. Methanol based fuels ...238
3.1. Power to fuel versus bio-fuels ...239
3.2. Total environmental and economic impact ...239
4. Summary ...240
5. References ...241 The increasing feed-in of electricity from fluctuating renewable energy sources (RES) can lead to sporadic excess supply of electricity to the grid, causing curtailment of RES plants as well as existing thermal power plants. Industry has developed technology for the storage at MWh scale over short time-periods of hours, which helps to adjust supply and demand, but significant progress towards economical large and long-term storage options is still lacking.
Sector integration, which takes advantage of resources from both the energy sector and industry, coupled with the production of fuels for transport, offers a unique chance to integrate more renewables in the electricity grid and enable sustainable, rapid de- carbonisation of mobility. Fuels like methanol, gasoline, diesel or kerosene derived from hydrogen – produced from low carbon electricity via water electrolysis – and CO2 – captured from industrial emissions – have a lower CO2 footprint and do not compete with food production, unlike bioethanol or biodiesel. This technology offers a new business model to power producers which today are restricted to heat and elec- tricity production and play no role in the green fuel market. The paper presents case studies for carbon intensity, efficiency, and economy of CO2 derived fuels that can be produced by existing technology, while balancing excess capacity from RES and also using must-run capacity from waste incineration. Synergy between thermal power and renewable electricity sector supports decarbonisation of three sectors, electricity, heat and transportation. This new business allows traditional power producers to diversify, in order to attract sufficient revenues in future markets with high RES penetration.
Waste Incineration
1. EU energy policy
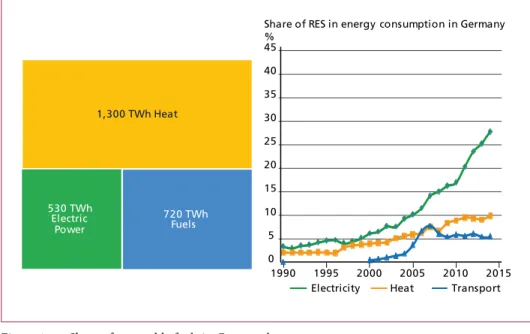
The European Union has set ambitious targets for increased share of renewable energy, energy efficiency and reduction of CO2 emissions to limit the impact of climate change and reduce imports of fossil fuels. Due to significant investments in renewable electricity generation a share of almost 27.5 % [12] of renewable electricity compared to the gross consumption was reached by the EU as a whole in 2014. On the other hand, especially in those countries with large manufacturing industries, it turns out that this success story cannot be easily transferred to other sectors with high energy demand, such as heating or transport. Figure 1 shows the size of the sectors for heat, transport fuel and electricity in Germany and the development of the share of renewable energy in those sectors over the last 25 years [11, 13]. It is obvious that the goal for 35 % renewable electricity in 2020 will be reached easily or even over-fulfilled if the installation of such generation capacities proceeds at current speed.
On the other hand, the share of renewable energy in the heat sector is levelling off at 10 %, well below its 14 % target, and the share of RES in transportation has even de- clined after reaching a maximum of 7 % in 2007. Without tremendous efforts in creating new sources and technologies for these two sectors, the goals of reaching a share of 14 % from RES in the heat sector and 12 % in the transportation sector [8] will not be reached in Germany. At the EU-28 level, the needed progress in heating and transport would have to be unprecedented in order to reach 2020 targets, let alone 2030 targets.
530 TWh Electric
Power
720 TWh Fuels 1,300 TWh Heat
Electricity Heat Transport 0
5 10 15 20 25 30 35 40 45
1990 1995 2000 2005 2010 2015
Share of RES in energy consumption in Germany
%
Figure 1: Share of renewable fuels in Germany’s energy sectors
Sources:
Bundesrepublik Deutschland: Nationaler Aktionsplan für erneuerbare Energie gemäß der Richtlinie 2009/28/EG zur Förderung der Nutzung von Energie aus erneuerbaren Quellen
http://bmwi.de/DE/Themen/Energie/Energiedaten-und-analysen/energiedaten.html http://www.ag-energiebilanzen.de/
Waste Incineration
In the past, the heat sector in Germany experienced high increases in the share of RES, mainly by the implementation of biogas and biomass combined heat and power (CHP) plants, wood and wood pellet heating in private houses, and heat pump applications.
The renewable fuel sector grew primarily with the introduction of bioethanol from maize, sugar cane and sugar beet, and biodiesel from different sources of organic oils.
It is unlikely that the biofuel sector can maintain the growth of the past twenty years going forward, due to the impacts of agricultural methods on food markets and land use.
The EU has recently adopted changes [9, 10] to the Renewable Energy Directive (RED) and Fuel Quality Directive (FQD). The amended directives now include a new cate- gory of renewable fuels from non-biological sources other than biofuels. This category can cover synthetic, electrically derived fuels like hydrogen from water electrolysis or synthetic natural gas (SNG) from such hydrogen and captured CO2, as well as low carbon intensity methanol derived from the combination of hydrogen and CO2. Both the original RED and FQD set ambitious targets on the decarbonisation of the transport sector. On the one hand, member states are each required to have at least ten percent of their transport fuels come from renewable sources by 2020 according to the RED;
the amended RED version made it possible for renewable fuels from non-biological sources as well as carbon capture and utilisation (CCU) using renewable energy sources to count twice their energy content towards this target.
Similarly, technical solutions that are able to provide lower carbon intensity heat are missing, especially in industries where steam and heat at high Megawatt-scale is needed for chemical production, pulp and paper, etc. It is only in the low temperature range heat supply for public heating grids that some efforts are underway. Some northern European countries are switching such CHP plants to biomass combustion, primarily with wood pellets which often have to be imported due to the lack of local resources – for example, in Denmark and the Netherlands.
2. Electricity market and power-to-x technologies
Due to increased supply of zero marginal cost renewable electricity and regulations favouring the supply of such energy to the grid, the wholesale day-ahead market price of electricity has fallen below 30 EUR/MWh over the past five years in several European markets. The mismatch between demand for electricity and the supply of renewable electricity increases the pressure on regulators and generators to expand transmission grids to transport electricity from regions with supply to regions with demand or provide energy storage to shift the supply of renewable energy from hours with excess supply to hours with excess demand.
However, both technology measures are hindered by permitting procedures or suffer from high capital cost. Low market prices of electricity and low spreads between peak demand and off-peak supply will not support installation of costly storage systems.
This compounds the problem of increasing the supply from RES, as it pushes down the market price of electricity and increases the amount of electricity which needs to be
Waste Incineration
curtailed as the transmission system or storage technology is unable to keep up with increasing supply. Unless the demand for electricity can also be controlled, to prevent curtailing, the cost of providing electricity will rise as the excess capacity goes to waste.
By the same dynamic, thermal power plants are facing significant reduction of full operational hours and a loss of income due to lost sales, higher cost for start-up fuel and more wear and tear from cycling operation while must-run plants like waste incinerators face reduced income from electricity sales due to falling prices. Since the reliability of thermal power plants is not matched by intermittent sources, several EU Member States are considering capacity remuneration markets, where thermal power plants are paid to remain connected to the grid, but only few such systems have been implemented. Governments are still searching for solutions, especially to limit the continuously rising cost of production.
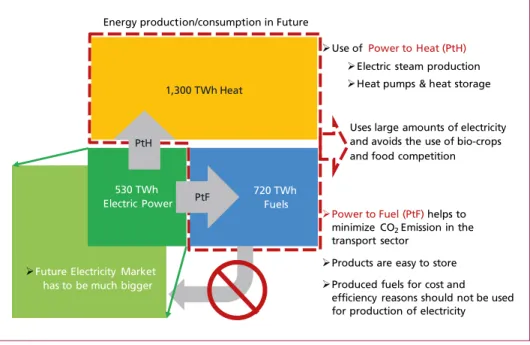
A cross-sectoral energy storage approach via power-to-x, especially power to heat (PtH) and power to fuel (PtF) would allow a higher share of electrification of the heat and fuel sector via the use of surplus electricity production that is otherwise curtailed.
This concept is presented in Figure 2.
Energy production/consumption in Future
530 TWh Electric Power
720 TWh Fuels 1,300 TWh Heat
PtF PtH
Use of Power to Heat (PtH) Electric steam production Heat pumps & heat storage
Power to Fuel (PtF) helps to minimize CO2Emission in the transport sector
Products are easy to store Produced fuels for cost and efficiency reasons should not be used for production of electricity
Future Electricity Market has to be much bigger
Uses large amounts of electricity and avoids the use of bio-crops and food competition
Figure 2: Cross sectoral energy storage to improve the utilisation of overcapacities of renewable electricity and transfer it to heat and fuel sector to support the decarbonisation of these sectors.
While electric resistance heating – also in the megawatt scale – is already state-of- the-art and many installations within heat grids and power plants have already been done in several EU member states, wide-spread application can only happen if the business case is proven, as electricity prices higher than 10 EUR/MWh will reduce the number of operating hours. The higher OPEX is also not compensated by low CAPEX.
Waste Incineration
Also, implementing a low efficiency process contradicts prevailing EU Directives which mandate further efficiency increase.
Thus, CHP and heat pumps represent the most effective technologies for heat production.
Heat pumps are now available [5, 6] to provide steam in the range of 2 to 20 bar for indus- trial applications, from waste heat in the temperature range of 60 to 140 °C. In the long term, this can reduce the operating cost of several industries and provide low carbon heat quite efficiently. CHP plants can also operate flexibly to balance the production of thermal power in response to fluctuating renewable electricity. As we will demonstrate, heat pump technology can effectively support the PtF technology in combination with CHP systems.
For the transport sector, PtF is the most effective way to overcome the environmental chal- lenges presented by growing the supply of biofuels, as noted above. Several PtF systems exist as presented by the authors before in [3, 15]. The present work focuses on the production of low carbon intensity methanol fuel from electrically derived hydrogen combined with CO2 captured from flue gases. In the following the benefits of the combination of waste incinerators with PtF, especially Power to methanol (PtM) technology is shown. The pro- cess combination is analysed from the point of view of energy balance, carbon footprint, economic viability, and legal or regulatory conditions.
2.1. Power to methanol
Methanol can be produced from hydrogen and CO2 via direct catalytic synthesis as de- monstrated in Carbon Recycling International’s George Olah Plant in Iceland.
A PtM plant can be built optimally in or next to an existing industrial operation, such as a power plant or industrial site, where a connection to the high voltage grid and transport infrastructure for the products already exists. In addition to the grid infrastructure, a source of relatively concentrated CO2 needs to be available. The process for the conversion was described before [3, 14, 15] and can reach conversion efficiencies of > 60 % from electricity to methanol lower heating value in large industrial scale.
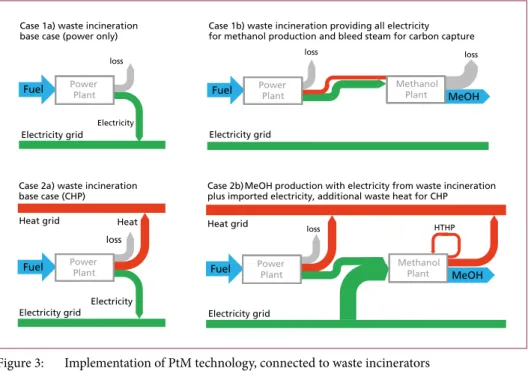
In the following, we will describe two cases of possible implementations of the PtM techno- logy in waste incineration plants. The waste incinerator is designed for 103 MWth and has 32.9 MWel power output. In case 1, a plant is considered which only produces electricity, in case 2 additional 55 MWth heat are extracted for a heating grid. The technical setup of the two cases is shown in Figure 3 and for case 2b more detailed flow chart is shown in Figure 4.
In case 1 all the waste incinerators electricity is considered to be consumed by the methanol production. Any additional steam demand is taken from bleed steam from the turbine.
This way a methanol production capacity of 27 kt/year during 8,000 full load operation hours is reached.
In case 2 the methanol production is increased to 100 kt/year to increase the effects of eco- nomy of scale. As additional heat supply to the heating grid is possible, a high temperature heat pump (HTHP) [6] is installed to recover waste heat from the water electrolyser and serve the methanol production plus an additional heat export of 17 MW while 108 MW of electricity have to be imported in addition to the electricity from the waste incinerator.
Waste Incineration
The main consumer of electricity in both cases is the electrolyser with 4.4 kWh(AC) per Nm³ of hydrogen. The steam demand for carbon capture is 2,600 kJ/kg of captured CO2. The total specific energy demand for case one is 9.74 kWhel per tonne of MeOH and the steam demand is 1.01 kWhth per tonne of MeOH. In case 2 the specific demand
Fuel
Electricity grid loss
Fuel
Electricity grid loss Case 1a) waste incineration
base case (power only) Case 1b) waste incineration providing all electricity for methanol production and bleed steam for carbon capture
Fuel
Electricity grid
Heat grid loss
Case 2b) MeOH production with electricity from waste incineration plus imported electricity, additional waste heat for CHP
Power
Plant Power
Plant MeOH
loss
Methanol Plant
MeOH Methanol
Plant Power
Plant Electricity
Fuel
Electricity grid Heat grid
loss Case 2a) waste incineration base case (CHP)
Power Plant
Heat
Electricity
HTHP
Figure 3: Implementation of PtM technology, connected to waste incinerators
G
H2
Water electrolysis
CO2
Methanol synthesis
Methanol distillation Methanol H2O Transmission
system
Heat consumers
Water Gas (CO2lean)
Gas (CO2rich)
low carbon O2
Heat storage
HTHP (high temperature heat pump)
Post combustion CO2capture Fuel Flue gas
Electric Power Pel
Thermal Power Qth
Heat Recovery Qth
Industry (Heat consumer)
Figure 4: CHP plant (waste incineration) with integrated PtM plant (Case 2b)
Waste Incineration
of electricity is 10.1 kWhel per tonne of MeOH. The conversion efficiency from used and not produced electricity (bleed steam) towards methanol (LHV) is about 55 percent for both cases. In case 2b the efficiency from waste heating value plus imported electricity towards heat and methanol fuel is 67 percent.
2.2. Carbon footprint in the transport sector
Due to the biogenic content of waste also the product of the fuel production easily can fulfil a bio-quota in the biofuel sector. The carbon footprint reduction anyhow depends on the location of the waste incinerator. As the carbon footprint of the waste is usually too high to demonstrate a total CO2 emission reduction compared to gasoline and as also such direct use of electricity would need a de-coupling of the incineration plant from the grid only one certification pathway is applicable: According to current EU/EEA directives the certification of a renewable fuel produced from electricity would take into account the CO2 emission factor for the respective country’s electrical energy mix. Even not exported electricity from a waste incinerator would be seen as imported electricity for the fuel production.
0 10 20 30 40 50 60 70 80 90 100 0
10 20 30 40 50 60 70 80 90
0 50 100 150 200
55 % conversion efficiency CO2
footprint of MeOH gCo2eq/MJ
CO2 footprint reduction
% (Reference 94.1 g/MJ)
CO2 emission from electricity g CO2/kWh
gCO2eq
kWh Iceland 0,207 Mozambique 0,493 Norway 2,458 Nepal 3,376 Switzerland 3,421 Zambia 3,549 Democratic Republic of Congo 4,609 Albania 10,133 Sweden 24,733 Tajikistan 25,737 Angola 42,117 Costa Rica 70,762 France 75,927 Georgia 99,045 Kyrgyzstan 101,392 Brazil 110,151 Ethiopia 132,020 Lithuania 135,098 New Zealand 214,553 Japan 467,380 United States 589,156 Germany 717,712 People‘s Republic of China
and Hong Kong China 1,081,061 Figure 5: a) Carbon footprint of methanol fuel produced from electric power and captured CO2
with 55 % conversion efficiency, b) CO2 equivalent of electricity end use in selected countries
Source: Brander, M.; Sood, A.; Wylie, C.; Haughton, A.; Lovell, J.: Technical Paper: Electricity-specific emission factors for grid electricity. Ecometrica, Emissionfactors.com, 2011
a) b)
Waste Incineration
Only few EU Member States have a grid emission factor which allows the producer to directly produce fuels with a CO2 footprint much lower than that of fossil fuels. Figure 5a shows the CO2 footprint of methanol in [g CO2eq/MJ] assuming different electricity sources.
Total CO2 reduction based on these reference values is calculated considering the fossil fuel baseline value 94.1 g CO2eq/MJ. Figure 5b shows the footprint of methanol from grid electricity based on the grid emission factor in selected countries (methane emissions are included with a factor of 25 and nitrons oxide with a factor of 298) with data from [4].
An arbitrary criterion of 60 % carbon footprint reduction (here just to compare with the maximum allowed CO2 footprint of biofuels from new installations and ensure compe- titive production) is fulfilled only in Sweden, France, Iceland and Norway, which are all members of the European Economic Area (EEA; comprising the 28 EU States in addition to Iceland, Norway and Lichtenstein). Switzerland, which is not part of the EEA, also fulfils this criterion. Only a handful of countries outside Europe would be included on this list.
It is obvious that the higher the electricity CO2 footprint, the higher the CO2 footprint is for the methanol (MeOH) final product. To reach low CO2 footprints comparable to biofuels – which should ensure also competitiveness by earning a premium price for the product – the process requires electricity with a carbon footprint below about 75 g CO2eq per kWh.
2.3. Economy
The advantages of PtM technology integrated in must-run plants like waste incinerators are 1. the increased ability to support grid control services,
2. the ability to (indirectly) absorb high amounts of renewable electricity, which otherwise would have to be curtailed or met with investments in new grid infrastructure and energy storage, and
3. the possibility to transfer electricity to the fuel market and supply low carbon fuels to the transport sector, without any of the adverse effects of traditional biofuels.
Today, development of business models based on these value drivers is hindered mainly by gaps in regulations, which will have to be filled in order to fully exploit the potential of PtM technology. Some of the gaps are:
1. PtM installations in most EU countries would count as end-users of the energy and thus will carry user charges implemented to compensate for the cost of renewable feed-in tariffs – like the EEG payment in Germany.
2. Technology which supports integration of intermittent energy with the current grid infrastructure is not compensated financially except for some specific regulation like compensation for demand-site management in Germany.
3. Compliance with mandatory reduction of CO2 in the transport fuel cannot be de- monstrated by utilising existing guarantees of origin (incl. the virtual power plant connection), which prove that a unit of renewable energy was generated by a designated supplier and used by a designated customer. All grid connected plants are required to simply report the average CO2 footprint of the national grid.
Waste Incineration
These gaps also limit the development of power systems as they prevent market partici- pants from taking advantage of synergies which would arise from the combination of PtM technology and traditional power plant infrastructure. In the following a simplified cost calculation is performed to show the impacts on profitability of such installations for a base case. As the deployment of PtM technology is just starting, this should be seen as a blueprint for case by case investigations for specific locations and applications.
Leaving out for simplicity additional revenue streams from the electricity marked by providing grid services and demand site management, only the energy cost and re- venue by the products heat, electricity and methanol fuel have to be considered. The fuel cost (waste) is considered as zero and only the new installations for the methanol plant as well as some fixed operational cost are considered to compare the cases with and without PtM retrofit. We assume a fixed price of 25 EUR/MWh for electricity and 15 EUR/MWh for heat. Additionally we calculated 12 EUR/t for the other variable cost (catalyst, solvent, etc.), one percent of the original investment for maintenance as well as 0.7 Mio. EUR/year for fixed operating costs (such as payroll for personnel). The finan- cing consist of 30 % equity with 8 % interest rate and 70 % debt with 2 % interest rate.
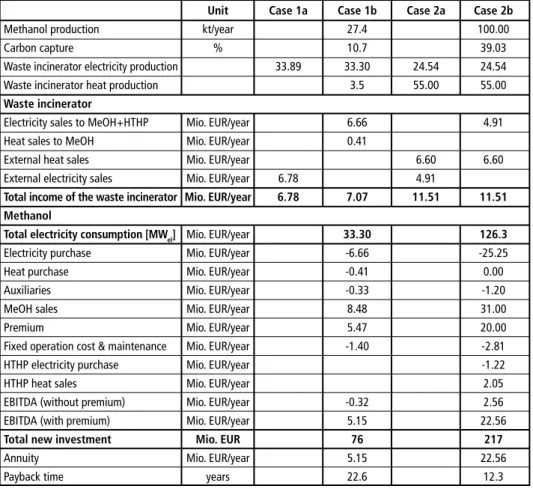
Table 1: Cost estimation and ROI for the implementation of PtM in a waste incinerator Unit Case 1a Case 1b Case 2a Case 2b Methanol production kt/year 27.4 100.00
Carbon capture % 10.7 39.03
Waste incinerator electricity production 33.89 33.30 24.54 24.54 Waste incinerator heat production 3.5 55.00 55.00 Waste incinerator
Electricity sales to MeOH+HTHP Mio. EUR/year 6.66 4.91 Heat sales to MeOH Mio. EUR/year 0.41 External heat sales Mio. EUR/year 6.60 6.60 External electricity sales Mio. EUR/year 6.78 4.91 Total income of the waste incinerator Mio. EUR/year 6.78 7.07 11.51 11.51 Methanol
Total electricity consumption [MWel] Mio. EUR/year 33.30 126.3 Electricity purchase Mio. EUR/year -6.66 -25.25 Heat purchase Mio. EUR/year -0.41 0.00 Auxiliaries Mio. EUR/year -0.33 -1.20 MeOH sales Mio. EUR/year 8.48 31.00 Premium Mio. EUR/year 5.47 20.00 Fixed operation cost & maintenance Mio. EUR/year -1.40 -2.81 HTHP electricity purchase Mio. EUR/year -1.22 HTHP heat sales Mio. EUR/year 2.05 EBITDA (without premium) Mio. EUR/year -0.32 2.56 EBITDA (with premium) Mio. EUR/year 5.15 22.56
Total new investment Mio. EUR 76 217
Annuity Mio. EUR/year 5.15 22.56
Payback time years 22.6 12.3
Waste Incineration
The methanol price was between 260 and 450 EUR/t in the past decade and we calculated 310 EUR/t as an average. Additional income from O2 sales are not considered but own use and O2 enriched firing could be a beneficial application in waste incinerators.
The financial data of the simplified calculation for the two cases is given in Table 1.
It is shown that both cases only have minor effects on the income stream of the waste incinerator. The EBITDA of the methanol unit (calculated separately by intention) strongly depends on the real value of the methanol. When only the ten year average price of 310 EUR/tonne is applied, a negative EBITDA in Case 1b and a small, positive EBITDA in case two results. In both cases this is not sufficient to enable an investment.
So additional income streams from a) grid services or b) a premium price for methanol have to be considered.
The largest possible premium (max. added value) for low carbon methanol can be derived from the 470 EUR/t CO2 penalty [7] which would have to be paid by fuel distri- buters in Germany which do not fulfil the CO2 reduction obligation for transport fuels.
The premium then has to be calculated case by case from the specific CO2 reduction compared to the future fossil fuel baseline value of 94.1 g CO2eq/MJ. As an estimate for the real premium payment we assume an (arbitrary) fraction of the above mentioned penalty in the range of 150 to 200 EUR/t of CO2 avoided and 30 to 50 gCO2/MJ as carbon Table 2: Price premium derived from CO2 premium and fuel carbon footprint Carbon CO2 premium
footprint EUR/t
of product 50 100 150 200 250 fuel Price-premium gCO2/MJ EUR/t MeOH 10 83.7 167.4 251.0 334.7 418.4 20 73.7 147.5 221.2 294.9 368.6 30 63.8 127.6 191.3 255.1 318.9 40 53.8 107.7 161.5 215.3 269.1 50 43.9 87.8 131.6 175.5 219.4 60 33.9 67.9 101.8 135.7 169.6 70 24.0 48.0 71.9 95.9 119.9 80 14.0 28.1 42.1 56.1 70.1 90 4.1 8.2 12.2 16.3 20.4
footprint of the product fuel which easily can be reached with grid electricity in all countries with less than ~75 gCO2/kWh.
So a premium of 200 EUR/t of methanol is derived, Table 2. Adding this premi- um price, which is in good accordance with premium prices of low carbon bio- ethanol or biodiesel in the EU markets, to the income, both EBITDA numbers get reasonably higher. The pay-off time which is back-calculated from this net income and the investment is 23 years for the small installation (case 1b) and 13 years for the larger one (case 2b). These examples just should show the influence of the low carbon premium and the plant size.
3. Methanol based fuels
Just a short overview of direct methanol utilisation and possibilities for further pro- cessing towards drop-in fuels should be provided here. More specific information and more literature is provided by [2].
The utilisation of methanol within the transportation sector is extensive and continuous- ly growing. Today 27 % of global methanol production is utilised for transportation:
12 % for fuel blending, 12 % for MTBE production and 3 % for biodiesel production.
Waste Incineration
There are many methanol fuel initiatives around the world. In Europe, 3 % blend of methanol in gasoline is standardised for SP95 gasoline (DIN EN228). Some countries also incentivise blending or use of low carbon methanol in biodiesel production, and in the UK no road taxes are applied to M95 (95 % methanol with 5 % of water). Australia has a similar initiative with reduced road taxes for methanol. In Sweden, unblended methanol is also utilised as zero sulphur marine fuel. China has sold a 15 % blend of methanol in gasoline (M15) as automobile fuel in several provinces and fleet tested 100 % methanol (M100) in eleven major cities. In Iceland, Carbon Recycling Interna- tional has conducted fleet testing of at 50:50 blend of methanol and gasoline (M50) in flexible fuel vehicles from Ford and is now testing M100 with vehicles from Chinese automobile manufacturer Geely.
In China, the economic and environmental advantages (high efficiency engines, lower emissions) are already exploited by a fast growing fleet of M100 cars and the imple- mentation of necessary infrastructure.
A second pathway for the fast introduction of low carbon fuel derived from methanol is through conversion of methanol to oxygenates like dimethyl-ether (DME) and oxy- methylene ethers (OMEs) [17] or even directly to gasoline (methanol-to-gasoline, MtG [16, 18]).
3.1. Power to fuel versus bio-fuels
Emissions during fuel combustion and the carbon footprint of the fuel are two im- portant impacts. A third important criterion is the reduction in (farm) land use. RES electricity from hydropower in mountain areas (such as in Iceland, Norway, Switzerland or Austria), wind offshore, rooftop PV, virtually have no land demand at all. One can also easily calculate and compare the farm land use for PV based synthetic fuels and biofuels: in Brazil and Germany the land use to produce one MWh of fuel per year is 268 and 539 m2/(MWh/year), respectively. If electricity would be produced in those countries the land demand to produce one MWh/year would be 15 m2 in Brazil and 27 m2 in Germany. The numbers differ by two orders of magnitude for biofuels and synthetic fuel as photosynthesis has an efficiency of much less than one percent and PV reaches values of over 14 % today. The factor of two between Germany and Brazil obviously comes from different solar radiation intensity. This shows that a synthetic fuel approach will overcome today’s barriers of food-competition in the biofuel sector.
For more details on the calculation see [1].
3.2. Total environmental and economic impact
There are several aspects of environmental protection and economic benefits associated with PtM technology both in the production area as well as in the utilisation which were described earlier. The next section provides more details on the following:
• Carbon dioxide from different sources is captured and reused. When using low carbon energy, fossil fuels are replaced in the transport sector and the respective emissions from exploration, transport and processing are avoided as well as fossil
Waste Incineration
fuel combustion emissions. Carbon is used mainly from immanent emission sour- ces which are difficult to avoid and this carbon is then recycled to be used a second time (the essence of the concept of carbon capture and utilisation).
• Flue gas would be cleaned towards today’s technological limits to avoid solvent and catalyst degradation in the downstream methanol process. In this way, nitrogen oxides, sulphur oxides, dust emissions and emissions of trace elements are reduced further.
• Emissions from transportation are reduced because of the inherent properties of methanol as mentioned before: if higher blends of methanol or M100 are used, several types of emissions in the transport sector can be reduced, or through the production synthetic drop-in fuels with lower shares of aromatic compounds which reduce emissions of soot.
• Significantly less land is needed for production of methanol from electricity com- pared to biofuels. This releases agricultural land for the production of food or forestry.
• Fuel produced locally from low carbon electricity drastically reduces emissions from the fuel transportation and distribution.
• Using local excess electricity sources reduces import dependency.
• Absorbing excess electricity or providing reserve power by reducing the production rate offers a low cost measure for grid stabilisation and avoids enormous investments in grid infrastructure on all voltage levels or investments in other forms of energy storage.
• Methanol is not only a fuel but provides an alternative for all chemical synthesis pathways.
4. Summary
Methanol production from low carbon electricity provides low carbon fuel to the transport sector immediately, while reducing other emissions from transportation as well. Waste incinerators and other must-run plants are a natural partner for this tech- nology. Methanol production allows carbon reduction and generates a new income stream for the operators, supporting the economics of must-run power plants in an environment where income from electricity production is no longer sufficient. The necessary back-up function and operation of these power plants (in the case of waste incineration, landfill gas or industrial waste gas disposal) would otherwise have to be subsidised in the future.
As of today, there is no solution which is more economical than PtM, which both can increases the share of renewable energy in the transport sector and provides a way to operate power plants flexibly by absorbing surplus electricity.
Waste Incineration
The regulatory side has to evolve in order to allow for these technologies to reach the market. This does not mean that there is any need for new subsidies, neither for fuel production, nor to keep power plants in operation. The rules of the electricity market simply have to take into account and recognise the positive impact of PtM plants on operation of an electricity grid, which needs to accommodate increased supply of generation of electricity from variable sources. This requires transparent rules on how conversion plants can prove that they have operated with low carbon electricity. Plants that act as energy storage and convert electricity into energy for transport should not be penalised by high grid fees or feed in tariffs levied on generic end-users which are not providing the same benefits to the system. On the fuel side, certification of carbon footprint via proof-of-origin via virtual power plants has to be enacted and the positive contribution to the environment should also be recognised consequently.
5. References
[1] Bergins, C.; Tran, K.-C.; Buddenberg, T.; Stefánsson, B.; Koytsoumpa, E.-I.; Duarte, M. J.: Power to fuel as a sustainable business model for cross-sectoral energy storage in industry and power plants. POWER-GEN Europe 2016, Milan, June 21 to 23, 2016
[2] Bergins, C.; Tran, K. C.; Fox, E. L.; Wuebben, P.: Commercialization of Low Carbon Methanol.
ATZextra worldwide, Volume 21, Supplement 11, January 2016, pp. 22-25
[3] Bergins, C.; Tran, K.-C.; Koytsoumpa, E.-I.; Kakaras, E.; Buddenberg, T.; Sigurbjörnsson, Ó.:
Power to Methanol Solutions for Flexible and Sustainable Operations in Power and Process Industries. POWER-GEN Europe 2015, Amsterdam, Netherlands, June 9 to 11, 2015
[4] Brander, M.; Sood, A.; Wylie, C.; Haughton, A.; Lovell, J.: Technical Paper: Electricity-specific emission factors for grid electricity. Ecometrica, Emissionfactors.com, 2011
[5] Buddenberg, T.; Bergins, C.; Agraniotis, M.: Hochtemperaturwärmepumpe als Baustein der industriellen KWK und Fernwärmekonzepten als Verknüpfung zu Energiespeicherung und Power to Heat. Jahrestreffen der ProcessNet-Fachgruppen Energieverfahrenstechnik und Ab- fallbehandlung und Wertstoffrückgewinnung, Dechema-Haus, Frankfurt, February 23 to 24, 2016
[6] Buddenberg, T.; Bergins, C.; Waldburg, S.: Future prospects of industrial combined heat and power in Europe with high penetration of renewable energy sources, EuroHeat&Power English Edition Vol. 13 II/2016, pp. 28-31
[7] Bundes-Immissionsschutzgesetz in der Fassung der Bekanntmachung vom 17. Mai 2013 (BGBl.
I S. 1274), das zuletzt durch Artikel 76 der Verordnung vom August 31, 2015 (BGBl. I S. 1474) geändert worden ist
[8] Bundesrepublik Deutschland: Nationaler Aktionsplan für erneuerbare Energie gemäß der Richt- linie 2009/28/EG zur Förderung der Nutzung von Energie aus erneuerbaren Quellen
[9] Council Directive (EU) 2015/652 of 20 April 2015 laying down calculation methods and re- porting requirements pursuant to Directive 98/70/EC of the European Parliament and of the Council relating to the quality of petrol and diesel fuels
[10] Directive (EU) 2015/1513 of September 9, 2015 amending Directive 98/70/EC relating to the quality of petrol and diesel fuels and amending Directive 2009/28/EC on the promotion of the use of energy from renewable sources
[11] http://bmwi.de/DE/Themen/Energie/Energiedaten-und-analysen/energiedaten.html [12] http://ec.europa.eu/eurostat/data/database
Waste Incineration
[13] http://www.ag-energiebilanzen.de/
[14] Karpf, R.; Bergins, C.: CO2-Abscheidung bei der Abfallverbrennung – CO2 als Wertstoff, eine Symbiose für die Umwelt? (CO2 separation in waste incineration, CO2 as resource, a symbiosis for the environment). Müll und Abfall 5/2016, pp. 228-239; http://www.MUELLundABFALL.
de/MA.05.2016.228
[15] Koytsoumpa, E.-I.; Bergins, C.; Buddenberg, T.; Wu, S.; Sigurbjörnsson, Ó.; Tran, K.C.; Kakaras, E.: The Challenge of Energy Storage in Europe: Focus on Power to Fuel, J. Energy Resour. Technol, (2016); 138 (4), doi: 10.1115/1.4032544
[16] Kuschel, M.: Production of high octane gasoline from synthesis gas on a new route. International Pittsburgh Coal Conference; Beijing, CHINA; September 16 to 19, 2013
[17] Maus, W.; Jacob, E.; Härtl, M.; Seidenspinner, P.; Wachtmeister, G.: Synthetic Fuels – OME1:
A Potentially Sustainable Diesel Fuel, 35. Internat. Wiener Motorensymposium, Fortschritt- Berichte VDI Reihe 12, Nr. 777, Bd.1, 2014, pp. 325-347
[18] Stahlschmidt, R.; Seifert, P.; Kuschel, M.; Meyer, B.: Concepts for XtL routes based on a techni- cal proven gasoline synthesis process. 6th International Freiberg Conference on IGCC & XtL Technologies, Coal Conversion and Syngas, Dresden/Radebeul, May 19 to 22, 2014
Pressure Parts for Professionals
Steam Generators from 30 t / h to 3.000 t / h
Burners for Coal, Gas, Oil, Biomass
Components:
Membrane Walls, Coils, Headers, Attemperators, Separators
www.mdkb.de
Steam Generators from 30 t / h to 3.000 t / h
Burners for Coal, Gas, Oil, Biomass
Components:
Membrane Walls, Coils, Headers, Attemperators, Separators
www.mdkb.de
Bibliografische Information der Deutschen Nationalbibliothek Die Deutsche Nationalbibliothek verzeichnet diese Publikation in der Deutschen Nationalbibliografie; detaillierte bibliografische Daten sind im Internet über http://dnb.dnb.de abrufbar
Thomé-Kozmiensky, K. J.; Thiel, S.; Thomé-Kozmiensky, E.;
Winter, F.; Juchelková, D. (Eds.): Waste Management, Volume 7 – Waste-to-Energy – ISBN 978-3-944310-37-4 TK Verlag Karl Thomé-Kozmiensky
Copyright: Elisabeth Thomé-Kozmiensky, M.Sc., Dr.-Ing. Stephanie Thiel All rights reserved
Publisher: TK Verlag Karl Thomé-Kozmiensky • Neuruppin 2017
Editorial office: Dr.-Ing. Stephanie Thiel, Elisabeth Thomé-Kozmiensky, M. Sc.
Janin Burbott-Seidel and Claudia Naumann-Deppe
Layout: Sandra Peters, Anne Kuhlo, Ginette Teske, Claudia Naumann-Deppe, Janin Burbott-Seidel, Gabi Spiegel and Cordula Müller
Printing: Universal Medien GmbH, Munich
This work is protected by copyright. The rights founded by this, particularly those of translation, reprinting, lecturing, extraction of illustrations and tables, broadcasting, micro- filming or reproduction by other means and storing in a retrieval system, remain reserved, even for exploitation only of excerpts. Reproduction of this work or of part of this work, also in individual cases, is only permissible within the limits of the legal provisions of the copyright law of the Federal Republic of Germany from 9 September 1965 in the currently valid revision. There is a fundamental duty to pay for this. Infringements are subject to the penal provisions of the copyright law.
The repeating of commonly used names, trade names, goods descriptions etc. in this work does not permit, even without specific mention, the assumption that such names are to be considered free under the terms of the law concerning goods descriptions and trade mark protection and can thus be used by anyone.
Should reference be made in this work, directly or indirectly, to laws, regulations or guide- lines, e.g. DIN, VDI, VDE, VGB, or these are quoted from, then the publisher cannot ac- cept any guarantee for correctness, completeness or currency. It is recommended to refer to the complete regulations or guidelines in their currently valid versions if required for ones own work.