IHS Economics Series Working Paper 242
June 2009
Aggregate and Regional Economic Effects of New Railway Infrastructure
Wolfgang Polasek
Wolfgang Schwarzbauer
Richard Sellner
Impressum Author(s):
Wolfgang Polasek, Wolfgang Schwarzbauer, Richard Sellner Title:
Aggregate and Regional Economic Effects of New Railway Infrastructure ISSN: Unspecified
2009 Institut für Höhere Studien - Institute for Advanced Studies (IHS) Josefstädter Straße 39, A-1080 Wien
E-Mail: o ce@ihs.ac.atffi Web: ww w .ihs.ac. a t
All IHS Working Papers are available online: http://irihs. ihs. ac.at/view/ihs_series/
This paper is available for download without charge at:
https://irihs.ihs.ac.at/id/eprint/1926/
Aggregate and Regional Economic Effects of New Railway Infrastructure
Wolfgang Polasek, Wolfgang Schwarzbauer, Richard Sellner
242
Reihe Ökonomie
Economics Series
242 Reihe Ökonomie Economics Series
Aggregate and Regional Economic Effects of New Railway Infrastructure
Wolfgang Polasek, Wolfgang Schwarzbauer, Richard Sellner June 2009
Institut für Höhere Studien (IHS), Wien
Institute for Advanced Studies, Vienna
Contact:
Wolfgang Polasek
Department of Economics and Finance Stumpergasse 56
1060 Vienna, Austria
: +43/1/599 91-155 email: polasek@ihs.ac.at Wolfgang Schwarzbauer
Department of Economics and Finance Stumpergasse 56
1060 Vienna, Austria email: schwarzba@ihs.ac.at Richard Sellner
Department of Economics and Finance Stumpergasse 56
1060 Vienna, Austria email: sellner@ihs.ac.at
Founded in 1963 by two prominent Austrians living in exile – the sociologist Paul F. Lazarsfeld and the economist Oskar Morgenstern – with the financial support from the Ford Foundation, the Austrian Federal Ministry of Education and the City of Vienna, the Institute for Advanced Studies (IHS) is the first institution for postgraduate education and research in economics and the social sciences in Austria. The Economics Series presents research done at the Department of Economics and Finance and aims to share “work in progress” in a timely way before formal publication. As usual, authors bear full responsibility for the content of their contributions.
Das Institut für Höhere Studien (IHS) wurde im Jahr 1963 von zwei prominenten Exilösterreichern – dem Soziologen Paul F. Lazarsfeld und dem Ökonomen Oskar Morgenstern – mit Hilfe der Ford- Stiftung, des Österreichischen Bundesministeriums für Unterricht und der Stadt Wien gegründet und ist somit die erste nachuniversitäre Lehr- und Forschungsstätte für die Sozial- und Wirtschafts- wissenschaften in Österreich. Die Reihe Ökonomie bietet Einblick in die Forschungsarbeit der Abteilung für Ökonomie und Finanzwirtschaft und verfolgt das Ziel, abteilungsinterne Diskussionsbeiträge einer breiteren fachinternen Öffentlichkeit zugänglich zu machen. Die inhaltliche Verantwortung für die veröffentlichten Beiträge liegt bei den Autoren und Autorinnen.
Abstract
Economists expect positive returns to investments in infrastructure. However a project with higher national returns might have less favourable effects on a regional level than the alternative. Therefore new infrastructure should also be assessed on a regional level, but econom(etr)ic evaluation models are scarce, especially in regional science. This paper proposes new approaches to evaluate infrastructure by a dynamic spatial econometric model that allows long-term predictions. We investigate the regional effects for two Austrian railway projects and show that infrastructure returns are positive on an aggregate and at a regional level but spatial variation can be large.
Keywords
Regional growth convergence, traffic accessibility, infrastructure evaluation, spatial econometrics
JEL Classifications
C31, H43, H54, R11, R12
Contents
Introduction 1 1 The model 3
1.1 Specification of the model ... 4 1.2 Accessibility ... 5 1.3 Data Base ... 8
2 Estimation Results 8 3 Simulation 10
3.1 General simulation results ... 11 3.2 Infrastructure and regional convergence ... 14
Summary 17
References 18
Introduction
Investments in infrastructure is expensive and economists have argued for a long time about measurable economic effects of infrastructure. Aschauer (1989) in- vestigated the effects of public infrastructure following a production function approach and found the social rate of return of public infrastructure to be sub- stantial. It should be noted however that this study was based on national level data, whereas studies conducted on the regional or metropolitan area levels found much smaller effects (compare ECMT, 2000). This may be due to the fact that the regional level effect of improving traffic infrastructure is more or less am- biguous at this level. This can be explained by the New Economic Geography literature, which stresses the role of centrifugal and centripetal forces. An im- provement of infrastructure and therefore a decline in transportation costs will on one hand benefit the firms in a core area by enlarging their market, on the other hand benefit the firms in remoter areas by increasing their competitiveness.
(Krugman, 1991).
The literature on the assessment of improving the infrastructure or building new infrastructure is based on growth accounting approaches (Baum & Kurte, 2001), CGE modelling (compare Broecker et al., 2004, Steininger et al., 2007) as well as econometric modelling (Lall, 2007, Polasek & Schwarzbauer, 2006).
In this paper we follow an econometric approach, as we want to test whether infrastructure improvements will also lead to improvements in economic perfor- mance, measured by GDP, firms and employment. The variable used to identify the improvement in traffic infrastructure is accessibility of regions. Accessibility is considered to be one of the main engines of economic activity, for countries as well as for regions. Surprisingly, there is little empirical evidence linking ac-
1
cessibility and regional growth. This paper demonstrates that modern spatial econometrics allows modelling this
missing linkbetween regional economic indi- cators, like GDP, employment and firm growth, and rail traffic. In addition to that we show that infrastructure can have different effects on a regional and a national level. Our model approach allows us to forecast on both levels so that the aggregate infrastructure effect can be broken down to a regional level and the regional distribution can be assessed. This allows to analyse the question whether new infrastructure will hamper or foster regional economic convergence. As will be shown later effects in both directions can be observed when new infrastructure is installed.
We will describe a dynamic model that builds on regional data for the period 1995-2005 for 99 Austrian regions (politische Bezirke). We have called this model EAR (economic accessibility and regional) model, because we model regional growth as a function of infrastructure, regional economic indicators, demograph- ics, and traffic related accessibility. Until recently, the data base on a regional level was quite unreliable, even more so for smaller units. But our analysis shows that it is possible to explore economic relationships at a finer level, like political districts
1, as it was not possible in the past.
In this application of the Austrian EAR model we will focus on 3 regional economic indicators: GDP growth, employment growth and firm growth. For all of these indicators we will estimate a dynamic model and make a 30-year prediction, where we use improved accessibility as a major stimulus of future growth.
While the general model can discriminate between train and road accessibil- ity and between short-distance and long-distance accessibility, we will focus in
1Political districts do not follow the official Eurostat regional classification. They are sub- regions of Austrian NUTS-3 regions and are administrative Austrian regional units
2
this application on train accessibility. Since train accessibility is a quite gen- eral concept, we tried to focus this type of accessibility on three more traffic related features: a) travel times, b) frequency of connections, and c) traffic vol- ume. With this additional information we were able to construct the sensible accessibility variables that connect to the economics indicators that are the fo- cus variables in the EAR model. Interestingly, as the estimation results show, different accessibility indices are driving the economic activities in the Austrian regions.
This paper is organized as follows. Section 1 introduces the model and the concept of accessibility. Section 2 presents and discusses the model estimated and used. Section 3 presents the simulation results for two infrastructure projects and distinguishes between regional and aggregate effects. A final section concludes.
1 The model
Infrastructure is an important factor for economic growth and development of a region. A well-developed infrastructure ensures mobility of production factors within and across economies and should lead to a more efficient allocation and utilization of resources. Demographic structures are an important determinant for regional development, as e.g. in regions with an older population we cannot expect a high population growth. Another feature of the regional structure is the firm and population density. On average the prices of land in a region that is more densely populated will be higher. As a consequence the costs of establishing a firm will be higher in more densely populated areas.
3
1.1 Specification of the model
In a first step, all the potentially influential variables are included into a set of candidate variables for a BMA (Bayesian Model Averaging) analysis in a linear model, (see also LeSage and Parent, 2006 for spatial extension) to select the most probable model from this set. The set of variables has included dummy variables, regressors and their spatial lags, where different spatial weight matrices (W ) based on travel times were used as well as accessibility indicators. The weight matrices W we used included distances, travel times and nearest neighbors.
Given the selected (i.e. most probable) variables from a BMA analysis, the final model for each variable is estimated using Bayesian routines and estimators. We estimate a Bayesian heteroskedastic linear model using a hierarchical model for the variance inflation factors of the observations (see Geweke, 1993) together with a spatial autoregressive model as in LeSage (1997) based on the results of the BMA analysis.
2The ordinary linear model is given by the following equation
∆y
t=
c+
AItα+ ∆X
tβ+
t, (1) where where ∆y
tis the difference of the logged dependent variable (i.e. either cross-sectional GDP, employment or number of firms) at time t,
cis a constant.
AIt
is the matrix containing the selected set of accessibility indicators, ∆X
tis the matrix of differences of the log of other explanatory variables included in the regression, and
tis the vector of errors that are assumed to be heteroskedastic:
i,t ∼ N
(0, v
iσ2). For the inverse elements of the variance inflation factors
viwe
2For the estimation procedure we used the Econometric Toolbox for Matlab by J.P. LeSage (see LeSage, 1997 and http://www.spatial-econometrics.com).
4
assume a standardized
χ2-distribution with
rd.f., i.e.
v−1i ∼ χ2
(r)/r
∼Ga1[v
−1i |1, r] (2)
r ∼ Ga1
[ν
∗, λ∗]. (3)
We also tested for SAR model specifications, however, the non-SAR specifi- cations with AI indicators provided the best description of the data used for this analysis.
1.2 Accessibility
Polasek (2005) shows for central European countries that travel time improve- ments and reduced transport costs will have positive effects on the growth of these regions.
Although it is a popular argument in regional economics, accessibility is dif- ficult to measure directly ba single variable and can only be approximated in an econometric model. (see also Schuermann & Talaat, 2000, or Spiekermann &
Neubauer, 2002 for a discussion on accessibility indicators and concepts.) In this paper accessibility will be proxied in several ways. First of all, we will distinguish between train and road and between short-distance and long-distance accessibil- ity indicators. In general, there are three dimensions or special characteristics to accessibility:
1. Travel Times
Travel time is a central feature of accessibility as it is often related to either time or monetary costs for firms and for private persons.
2. Frequency of connections
5
As in supply-driven public transport systems, like the railways, the number of connections from one region to another is important for its accessibility.
3. Volume
The transport volume can be regarded as an indicator for the attractiveness of a region. Concerning goods transport volumes the flows between regions are an indicator of the market integration of these regions.
To implement the concept of accessibility in an econometric model, so-called accessibility indicators are constructed. The aim is to provide a set of indicators that can cover most of the aspects of the economic notion of accessibility. Let
A= (a
ij) be a positive quadratic travel time matrix with
i= 1, . . . , N and
j= 1, . . . , N . The distance between the n regions is given in matrix
B= (b
ij);
on the main diagonal there are only zero entries. (Each element of matrix
Acorresponds to an entry in matrix
Band has the same dimension.) Using these two matrices, an indicator, which summarizes the accessibility of region
i, can becalculated in the following way:
AIi
=
N
X
j=1
aijωij
, where
ωij=
bijPN
j=1bij
(4)
The weights
ωijare normalised across rows and measure the relative distance of regions
iand
jin comparison with other regions. A large value of
AIiin region
iis a bad indicator. This can be explained by considering two pairs of regions with the same distance between them (b
ij=
bi0j0,
i 6= i0and
j 6= j0) then the travel time can be different (a
ij 6= ai0j0), especially if the traffic infrastructure between the regions is different.
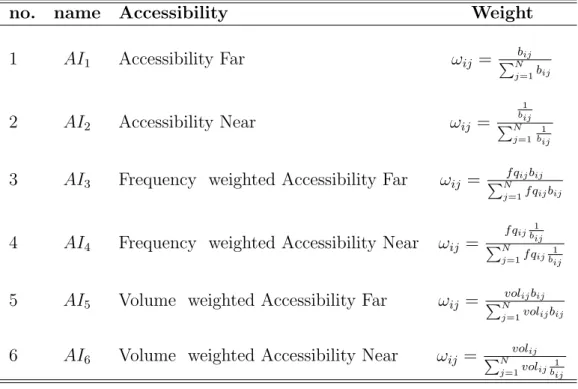
Table 1 shows the different accessibility indices based on different weighting schemes, which we will be used in the EAR model. Note that
long-distance indices6
Table 1: Train Accessibility Indicators (AI)
no. name Accessibility Weight
1
AI1Accessibility Far
ωij=
PNbijj=1bij
2
AI2Accessibility Near
ωij=
1 bij
PN j=1
1 bij
3
AI3Frequency weighted Accessibility Far
ωij=
PNf qijbij j=1f qijbij4
AI4Frequency weighted Accessibility Near
ωij=
f qij1 bij
PN j=1f qij 1
bij
5
AI5Volume weighted Accessibility Far
ωij=
PNvolijbij j=1volijbij6
AI6Volume weighted Accessibility Near
ωij=
PNvolij j=1volij 1bij
(i.e.
AI1,
AI3and
AI5) use distances as weights while the
local accessibility indices(i.e.
AI2,
AI4and
AI6) are calculated with the inverse weights of the long-distance accessibility indicator.
Apart from ordinary, frequency-weighted and volume-weighted indicators a further indicator was constructed to capture to connection of a location to a supra-regional center, which in our case are the capitals of NUTS-2 regions.
3. However the explanatory power of this indicator proved to be rather poor. As a consequence it was not included in the model.
In addition to train based travel times we also include road based travel times, where
AI7corresponds to
AI1,
AI8corresponds to
AI2but using road instead of train travel times.
3For the states of Lower Austria and the Burgenland two different sets of this indicator were used, either using the respective capitals of the states (Bundesland) or using Vienna as a central location in Austria
7
1.3 Data Base
Data on firms and employment have been obtained from ’Statistik Austria’ for the period 1998 - 2005 (report on ’Leistungs- & Strukturerhebung’). GDP data have been broken down to the 99 political districts from NUTS-3 level GDP by tax statistics. Travel times, connecting frequencies and individual traffic volumes as well as their changes have been provided by the Austrian federal railways (OeBB). Rail cargo volumes between the 99 political districts were obtained from the Statistik Austria for various years. The regional units in our analysis are the 99 Austrian political district.
2 Estimation Results
By applying Bayesian model averaging to the data set we selected the model with the highest posterior density and estimated a Bayesian heteroskedastic linear model (see Geweke, 1993) if the spatial lag was not included in the model and the spatial autoregressive model (see LeSage, 1997) in the other case. We found that in general the explanatory power of ordinary linear models provided the better description of the data, as the spatial lag was almost never significant and the effect of it was negligible. To further refine the estimates we dropped insignificant variables to obtain the following system of equations for GDP (gdp), employment (emp) and the number of firms (firm):
8
∆gdp =
c1+
α1,2ai2+
α1,7ai7+
α1,8ai8+
β1,1∆gdp
t−1+γ
1DU1+
1(5a)
∆emp =
c2+
α2,2ai2+
α2,7ai7+
α2,8ai8+
β2,1W∆gdp
t−1+γ
2DU2+
2(5b)
∆f irm =
c3+
α3,2ai2+
α3,5ai5+
α3,8ai8+
β3,1∆f irm
t−1+γ
3DU3+
3,(5c)
where all small letters are variables in logs,
ciis the constant in the respective equation and
iare the error terms of the respective equations. Each equation contains a different number of dummy variables for NUTS-2 regions to capture different growth of regions in different NUTS-2 regions as probably driven by dif- ferent incentives for setting up of firms, employment creation and general factors that might affect the development of regional GDP. This system was estimated equation by equation. Table 2 present the estimation results of the model.
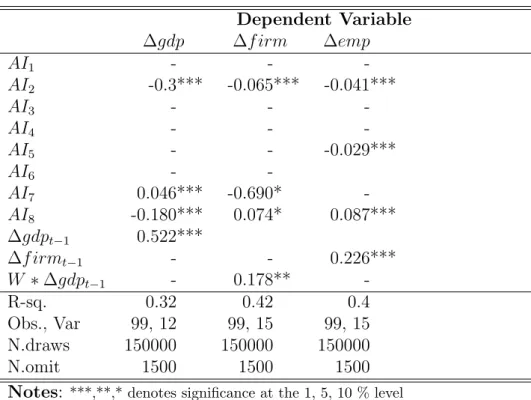
GDP growth reacts to the unweighted near accessibility railroad indicator, so does firm growth and employment growth. A significant influence could also be observed for the unweighted travel time accessibility on the road. Note that for the accessibility indicators a negative elasticity implies positive effects, as a negative change in the indicator implies an improvement in accessibility. For GDP growth a significant time lag was also found to influence contemporaneous GDP growth. Lagged neighboring GDP growth was found to be a determinant of firm growth. This means that if GDP growth accelerated in the past in neigh- boring districts, firm growth would also accelerate in the subsequent period. The spatial dependence was modeled using inverse travel times between the districts.
9
Table 2: Estimation Results
Dependent Variable∆gdp ∆f irm ∆emp
AI1
- - -
AI2
-0.3*** -0.065*** -0.041***
AI3
- - -
AI4
- - -
AI5
- - -0.029***
AI6
- -
AI7
0.046*** -0.690* -
AI8
-0.180*** 0.074* 0.087***
∆gdp
t−10.522***
∆f irm
t−1- - 0.226***
W ∗
∆gdp
t−1- 0.178** -
R-sq. 0.32 0.42 0.4
Obs., Var 99, 12 99, 15 99, 15
N.draws 150000 150000 150000
N.omit 1500 1500 1500
Notes: ***,**,* denotes significance at the 1, 5, 10 % level
W: inverse train travel times, 0 entries on the main diagonal,row normalized;
the coefficient estimates for the constant and NUTS-2 dummies are not shown here; the firm and employment equation include dummies for all 8 NUTS-2 regions for reasons explained above; in the GDP equation we dropped the NUTS-2 dummy for Lower Austria and Vorarlberg as these were almost never chosen by the Bayesian model averaging procedure and therefore displayed the smallest marginal posterior probability
For employment growth we find that firm growth appeared to be of a positive influence.
3 Simulation
In this section we use the estimated model to simulate the effect of two major train infrastructure improvements in Austria. The first subsection will present the general results of the two projects, whereas the second subsection will discuss the simulation results by comparing it to the past growth performance of the 99
10
Austrian political districts. Thus we are able to assess whether this infrastructure improvement lead to more or less convergence among Austrian regions.
The data for travel time improvements were provided by the Austrian federal railways (OeBB). Using these data we were able to determine the accessibility improvements (i.e. changes in the accessibility indicators), which were then used to shock the system of three equations in our system and simulate GDP, employ- ment effects as well as the effect on the number of firms in each region.
3.1 General simulation results
In this subsection we present the simulation results for two main train infrastruc- ture improvements, the tunnel project Semmering Basistunnel (SBT) and the Vienna central train station (VIE central).
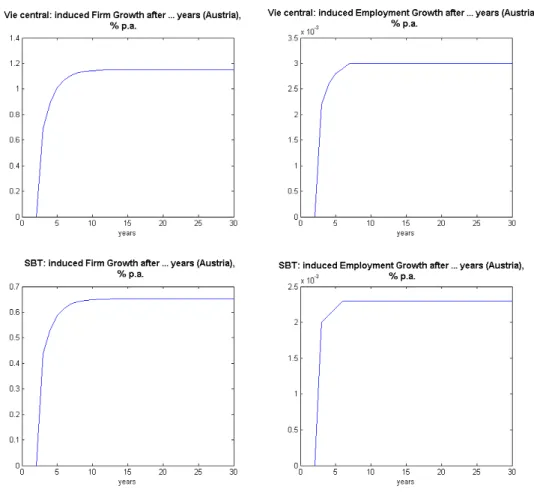
Figure 1 displays the effects of the operation of the Semmering tunnel as well as Vienna central station on a national level. As Aschauer (1989) and other au- thors would argue, the effect of new infrastructure increases only the level and not the growth rate of the Austrian economic performance, measured by the level of employment and the number of firms. The two top diagrams show the effect on cumulated firm and employment growth for the Vienna central station, the two lower diagrams the effect on employment & firm growth in the case of the Semmering tunnel. According to the model launching the Semmering Basistun- nel would increase the level of Austrian firms by 0.65 percent and employment by 0.0023 percent. In contrast to that launching Vienna central station would increase the number of Austrian firms by 1.1 percent and Austrian employment by 0.003 percent in the long run. The effect materializes almost completely in the first ten years of operation.
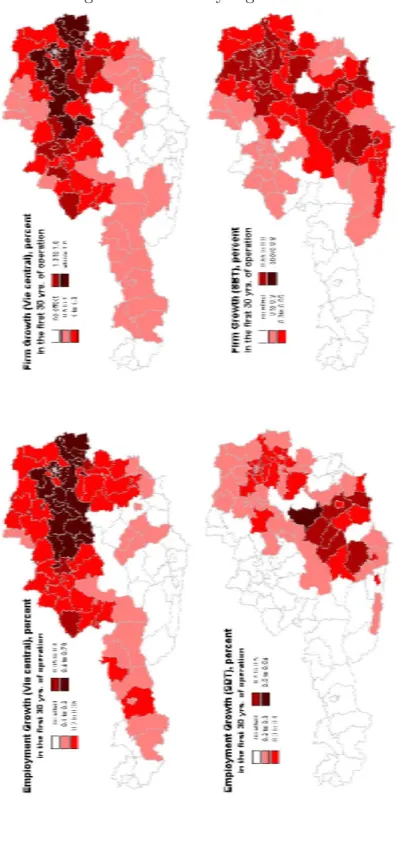
Disaggregating the effects to regional levels reveals that the regional pattern
11
Figure 1: Cumulative effects on the number of firms and the level of employment of the projects
is completely different in the two projects, displaed in figure 2. The Semmering tunnel, which is along the southern railway line in Eastern Austria would posi- tively impact the regions in North-Eastern (greater Vienna region) and Southern Austria (the NUTS-2 regions Styria and Carinthia). From the new Vienna cen- tral station regions in the north-east and along the Western railway lines would benefit. As these two examples demonstrate it is important to look at the inter- regional distribution of the effects of new infrastructure.
12
Figure 2: Results by regional units
13
3.2 Infrastructure and regional convergence
The question that can now be addressed is which project is better in helping less developed or structurally weak regions in improving their economic performance.
As infrastructure projects impact regions differently, they will potentially foster convergence or increase divergence of economic activity.
The classification of structurally weak regions is done by two variables:
re- gional unemploymentand
per-capita gross regional product. To identify struc-turally weak regions we split the sample into two groups with less/more than average Austrian GDP per capita. Apart from this we compare a particular re- gion’s unemployment rate with the Austrian average. According to these two criteria we define regions with high unemployment and low levels of GDP per capita structurally weak regions. This enables us to assess whether those regions will benefit more than regions with relatively low unemployment and high levels of GDP. If this is the case the infrastructure project fosters convergence among Austrian regions.
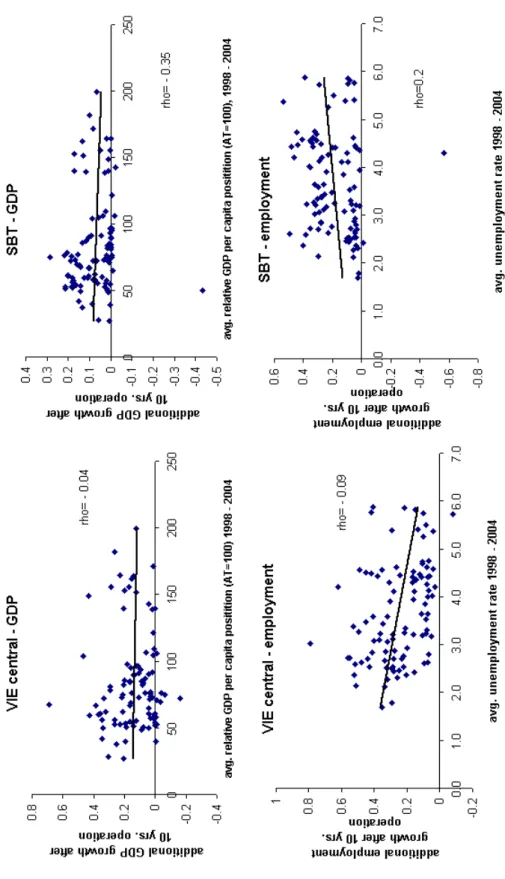
This can done by correlating the induced employment effects and past un- employment rates and induced GDP effects and past GDP per capita. In the first case we would observe a positive correlation between employment effects and unemployment rates indicating that most of the new jobs are being created in regions with high unemployment, if the infrastructure project fosters conver- gence. For the latter variable we would observe a negative correlation indicating that most of the new economic activity in concentrated in regions with low GDP per capita. The results for the two projects are presented in Figure 3.
We can observe for Vienna central station (VIE central) that there is hardly any evidence that this project will foster regional convergence. For GDP the correlation is rather small (-0.04) and for employment it is even negative (-0.09).
14
The Semmering tunnel (SBT) seems to do much better in terms of fostering the convergence between regions. The correlation for GDP and GDP per capita is negative (-0.35) and the correlation between induced employment effects and the unemployment rate is positive (+ 0.2).
15
Figure 3: Infrastructure effects and regional disparity
16
Summary
This paper developed a new regional approach to evaluate investments in new traffic infrastructure in Austria. The main model concentrates on a spatial econo- metric approach that captures the benefits of new infrastructure via the improve- ment of the accessibility of regions. Mobility is one key elements in modern mar- ket economies and therefore higher accessibility leads to a more efficient allocation of resources, which triggers productivity gains and stimulates growth.
This paper focuses on railway traffic infrastructure, especially on 2 larger rail projects in Austria: The new Vienna central station and the Semmering tunnel.
Whereas the new Vienna central station mainly benefits regions in the north and east of Austria, the Semmering tunnel mainly affects regions in the East and South of Austria. Even though both projects have similar overall effects on na- tional growth, the geographical pattern of regional effects differs substantially.
The Vienna central station shows no evidence that it will foster regional conver- gence. This follows from the fact that the beneficiaries of this project are the Vienna region and its neighbors, which already have low unemployment rates and are high income regions in Austria. In contrast to that the beneficiaries of the Semmering tunnel are structurally weak regions located in the east and Southeast of Austria. As a consequence, the tunnel project will increase regional convergence.
Thus, although the national effects of new infrastructure investment might be similar, the implications for regional policy makers can be quite different.
Our regional spatial model demonstrates, that these questions of infrastructure investment can be modelled to evaluate the impact for weak regions and growth in the long run and that regional accessibility models are a valuable tool for
17
economic policy makers as well as for regional and infrastructure economists.
References
Aschauer, D.A. (1989), Is public expenditure productive? Journal of Monetary Eco- nomics, 23, 177-200.
Baum, H. and Kurte, J. (2001), Transport and economic development. Paper prepared for the European Conference of Ministers of Transport (ECMT), Round Table 119, CEMT/RE/TR (2001)5.
Broecker, J., Meyer, R., Schneekloth, N., Schuermann, C., Spiekermann, K. and Wegener, M. (2004), Modelling the Socio-Economic and Spatial Impacts of EU Transport Policy Deliverable D6 of IASON (Integrated Appraisal of Spatial Eco- nomic and Network Effects of Transport Investments and Policies). Kiel, Chris- tian Albrechts University of Kiel.
European Conference of Ministers of Transport (2000): Assessing the Benefits of Transport (pre-publication version). Paris.
Geweke, J. (1993), Bayesian Treatment of the Independent Student-t Linear Model, Journal of Applied Econometrics, 8, s19-s40.
Krugman P. (1991), Increasing Returns and Economic Geography, Journal of Political Economy 99 (2), 843-499.
Lall, S.V. (2007), Infrastructure and regional growth, growth dynamics and policy relevance for India. Annals of Regional Science Vol. 41 (3), 581-599.
LeSage, J.P. and Parent, O. (2006), Bayesian Model Averaging for Spatial Economet- ric Models, Available at SSRN: http://ssrn.com/abstract=924608.
18
LeSage, J. P. (1997), Bayesian Estimation of Spatial Autoregressive Models. Interna- tional Regional Science Review, Volume 20 (1& 2), 113-129.
Polasek W. (2005), Improving Train Network until 2020: A stimulus for regional growth? unpublished manuscript, IHS Wien.
Polasek, W. and Schwarzbauer, W. (2006), Traffic Accessibility and the Effect on Firms and Population in 99 Austrian Regions, IHS Economic Series No. 198, November.
Schuermann, C. and Talaat, A. (2000),Towards a European Peripherality Index. Final Report for DG Regional Policy of the European Commission, Brussels.
Spiekermann, K. and Neubauer, J. (2002), European Accessibility and Peripherality:
Concepts, Models and Indicators, Nordregio Working Paper No. 9.
Steininger, K., Schmid, C., Braumann, A. (2007), New Primary Road Transport Infrastructure and the Spatial Distribution of Growth: A Spatial CGE Analysis for an Eastern Austrian Border Region, paper presented at the Annual Meeting of the Austrian Economic Association (NOeG) Klagenfurt, Austria.
19
Authors: Wolfgang Polasek, Wolfgang Schwarzbauer, Richard Sellner Title: Aggregate and Regional Economic Effects of New Railway Infrastructure Reihe Ökonomie / Economics Series 242
Editor: Robert M. Kunst (Econometrics)
Associate Editors: Walter Fisher (Macroeconomics), Klaus Ritzberger (Microeconomics)
ISSN: 1605-7996
© 2009 by the Department of Economics and Finance, Institute for Advanced Studies (IHS),
Stumpergasse 56, A-1060 Vienna +43 1 59991-0 Fax +43 1 59991-555 http://www.ihs.ac.at
ISSN: 1605-7996